
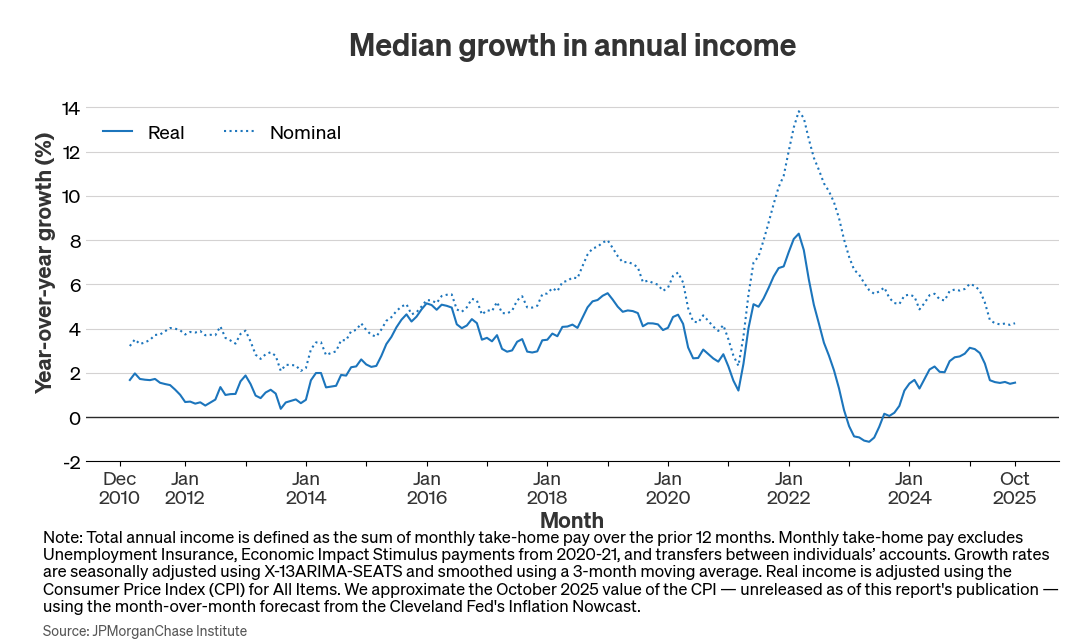
Figure 1. Median real income growth fell in early 2025 and as of October remained near levels observed during the weak labor market in the early 2010s.

Creating thriving communities together
See how our clients and partners—from small business owners to workforce training leaders—work with JPMorganChase to drive meaningful impact and economic growth where they live and work.
Learn moreLatest news

Veteran’s Unconventional Path to Landing her Dream Job in Tech
U.S. Army Veteran Ashley Wigfall transitioned to a civilian role and charted her path to technologist through mentorship and skills training at the JPMorgan Chase tech hub in Plano, Texas.
Learn more
Research
November 25, 2025
Households are going into the end of the year with weak income growth and bank balances that remain flat, after adjusting for inflation. Young people continue to underperform the typical early career growth pattern amid the slowdown in hiring, while about half of workers aged 50-54 are experiencing negative real year-over-year income growth as of October 2025. Households’ cash balances have been holding steady on a real basis, although households putting more money in higher yield alternatives may be weighing on bank balance growth. With pandemic-era excess cash liquidity in the rearview mirror, consumers are facing a holiday spending season with budgets tempered by tepid income growth but augmented by strong stock market gains—the latter highly unequally distributed.
The labor market has been trending softer, albeit with a wide band of uncertainty, and inflation pressures remain prominent.1 Aggregate spending growth has remained resilient this year, according to a range of indicators, while bank account balances remain flat and the savings rate has been below pre-pandemic trends.2 In this brief, we provide an update on household financial health, covering median real income growth and cash savings dynamics.3
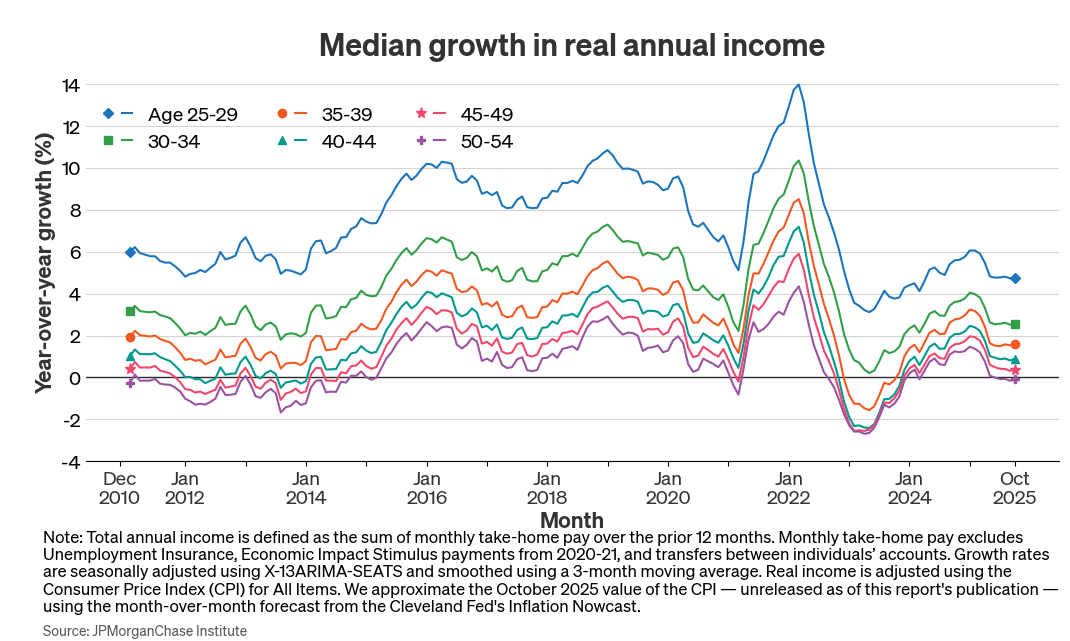
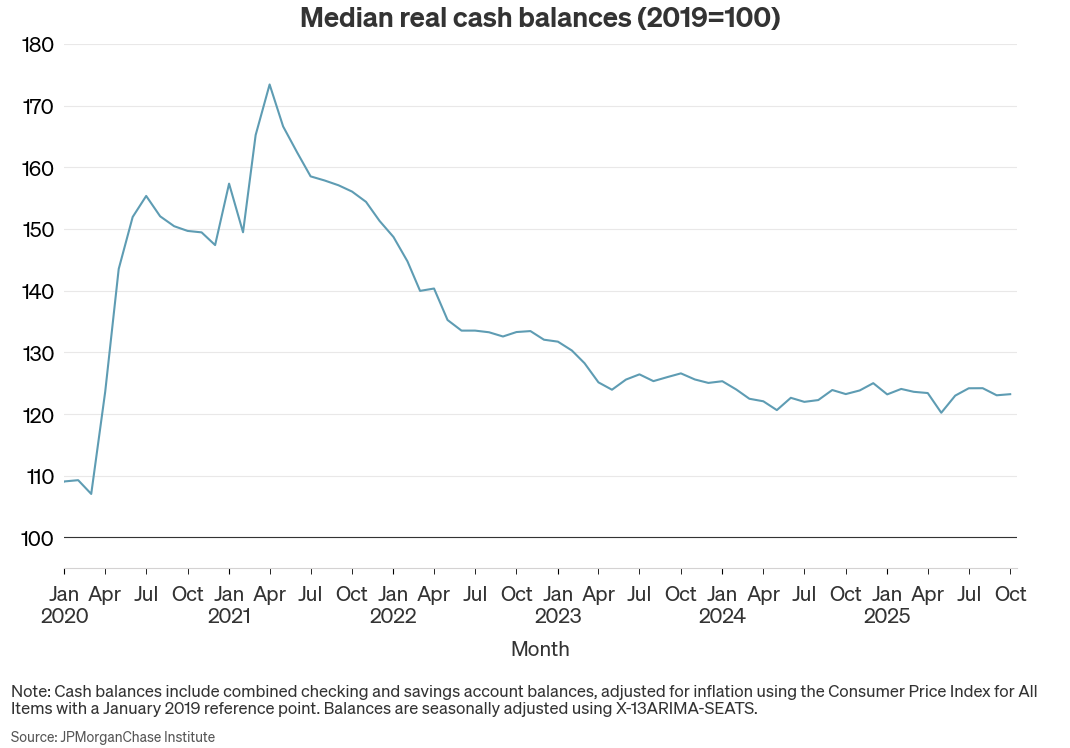
Median real income growth has been steady at a low level for several months, with the October reading below 2 percent for prime-aged individuals—close to the range observed over the early 2010s when the labor market was weak. Growth for individuals aged 25–29 is below historic trends for younger workers. Workers aged 50-54, who have higher income levels but lower growth, are now experiencing negative growth in purchasing power. While median real cash balance levels have been stable over most of 2025, this differs from pre-pandemic trends, where real balances grew steadily as households aged. Higher-income individuals have had continued decreases in real balances, potentially a result of transfers to higher yielding accounts.
Going into the end of the year, many consumers’ budgets will be constrained by stagnant real income growth, though some may draw on ample stock market gains to augment spending. Especially among younger and lower-income individuals—who are relatively disadvantaged by high housing costs and hold less stock market wealth—consumers may have just enough to spend, but not enough to splurge.4
As of October, median income growth for prime-age individuals—those between 25–54 years old—was 1.6 percent in real terms, adjusting for changes in the Consumer Price Index for All Items.5 Figure 1 shows that the recent level is within the range observed in the early 2010s, when the unemployment rate averaged 7 percent, notably higher than the current 4.3 percent level. The last period of sustained growth below the current reading was in the early 2010s, when the unemployment rate was still elevated from the Great Recession. Importantly, nominal growth remains roughly consistent with pre-pandemic levels, but real purchasing power gains are at a relatively low level because of the higher pace of consumer price increases.
Figure 1. Median real income growth fell in early 2025 and as of October remained near levels observed during the weak labor market in the early 2010s.
While younger workers are experiencing slow growth relative to their usual rapid pace, the slowdown in overall growth means that older workers’ nominal gains are now slightly below CPI inflation. The Institute’s last update emphasized the disproportionate effect of the low hiring rates for younger people, who rely on job switching to advance their careers. While this is true, negative real growth for older workers can lead to challenging adjustments, especially for lower-wealth individuals who haven’t benefitted from years of strong gains in housing and stock prices. The 50-54 age group previously saw negative real annual growth during the post-pandemic inflation, along with some of the other age groups, and during the early 2010s. While older workers have higher and more stable pay, their slower annual gains make it easier for an uptick in inflation or weakening in the labor market to send them into negative territory. 6
Median real bank balances in October 2025 are up 23 percent relative to pre-pandemic levels in 2019, but have been flat since early 2024.7 During the pandemic, balance growth dramatically outpaced typical annual growth and households accrued large cash balances, which then decreased over time. Balances stopped decreasing and remained relatively steady from early 2024 onward, but we would expect balances to increase over time as households age and income and savings increase. For example, during the five years prior to the pandemic, real cash balances grew steadily at a rate of just over 6 percent per year.8 If balances had grown at that rate since the start of 2020, they would be up 40 percent in October 2025 relative to 2019. However, those historical trends are based on a period of higher income growth that has not continued into recent years, as shown in Finding 1. Lower income growth would typically lead to lower balance growth. However, flat balance growth still indicates that households might not be accumulating cash savings as we would expect, keeping up with inflation but otherwise not amassing additional cash reserves in their checking and savings accounts.
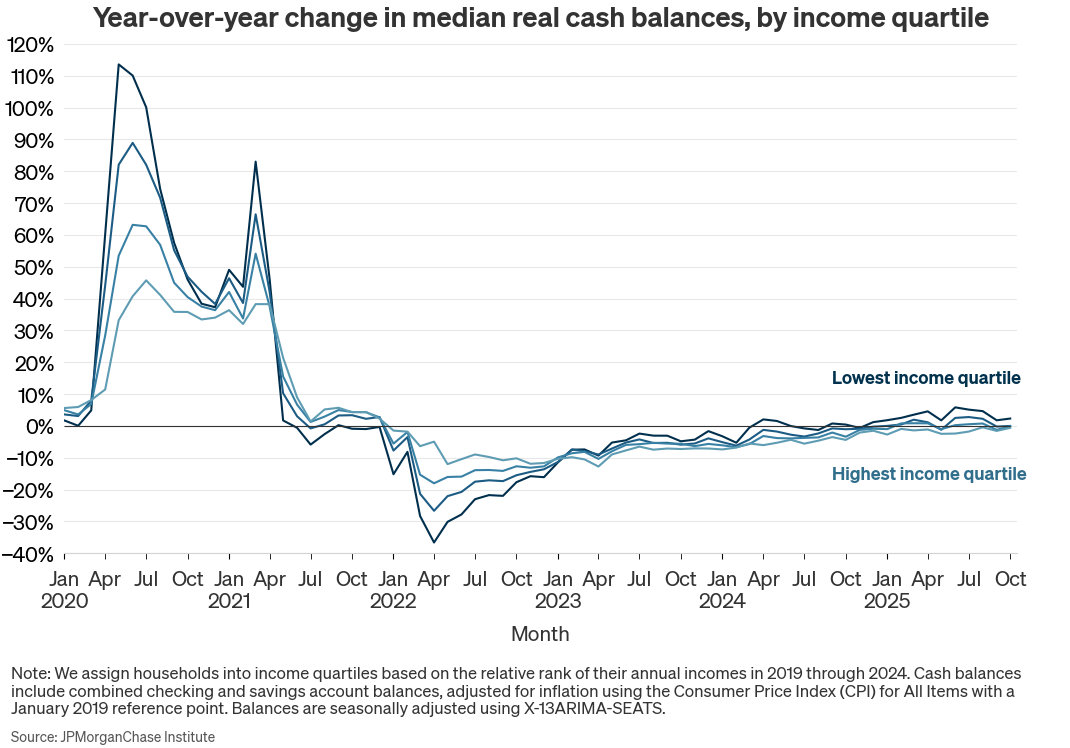
We observe different trends in checking and savings account balance growth by income, with low-income households returning to positive year-over-year growth last year, while balances are still declining slightly for high-income households.9 Across income quartiles, balance growth turned negative in 2022 as households depleted their post-pandemic elevated cash reserves. Balances rebounded faster for low-income households, changing from negative to positive growth in September 2024, with growth of 2 to 6 percent during 2025, dipping slightly to 1 percent in October 2025. In contrast, high-income households’ bank balances continue to decline, though at a slowing rate: only 2 percent negative in October 2025.
The above trends are based only on checking and savings account balances, but the use of investment brokerage accounts has increased notably in recent years and has remained elevated. Although investment activity increased for all income groups, the ratio of high-to-low-income investors was at least two-to-one from 2020 onward, meaning that high-income households will likely have benefitted the most from investment gains (Wheat and Eckerd 2024). If households have increased the share of their cash reserves kept outside of checking and savings accounts, bank balances may continue to decrease even while total cash reserves increase, and we would expect bank balances to be below historical trends.
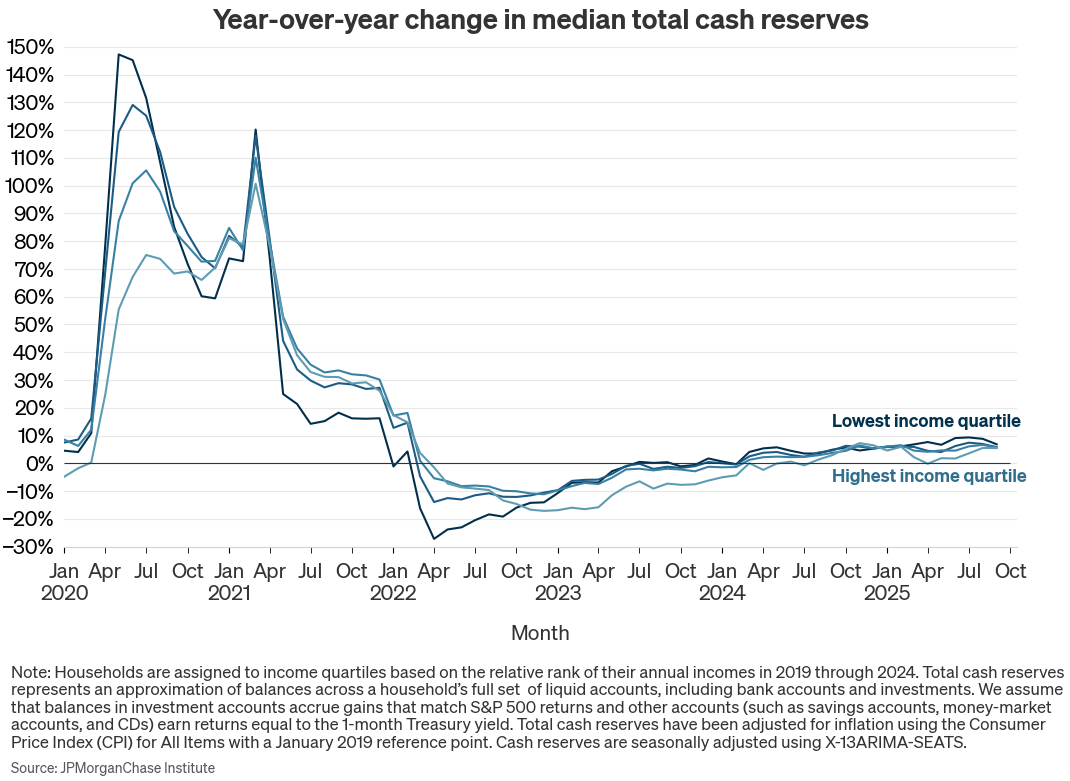
While we cannot directly observe total cash reserves, we approximate balances across a household’s full set of liquid accounts by tallying observed transfers out of checking and savings accounts and approximating returns to those investments over time.10 Figure 5 shows that total cash reserves have grown more than bank balances alone, with growth positive for all income groups for at least the last year. Overall, total cash reserves appear to be on the rise once we account for the fact that households are holding a greater share of their cash outside of their checking and savings accounts.
We are thankful to the many people who made essential contributions to this research, including Francesca Guiso. We are indebted to our internal partners and colleagues, who support delivery of our agenda in a myriad of ways and acknowledge their contributions to each and all releases.
This material is a product of JPMorganChase Institute and is provided to you solely for general information purposes. Unless otherwise specifically stated, any views or opinions expressed herein are solely those of the authors listed and may differ from the views and opinions expressed by J.P. Morgan Securities LLC (JPMS) Research Department or other departments or divisions of JPMorgan Chase & Co. or its affiliates. This material is not a product of the Research Department of JPMS. Information has been obtained from sources believed to be reliable, but JPMorgan Chase & Co. or its affiliates and/or subsidiaries (collectively J.P. Morgan) do not warrant its completeness or accuracy. Opinions and estimates constitute our judgment as of the date of this material and are subject to change without notice. No representation or warranty should be made with regard to any computations, graphs, tables, diagrams or commentary in this material, which is provided for illustration/reference purposes only. The data relied on for this report are based on past transactions and may not be indicative of future results. J.P. Morgan assumes no duty to update any information in this material in the event that such information changes. The opinion herein should not be construed as an individual recommendation for any particular client and is not intended as advice or recommendations of particular securities, financial instruments, or strategies for a particular client. This material does not constitute a solicitation or offer in any jurisdiction where such a solicitation is unlawful.
Wheat, Chris, George Eckerd, Daniel M. Sullivan, and Erica Deadman. 2025. “Real income sustains weak trend, while cash liquidity remains stable.” JPMorganChase Institute. https://www.jpmorganchase.com/institute/all-topics/financial-health-wealth-creation/real-income-sustains-weak-trend-cash-liquidity-remains-stable.
Guvenen, Fatih, Fatih Karahan, Serdar Ozkan, and Jae Song. 2015, revised 2019. “What Do Data on Millions of U.S. Workers Reveal about Life-Cycle Earnings Dynamics?” Federal Reserve Bank of New York Staff Reports, no.710. https://www.newyorkfed.org/medialibrary/media/research/staff_reports/sr710.pdf
Wheat, Chris, and George Eckerd. 2023. “Household Cash Buffer Management from the Great Recession through COVID-19.” JPMorgan Chase Institute. https://www.jpmorganchase.com/institute/all-topics/financial-health-wealth-creation/household-cash-buffer-management-from-the-great-recession-through-covid-19
Wheat, Chris, and George Eckerd. 2024. “The Rise in Retail Investing: Roles of the Economic Cycle and Income Growth.” JPMorgan Chase Institute. https://www.jpmorganchase.com/institute/all-topics/financial-health-wealth-creation/the-rise-in-retail-investing-roles-of-the-economic-cycle-and-income-growth
Wheat, Chris, and George Eckerd. 2025a. “Real income growth shifts down, especially for the young.” JPMorganChase Institute. https://www.jpmorganchase.com/institute/all-topics/financial-health-wealth-creation/real-income-growth-shifts-down-especially-for-the-young
Wheat, Chris, and George Eckerd. 2025b. “The Affordability Gap: Is home ownership still within reach in today’s economy?” JPMorganChase Institute. https://www.jpmorganchase.com/institute/all-topics/community-development/the-affordability-gap-is-home-ownership-still-within-reach-in-todays-economy.
Wheat, Chris, Makada Henry-Nickie, Pascal Noel, and Scott Kim. 2025. “When the rent comes due: Impact of inflation on renters' financial security.” JPMorganChase Institute. https://www.jpmorganchase.com/institute/all-topics/community-development/inflation-impact-on-renters
Wheat, Chris, Erica Deadman, and Daniel M. Sullivan. 2025. “Household Finances Pulse through May 2025: Bank balances are flat but total savings are growing again.” JPMorganChase Institute. https://www.jpmorganchase.com/institute/all-topics/financial-health-wealth-creation/household-finances-pulse-through-may-2025
For example, an index of retail spending produced by the Chicago Fed (CARTS) shows nominal retail sales growing at a fairly stable 4 percent rate on a year-on-year basis throughout 2025—including the forecasts for September and October 2025—versus 3 percent over 2024. The Bureau of Economic Analysis’s personal savings rate was 4.6 as of August 2025, down from 5.2 percent in August 2024 and an average of 7 percent over 2019.
We leverage representative sample of deidentified financial data from Chase customers. Our income measure captures take-home pay, comprising inflows into checking accounts, excluding transactions such as Unemployment Insurance, Economic Impact payments from 2020-21, and transfers between individual’s accounts. Cash balances comprise checking and savings accounts and an approximation of total cash reserves. For further details on the construction of the income data see Wheat and Eckerd (2025a), and for further details on the construction of the balances data see Wheat, Deadman, and Sullivan (2025).
See Wheat and Eckerd (2025b) for further discussion on housing affordability, age, and financial wealth.
To align with the income measure, the price adjustment for October 2025 is the percent change in CPI from October 2024 to September 2025 relative to October 2023 to September 2024.
Guvenen et al. (2019) show the tendency for the level and standard deviation of income growth to decline over the course of people’s working lives.
Cash buffers—balances scaled to spending—are generally stable within a household, even as balances increase over time. Research shows that individuals tend to maintain relatively stable cash buffer levels over time, spending down excess cash when balances are elevated until they return to their usual cash buffer level, at which point they stop dissaving (Wheat and Eckerd 2023).
We constructed a historical sample using the same filters as our main Pulse sample, covering January 2015 through February 2020. Median bank balances in this sample have an annual growth rate of just over 6 percent. To account for differences in sample composition, medians in the 2015 sample were weighted based on the joint distribution of income and age in the main Pulse sample.
Our income quartiles are based on adjusted income, which is all checking account inflows minus transfers, Economic Impact Payments (EIP), and Unemployment Insurance (UI). We then establish quartiles using adjusted income from all complete calendar years in our sample, 2019 through 2024: within each year, we determine a household’s relative income rank among all households in our sample, and then take the average of the household’s adjusted income rank across all years. This average rank is used to determine final income quartiles.
We do not directly observe the balances in external investment and savings accounts, and our total cash reserve metric is a conservative approximation that represents the likely lower-bound of possible external cash reserves. Because investment balances are constructed by summing transfers out of the household’s checking and savings accounts, each household begins with $0 balances at the start of our sample in January 2019. We accumulate transfer cashflows and measure increases and decreases going forward. Some households would have had substantial starting balances that we are unable to capture, so our total cash reserve metric represents a lower-bound of possible unobserved balances, indicative of increasing trends in cash reserves held in investments, but not accurate to the levels of cash held in those accounts. We account for potential returns to those additional accounts assuming that balances in investment accounts accrue gains that match S&P 500 returns and other accounts (such as savings accounts, money-market accounts, and CDs) earn returns equal to the 10-year Treasury yield.
Treasury yield data: https://fred.stlouisfed.org/series/DGS10
S&P 500 return data: https://fred.stlouisfed.org/series/SP500
Note that we approximate S&P 500 returns only from capital gains and not dividends, which will slightly underestimate true returns.

Chris Wheat
President, JPMorganChase Institute

Daniel M. Sullivan
Consumer Research Director, JPMorganChase Institute

George Eckerd
Wealth and Markets Research Director, JPMorganChase Institute

Erica Deadman
Consumer Research Lead, JPMorganChase Institute
Shelby Wagenseller, Shelby.Wagenseller@jpmchase.com