
Figure 1. Rent hikes act as a sudden, inflation-driven “squeeze” on household budgets—with a median 5.6 percent in added housing costs—and compound cost-of-living pressures.

Creating thriving communities together
See how our clients and partners—from small business owners to workforce training leaders—work with JPMorganChase to drive meaningful impact and economic growth where they live and work.
Learn moreLatest news

Veteran’s Unconventional Path to Landing her Dream Job in Tech
U.S. Army Veteran Ashley Wigfall transitioned to a civilian role and charted her path to technologist through mentorship and skills training at the JPMorgan Chase tech hub in Plano, Texas.
Learn more
Research
June 17, 2025
In recent years, a surge in broad-based inflationary pressures has shaped the economic landscape. Rising housing costs, particularly rents, have emerged as a prominent driver of the increased cost of living for many households. Against this backdrop, key questions arise: How do renters adjust when their rent goes up? What gets cut? And who is affected most? While the role of rent inflation in the broader economy is well known, the precise ways in which rent increases reshape renters’ financial lives remain underexplored.
This report provides new evidence on how renters absorb increases and traces the subsequent adjustments in non-housing consumption in response to growing housing costs. Overall, we find that rising rents can add significant financial strain for renters, particularly those spending more than 50 percent of their income on rent.
Key findings
Our research findings highlight the tangible financial trade-offs renters make when faced with rising housing costs and underscore the heterogeneity of those impacts. With these insights, we inform policymakers’ understanding of the micro-level consequences of rising rents on the financial resilience of renter households. Our insights aim to inform policy discussions on renter vulnerability, inflation dynamics, and the broader ripple effects of rising housing costs.
Persistent inflation and escalating housing costs present a complex economic landscape for renter households. Over the last few years, rising shelter costs have played a notable role in driving inflation above Federal Reserve targets. Rent, a core component of housing costs, constitutes a significant share of official inflation measures, approximating one-third of headline consumer price indices.i As of December 2024, the Bureau of Labor Statistics established that shelter constituted a substantial portion of the Consumer Price Index (CPI), holding a relative importance of 35.5 percent, up from the 2021 benchmark of 32.9 percent. Rent inflation has been a defining feature of the post-pandemic economy that has shaped the financial lives of 45.4 million renters across the U.S., over 21 million of these households are rent burdened.ii
The Consumer Financial Protection Bureau (CFPB) reported that nearly 30 percent of renters reported struggling to pay rent at least once in 2023 (CFPB, 2025). Meanwhile, survey research from the Urban Institute finds that as many as 68 percent of renters have reduced savings and more than 75 percent have cut back on spending to keep up with housing costs (Choi, Burton, and Reynolds 2024). These self-reported patterns mirror the patterns we observe in our data: rent increases reshape what households can afford. Even as inflation moderates, millions of renter households remain locked into higher leases signed during that peak. For households already operating with limited liquidity, these rent increases represent a meaningful pressure on financial stability (Krueger, Malkov, and Perri, 2023).
While the role of rent inflation in the broader economy is well-known, the precise ways in which rent increases reshape renters’ financial choices remain an area for ongoing exploration. This report addresses key questions: How do renters adjust when their rent goes up? What gets cut? And who is affected most?
Our empirical analysis unfolds in four stages. The study analyses the period from August 2021 to July 2023, a critical phase in the post-pandemic housing market. Rent inflation accelerated sharply during this window, coinciding with broader macroeconomic shifts, including the tapering of federal stimulus, rising interest rates, and evolving labor market conditions. We selected this window to capture both the onset and persistence of rent-driven affordability pressures. First, we document the scale of rent increases experienced by renter households in our sample. Second, we assess how these increases translate into changes in housing affordability, measured by shifts in rent-to-income ratios. Third, we employ an event study approach to analyze short-term adjustments in non-housing spending around the time of the rent increase. Finally, we use regression models to quantify the magnitude of these spending adjustments, specifically estimating the dollar and proportional adjustments driven by higher rent payments.
We draw on administrative data that links individuals’ rent payments to local rent market conditions at the ZIP-code level. Using anonymized transactions from Chase deposit accounts, we created a panel of 85,297 renters whose monthly rent increased between August 2021 and July 2023. To study renters’ budget changes in response to these increases, along with the new rent payment we record monthly outflows on durable, nondurables, and other categories.
We focus on renters who stay within the same ZIP code after their rent increases, allowing us to isolate the impact of higher rent without the confounding effects of moving to a new neighborhood. These household-level rent records are then merged with localized “spot rent” signals from a proprietary housing data platform. This combined data asset enables us to quantify how households respond to localized rent hikes.
Note: full methodology and sample construction details are included in Technical Appendix.
Rent hikes, even when modest, act as an inflationary “squeeze,” compounding cost-of-living challenges.
Between August 2021 and July 2023, a period marked by historically elevated rent inflation, renters in our sample faced an average rent increase of approximately 6.6 percent, which translates to added monthly rent outlays of roughly $86 more per month or $1,032 annually. This increase aligns with broader national trends, including those documented by the Bureau of Labor Statistics’ (BLS) New Tenant Rent Index and other major housing market indices.iii According to the BLS, during this same period, the average year-over-year increase in the national CPI-Rent was 6.1 percent.iv Given housing typically is the largest single expenditure for most families, an increase of this magnitude can have a meaningful impact on renters’ financial outlook.
It is important to note that these official price indices tend to smooth out price changes and can lag behind the more immediate shifts seen in new market rates. Nationally, rents have shown signs of cooling, but rent shocks are already embedded in the budgets of incumbent renters, such that in the immediate term, these renters may not fully benefit from the moderation in asking rents. For instance, Zillow’s March 2025 rental report showed a typical asking rent of $2,005 for an apartment unit, up 33.9 percent since April 2020.v According to Zillow, these trends have pushed the median rent-to-income ratio to 29.4 percent; where affording the asking rent now requires an annual household income of $80,204. Various market indicators suggest renter pressure is notable, with incumbents locked into high-cost leases and new renters entering a changed rental affordability landscape.
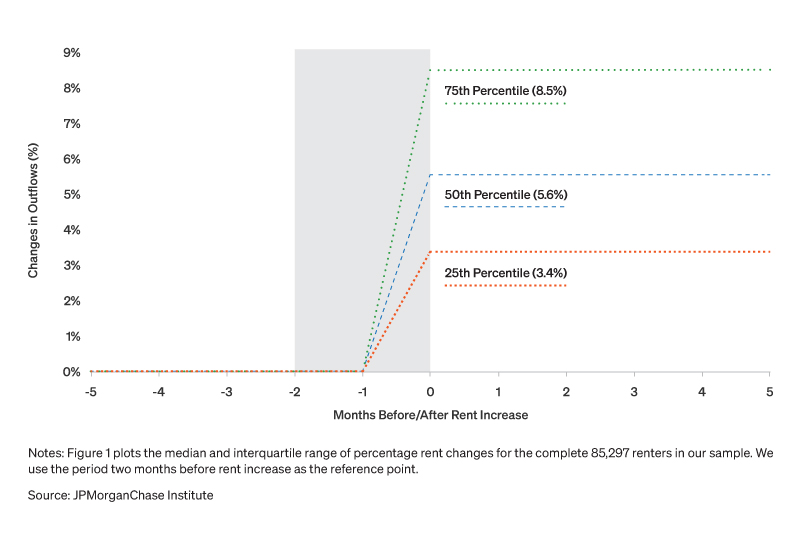
Figure 1. Rent hikes act as a sudden, inflation-driven “squeeze” on household budgets—with a median 5.6 percent in added housing costs—and compound cost-of-living pressures.
Placing our observed increase in context, an additional $1,032 per year in housing costs could manifest as a non-trivial constraint on lower income households. This is particularly salient given the modest wage growth many renters experienced during this period when inflation surged. For much of the inflation surge period (mid-2021 to late 2023), the Federal Reserve Bank of Atlanta’s Wage Growth Tracker, while showing robust nominal wage growth, often lagged behind the accelerated pace of rent increases.vi In January 2023, for example, the Wage Growth Tracker (weighted) stood at 5.9 percent, yet the BLS CPI for Rent of Primary Residences surged to 8.1 percent. By July 2023, the end of our study window, wage growth was 5.7 percent, while Rent on Primary Residence was 8.1 percent. With purchasing power of wages lagging behind the ramp up in living costs, moderate increases gain significance for renters already balancing tight budgets.
While averages provide a useful summary, the experience of rent increases was not uniform. As shown in Figure 1, this period was marked by considerable variation across individual renters. Those at the lower quartile of the rent increase distribution faced more modest adjustments, around 3.4 percent, whereas renters at the upper quartile experienced sharper increases, around 8.5 percent ($103 per month). This wide variation implies substantial differences in the scale of renters’ adjustments. For some, the rent increase might represent manageable belt tightening. For others, especially those already at the edge of the affordability margin, it could necessitate meaningful financial trade-offs, impacting other essential consumption expenditures.
These varied rent increases carry important implications for housing affordability. The timing and size of the increase, combined with the renter’s financial position, determines how deeply the shock is felt. Such heterogeneity makes clear that rising rents are not just a cost-of-living headline: they represent a lived financial event, one with real implications for how households manage their budgets in the months that follow. While renters adapt to increased costs in a variety of ways, one critical pathway is through changes in housing affordability, namely how much of their income rent consumes. The subsequent sections examine how rent increases translate into shifts in affordability. Understanding how these different rent experiences impact renters’ affordability status is vital to assessing their financial well-being.
Rent affordability declines, with more renters tipping into burden amid growing overall pressures.
Rent increases not only raise housing costs, they also reshape the share of income households must devote to paying rent. Having established the magnitude and variability of rent increases, we now turn to how these increases translate into affordability shifts.
The Joint Center for Housing Studies of Harvard University (JHCS) 2024 State of the Nation’s Housing report revealed the median low-income renter in 2022 was left with a mere $310 in disposable income after covering rent, underscoring the implications of escalating unaffordability. To assess the extent of this issue, we categorize renters into three distinct groups based on their rent-to-income ratio: Not Burdened, encompasses those spending less than 30% of income on rent; Burdened includes those spending between 30 and 50 percent of their income on rent; and Severely Burdened, represents individuals dedicating more than 50 percent of their income to rent. These widely accepted affordability thresholds serve as important and often institutionalized benchmarks for gauging financial strain. Agencies like the Department of Housing and Urban Development (HUD) use them to determine eligibility for housing assistance programs.vii Furthermore, research by Shamsuddin and Campbell (2021) demonstrates an increase in material hardship as cost burden approaches the 50 percent mark. With half of all renter households being classified as Burdened by their housing costs, documenting how rent burden shifts in response to rent hikes is essential to assessing the economic resilience of renter households (U.S. Census, 2024).viii
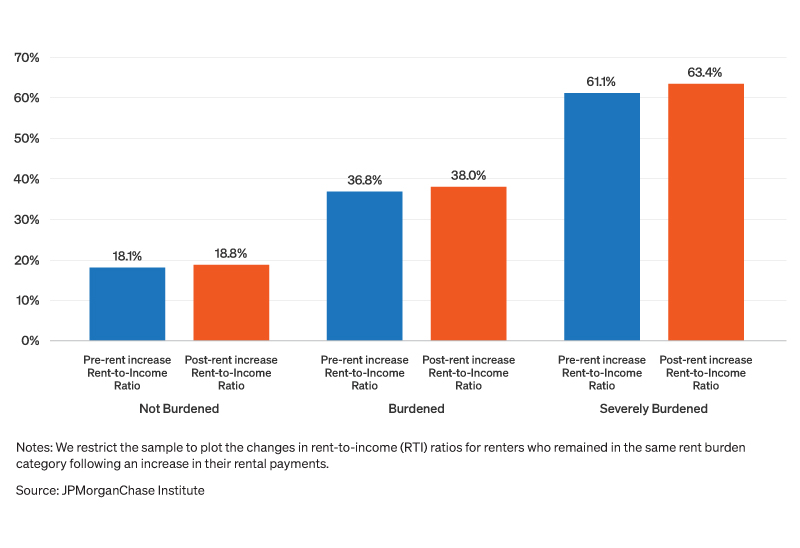
For interpretability, we differentiate between renters whose burden status held constant from those whose burden classification changed over the study window. Figure 2 demonstrates that affordability pressures are growing across the burden spectrum.ix Renters already classified as Severely Burdened experienced a further escalation in their median burden, climbing from an already high 61.1 to 63.4 percent. This 2.3 percentage point increase in the share of disposable income allocated to rent leaves even less financial flexibility for other essential expenses. Similar, albeit less drastic, trends were observed among less constrained segments. Not Burdened renters, for instance, saw a noticeable deterioration in affordability, with their median rent-to-income ratio rising from 18.1 to 18.8 percent. Concurrently, those consistently in the Burdened group saw their median rent burden climb from 36.8 to 38.0 percent. For these Burdened renters, now dedicating close to 40 percent of their income to rent, this intensification leaves minimal buffers to absorb future rent increases or additional cost-of-living expenses.
Figure 2. More renters experience higher rent-to-income ratios following increases, even for those not previously cost-burdened, with affordability pressures disproportionately intensifying among Severely Burdened renters.
Beyond merely intensifying existing housing cost burdens, rising rents have systematically driven a re-distribution of renters into higher burden categories, fundamentally reshaping the affordability landscape for some renter households. For instance, the proportion of renters in our sample categorized as Not Burdened, those previously facing manageable housing cost, decreased from 71.7 to 68.2 percent, representing a 4.9 percent decline in their overall share. This reduction implies that even renters who once experienced fewer affordability pressures now face tighter budget constraints, as rent increases consume a larger share of their income. Similarly, renters categorized as Burdened also experienced shifts, with the group’s share decreasing from 21.8 to 24.2 percent. This increase in the overall share of Burdened renters indicates that previously Not Burdened renters entered this higher-cost category, potentially limiting their financial flexibility amidst overall growing pressures.x This shift indicates a meaningful share of renters in the Burdened group experienced intensified pressure, with a portion transitioning into the most severe category.
Meanwhile, the share of Severely Burdened renters, those dedicating over 50 percent of their income to housing, increased from 6.5 to 7.7 percent of the total renter population after rent increase, representing a 17.7 percent rise in their share after rent increase. These concerning patterns of deteriorating affordability align with broader research, as highlighted by Colburn et al. (2024), indicating an increasing number of families are now experiencing housing cost burden, they noted middle and upper income households drove this trend. Crossing into deeper burden territory, particularly into severe burden, is associated with meaningful negative welfare consequences, including food insecurity, difficulty paying bills, and medical hardships, as demonstrated by Shamsuddin and Campbell (2021).
The financial pressures emanating from rising rents are not confined to marginal adjustments; they can demonstrably reduce affordability in real terms. These impacts are most acutely felt when even modest individual increases in rent-to-income ratios accumulate to push renters across policy-relevant affordability thresholds, which serve as critical benchmarks for assessing financial strain or determining eligibility for subsidy programs. Our findings illustrate clearly that the higher the pre-increase burden, the sharper the increase in absolute post-rent burden. These burden progressions are more than merely numerical shifts; they could signal a rising risk of financial distress, especially when fundamental living needs are overshadowed by a primarily fixed cost. Interestingly, we identified a cohort of renters who saw contemporaneous improvements in their rent-to-income ratio. We interpret these apparent improvements cautiously. Some of observed improvements could be due to temporary spikes in non-recurrent income, such as intermittent gig work or seasonal employment, that might not reflect sustained improvements in an individual’s earning capacity or a genuine escape from housing affordability challenges.
These findings resonate with broader trends observed in the affordability literature. According to JHCS, housing burden has systematically risen across all income levels. As of 2022, 65 percent of renters earning under $30,000 annually were severely cost burdened. Framed within the context of our research, the mean $86 monthly rent increase would consume nearly 28 percent of the remaining buffer for a low-income household with only $310 in residual income, even before accounting for essential expenditures like food, transportation, or utilities. Within the context of already slim financial buffers, a rent increase transcends a mere marginal cost; it can manifest as an amplification force that impacts these precarious margins, compelling renters to compromise on essentials or make difficult trade-offs.
While the scope of this report does not focus on migration, it is noteworthy that a small share of renters (about 2.4 percent) relocated across ZIP codes following a rent increase. These cross-ZIP movers are almost three times as likely to experience a rent decrease, suggesting that relocation can serve as a coping strategy, though it is not universally accessible to all renters. While moving to more affordable neighborhoods can alleviate inflationary pressures, the 2023 Economic Well-Being report indicates that moving was not a common coping mechanism for many, with only four percent of renters reported having moved in response to rent increase at a previous home (Board of Governors of Federal Reserve System, 2024).
When viewed holistically, the observed trends underscore a fundamental concern for housing policy: even moderate rent increases can facilitate shifts into financial burden categories and jeopardize renters’ stability, particularly for those already teetering on the edge. As rents continue their upward trajectory, these cumulative pressures pull more households into challenging circumstances, which may widen the stability gap between financially stable and struggling renters.
Rent hikes trigger immediate and sustained spending cutbacks.
When housing costs rise, renters respond swiftly. To capture this immediate and dynamic response, we employed an event study approach, which allowed us to analyze how spending patterns shifted in real-time after the rent increase took effect. By examining changes in durable and nondurable expenditures over the 10-month window around the rent hike (five months before and after), we isolated its direct impact and observed the precise timing and duration of spending adjustments. Our analysis revealed immediate and persistent reductions in spending following a rent increase. The most significant cutbacks emerged several months into the post-increase period, suggesting that the mounting pressure of higher costs may compel increasingly difficult choices about what to forgo over time. For renters living in ZIP codes experiencing above-median rent increases, spending shifts were evident almost immediately. Figure 3 shows that by the second month after a rent increase (t=1), nondurable spending was already 1.4 percent (-0.014 log points) lower than it would have been absent the increase.
Figure 3. Rent-induced budget pressures trigger reductions in non-housing spending, with nondurable expenditures decreasing by up to 2.3 percent in the months following a rent increase.
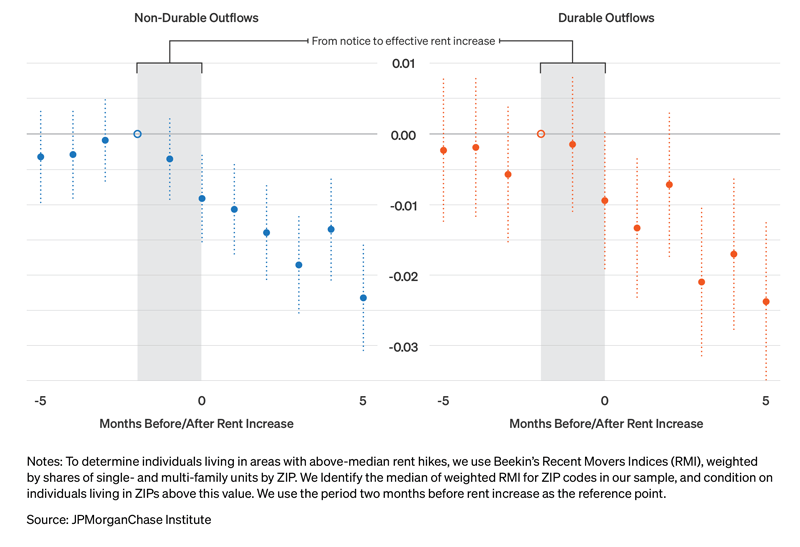
Overall, nondurable spending showed a clear decline, falling between 1.1 and 2.3 percent, depending on the specific period examined.xi By month five, both durable and nondurable spending had fallen more than 2.3 percent relative to baseline levels. These patterns are revealing; they confirm that rent increases trigger an extended period of reduced spending, rather than merely a series of one-time adjustments. The spending declines are not fleeting; the reductions observed in the early months following a rent increase do not reverse in later months. To put these spending decreases into perspective, the average renter in our study spent $1,592 per month on nondurables. Over six months, a 2.3 percent rent-induced cutback accumulates to about $180. For families managing tight budgets our estimated average rent increase could translate into tangible compromises such as altered grocery shopping habits or delayed utility payments (Clifford and Baird, 2025; Wheat and Sullivan, 2024).
Durable spending, which includes items such as furniture or major appliances, exhibited similar patterns, but the trend was less consistent than nondurables. Renters began reducing these purchases almost immediately, by about 1.3 percent (-0.013 log points) in the very first month. The initial reduction was slightly larger than that observed in nondurables at the same time point, likely indicating that renters either postpone non-essential spending on big-ticket items or cancel them altogether. By month five, renters in higher rent growth ZIPs reduced their durable spending by 2.4 percent (-0.024 log points). Despite comparable estimates between the two spending components, baseline durable spending averaged just under $410 monthly, indicating that nondurable spending is a primary adjustment margin with important implications for renters’ financial resilience.
Successive declines in spending, along both dimensions, potentially signifies that the financial trade-offs renters make in response to rent hikes may not be short-lived, but ongoing as they are likely operating at a consistently lower level of discretionary spending. These spending response dynamics paint a consistent picture: when monthly housing costs rise, renters scale back on both the essentials, like groceries, clothing, and transportation, and larger items as well.
Rising rents crowd out non-housing spending, with renters cutting 39 cents from essential consumption for each additional dollar in rent.
Increased rent obligations do more than simply stretch renters’ budgets, they actively displace other spending. The dynamic insights from the event study show the point at which these increases bind on other areas of renter household budgets, inducing spending cutbacks. In this section, we use regression analysis to illustrate how each additional dollar spent on rent payments displaces non-housing expenditures. Subsequently, we derive a set of elasticities across various rent burden segments. These expenditure elasticities serve as a measure of proportional spending sensitivity in response to rising rent obligations.xii Our behavioral analysis specifically focuses on understanding renters’ coping mechanisms when negatively impacted, so we restricted the sample to individuals whose affordability stress either remained constant or worsened, and we disaggregated their spending into durable and nondurable components.
Our analysis revealed a distinct vulnerability gradient. Figure 4 shows that the more burdened renters were prior to rent increase, the larger the proportional cuts they are compelled to make to nondurable, often essential, spending. For instance, renters who were Not Burdened before the rent increase demonstrated the least proportional responsiveness to a rent shock, even as their affordability stress intensified. These households decreased their nondurable spending by about 0.21 percent for every 1 percent reduction in their disposable income due to rent increases. This figure is notably lower than overall renter elasticity of 0.27 percent, suggesting that Not Burdened had greater capacity to absorb rent increases without substantial changes to their non-housing spend. In contrast, renters who were already Burdened before the increase proved to be considerably more responsive. In percentage terms, they exhibited more than twice the elasticity of Not Burdened renters (0.51 compared to 0.21), with their nondurable spend decreasing by about 0.51 percent for every percentage of disposable income lost to higher rent.
Figure 4. For every $1 increase in rent, renter households reduce other spending by 39 cents, with larger percentage cutbacks among the most rent-burdened renters.
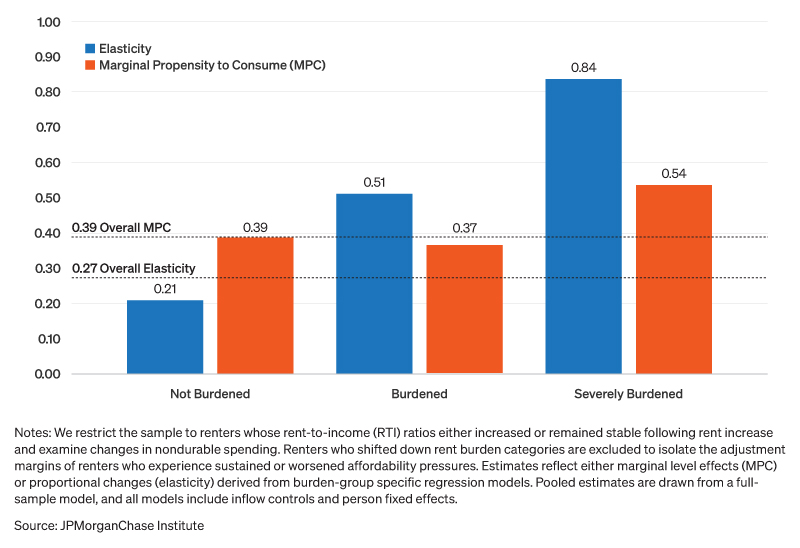
Consistent with our expectations, Severely Burdened renters exhibited the most proportional spending adjustments. Their remarkably high elasticity of 0.84 percent indicates that these households were compelled to sharply curtail essential, daily spending due to their heightened sensitivity to income pressures. This profound degree of responsiveness suggests that for Severely Burdened renters, nondurable consumption serves as the primary margin of adjustment, as they are likely savings-constrained or defer payments whenever possible. Data from Fannie Mae corroborates this interpretation: 53 percent of renters reported debt stress, citing unpaid credit card debt as a primary source of financial stress, while 55 percent indicated a likelihood of reducing utility usage to cope with rising housing costs (Fannie Mae, 2024).
Examining renters’ spending sensitivity in absolute dollar terms (marginal propensity to consume) revealed a similarly shaped, though nuanced, response gradient. On average, every additional $1 increase in rent displaced about 39 cents in nondurable consumption spending. This means that a $100 increase induced renters to cut roughly $39 of nondurable spending in order to meet new housing outlays. Interestingly, both Not Burdened (MPC -0.39) and Burdened (MPC -0.37) renters appeared to adjust their spending baselines at roughly similar rates. While the marginal spend displacement for the Burdened group was economically significant, its estimate being slightly lower than the Not Burdened group (and close to the overall average) was notable. This might suggest that while their proportional response (elasticity) was high, the absolute dollar amount they can cut from nondurables was constrained, likely because their nondurable budget was already lean or predominantly allocated to inelastic essentials, limiting further dollar-value reductions. Finally, the Severely Burdened demonstrated the greatest propensity to displace non-housing consumption in dollar terms. Every dollar increase in rent induced these renter households to cut nondurables by a substantial 54 cents (MPC -0.54).
To ground these sensitivity measures, consider a hypothetical case where Severely Burdened renters experienced the annualized rent increase of $1,032. Our MPC estimate suggests these renters would decrease their annual non-housing consumption by $557, whereas Burdened renters for the same rent increase would reduce their non-housing outlays by roughly $402. These represent substantial spending responses that underscore the pronounced sensitivity of renters’ spending to fluctuations in housing costs and illustrate a clear “crowding out” effect, as higher rents effectively siphon income that would otherwise flow into nondurable spending.
These consumption “crowding out” effects resonate with the broader economics literature, where similar MPCs are seen following economic shocks Sokolova (2023). Bunn et al. (2018) estimate even larger MPCs (0.46–0.68) after unexpected income losses. Our MPC findings demonstrate that rising fixed costs, such as rent, can have comparable consequences, particularly for renters with limited liquidity. Our estimates highlights pronounced sensitivity among renters facing rent increases; much like individuals confronting income losses, they are likely liquidity-constrained and forced to adjust their consumption spending immediately.
One of the clearest takeaways from our findings to this point is that heterogeneity matters. Some renters feel the impact in dollar terms, cutting back across multiple categories to rebalance their budgets, while others experience it as deeper fragility, where even small new costs create disproportionate strain, because they have little left to cut. This multidimensional vulnerability means some households have room to maneuver, while others confront rigid financial constraints. Beyond individual hardship, these patterns carry broader economic consequences for communities, widespread reductions in consumption, particularly on nondurable goods, can ripple through local economies and weaken overall local resilience.
For renters already managing tight budgets, added housing costs translate into a meaningful loss of disposable income. Our findings show that the financial effects are both immediate and durable, as rent shocks rapidly ripple through household budgets. These increases lead to higher rent-to-income ratios, push more renters into financially strained categories, and trigger immediate spending cutbacks. Quantifiably, every additional dollar in rent compels renters to reduce non-housing consumption. In percentage terms, a 1 percent rent increase leads to a 0.27 percent decline in overall spending. These responses mirror those observed following income shocks, suggesting that rent hikes function, in economic terms, like a forced pay cut for millions of renters.
Deteriorating housing affordability stems from a confluence of factors. While insufficient affordable rental units and chronic undersupply are frequently cited, other elements warrant attention. The J.P. Morgan outlook for 2025 anticipates that interest rates will remain elevated. This forecast means increased demand for rental housing, as prospective buyers who might otherwise have purchased homes are forced to remain in or enter the rental market. Consequently, millions of renters are increasingly locked into longer renterships, slowing their transition to homeownership and intensifying competition for the existing stock of affordable rental units.
While tenant affordability is an important dimension, rent inflation also involves complex landlords’ operations. Eight out of ten landlords surveyed by Baselane cited rising property taxes, maintenance, utilities, and insurance premiums as primary drivers of growing ownership costs (Dar, 2025). This challenging economic outlook means landlords seeking to refinance or finance property renovations will continue to face a high-cost environment, which directly influences rent-setting decisions. This “new normal” of strong rent growth poses ongoing affordability challenges and highlights the need for proactive solutions to prevent long-term financial stress and preserve community resilience. Navigating rent inflation requires a nuanced understanding that balances renter financial well-being with broader macroeconomic realities.
The recent influx of new rental units drove vacancy rates to a record 7.1 percent in Q1 2025 (U.S. Census, 2025), largely due to approximately 591,000 new multifamily completions in 2024, the highest annual figure since the 1980s (Freddie Mac, 2025). Despite this record addition to supply pipeline, the national median asking rent still registered a 1.2 percent month-over-month increase in April 2025 (Redfin, 2025). This mixed pattern suggests that, while sufficiently large supply increases can help moderate rent inflation in local markets, the current rate of new supply delivery has not yet fully offset upward rent pressures nationally, especially given robust underlying demand.
Rent inflation has tangible, everyday repercussions for over 21 million rent burdened renter households. Our report reveals that an average annual $1,032 rent increase does more than just add to financial burdens, it reverberates across many aspects of renters’ economic well-being. While recent rent growth has slowed, rents have stabilized at significantly elevated levels compared to pre-pandemic norms, creating persistent affordability challenges. The high propensity for spending displacement, particularly for Severely Burdened renters (who cut $0.54 from nondurables for every $1 in rent increase), suggests that measures aimed at alleviating rent stress such as targeted rental assistance could be effective. For these renters, a substantial portion of rental assistance would likely be reallocated to non-housing consumption, thereby supporting both renters’ stability and local economies as these funds flow directly into goods and services.
The interconnected economic pressures on renters and landlords, set against the backdrop of strained state budgets, warrants further examinations. This deeper understanding is essential to move beyond fragmented policies toward a comprehensive framework that balances tenant stability and landlord dynamics. Effective solutions will likely involve expanding targeted rental assistance in conjunction with pro-stability policies that incentivize the development of diverse housing types across various affordability levels. Our findings indicate that rental economic conditions are, in part, exacerbated by broad based deteriorating affordability, underscoring the ongoing need for adaptive approaches to ensure housing remains affordable and accessible for all.
We combine two primary data sources to examine how local rent shocks affect household spending. First, we utilize anonymized transactions from Chase deposit accounts to identify renters through recurring transactions to landlords or property managers. For each identified renter, we record monthly spending on rent, groceries, durables, and other household spending related categories. We observe rent changes—both increases and decreases—as they occur, but for this analysis we restrict the sample to renters with rent increases of at least 1 percent, where payments remain stable within a ±0.5 percent buffer before and after the change to ensure the increase reflects a lease adjustment rather than noise or a one-off variation. Our research sample consists of a balanced panel of 85,297 same-ZIP individuals with observed rent increases between August 2021 and July 2023 and non-missing transactions data during the 10-month event study window (spanning five months before and five months after the rent increase).
Because we do not directly observe lease terms, we cannot distinguish between new leases for renters moving to a new home and renewed leases for renters staying in the same property. To reduce potential confounding from cross-neighborhood moves—which often involve life changes or income shocks—we restrict the sample to renters who remain in the same ZIP code following their rent increase. Restricting to renters who do not change ZIP codes eliminates some, but not all, rent changes associated with a move. This design choice limits the influence of large relocations and ensures renters are exposed to the same localized rent dynamics. Among same-ZIP renters, a rent increase could result from a lease renewal or a move within the ZIP. In both cases, the household is subject to the same local market conditions or “spot” pricing captured by our ZIP-level rent index.
We obtain ZIP-level rent growth from a proprietary rent analytics platform covering over 14 million rental units across 18,000 ZIP codes.13 These data offer repeat-rent indices that reflect average rent changes over time for the relevant market segment. We use these measures to construct a ZIP-level index of rent inflation, weighted by property type using 2022 American Community Survey (ACS) data.14 This allows us to align each renter with the dominant price dynamics in their local rental market. We merge the ZIP-level rent index to individual-level bank data using ZIP code and month of rent change. All rent, spending, and income data are aggregated to the individual-month level. We adjust nominal inflows and outflows to real dollars using the Personal Consumption Expenditures (PCE) price index, to account for broader inflation trends during the study period.
Finally, we merge the weighted indices by ZIP to account-level outflows data, aggregated at the individual-month level and adjust nominal inflows and outflows to real terms using the Personal Consumption Expenditures (PCE) price index.15
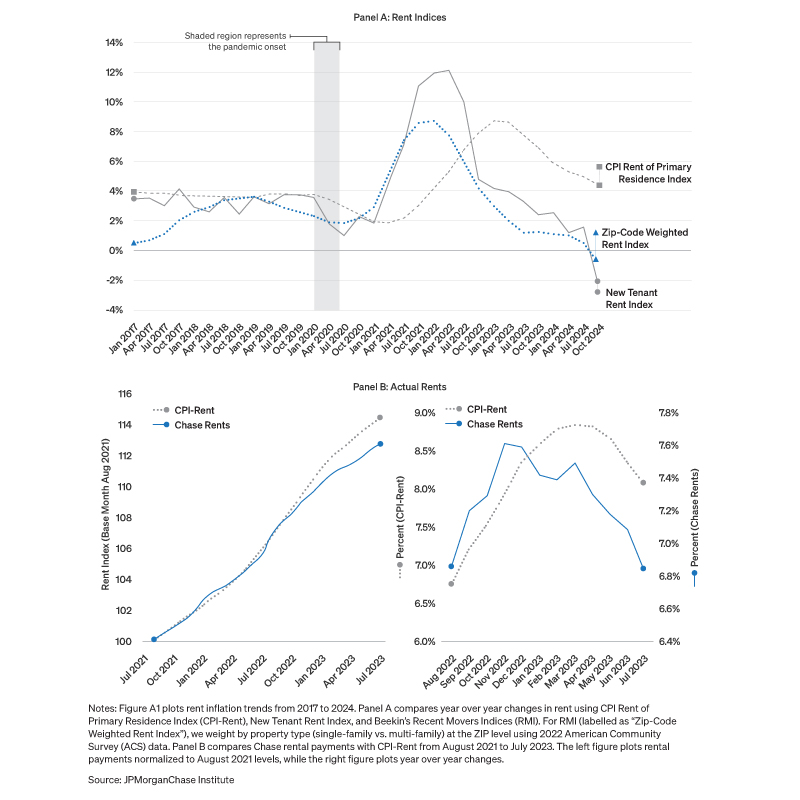
Rent inflation has played a defining role in the post-pandemic economy—shaping the national inflation story and straining household budgets. While inflation overall peaked at 9.1 percent year-over-year, housing costs—particularly rent—have been among the most persistent drivers, with rent inflation itself cresting near 8.7 percent in early 2023. To understand how these pressures evolved, we examine three key rent indices. CPI Rent of Primary Residence Index (CPI-Rent), the official benchmark of average rent paid across new and continuing leases. However, CPI-Rent lacks the real-time sensitivity needed to capture pricing nuances or recent changes that affect new or renewing tenants differently. For recency, we leveraged the New Tenant Rent Index (NTR), which isolates rent prices for new leases and better reflects recent market shifts (Adams et al. 2022).
While these nationwide measures shed light on broad rent inflation trends, they provide limited insight into the rent environment that an individual renter navigates. Consequently, we leveraged proprietary data from a rental analytics platform, capturing ZIP-level “spot” price dynamics across single and multifamily rental units.16 Together, these series paint a picture of a market that surged quickly, then gradually cooled—but not before rent pressures filtered across nearly every segment of the renter population.
Figure A1 Panel A shows that NTR surged ahead of CPI-Rent, peaking in Q2-2022 at over 12 percent year-over-year growth, while CPI-Rent climbed more slowly and peaked later at 8.7 percent in Q1-2023. This gap reflects the way new leases act as early signals of broader rent inflation. As existing leases gradually rolled over at higher rates, CPI-Rent followed—lagging behind real-time pricing but eventually reflecting the new norm. That the NTR moves first and more dramatically underscores the value of new-lease rents as an early indicator of housing market pressures. Households forced to buy into leases at these spot rates feel the brunt of rent hikes before official inflation measures reflect the shift (Adams et al., 2022).
Our bank transactions data—which capture actual rent payments for a large sample of renters—show a similar trajectory. Though starting later, the Chase rent series peaks at 7.6 percent in Q4-2022 and broadly tracks the slope and timing of the official metrics (Figure A1 Panel B). That alignment signals that our renter panel is experiencing the same rent dynamics seen in national indices and is therefore a credible source for exploring how rent inflation reshapes household spending.
Importantly, this macro-level context provides a backdrop for understanding the consequences of rising rents. Survey data from the Urban Institute and the Consumer Financial Protection Bureau reveal how renters have responded to these increases: cutting spending, saving less, and falling behind on payments. In 2023, 30% of renters reported struggling to pay rent at least once in the prior year (Consumer Financial Protection Bureau, 2025). Meanwhile, over 75% reported cutting back in other areas to keep up with housing costs (Choi, Burton, and Reynolds 2024). These pressures are not just inflationary symptoms; they are lived financial trade-offs. In a market where even a modest rent increase can reduce what families can afford to spend elsewhere, persistent rent inflation becomes a mechanism for household vulnerability—tightening budgets and reducing resilience.
Figure A1: Rent Inflation Trends
This report reflects the collaborative effort of many partners, and we are grateful to those whose dedication and care made this project possible. We extend special thanks to our research support staff, Theo Grayer and Anthony Francisco, for their contributions that brought clarity and depth to the research. We are indebted to the talented team members, Elizabeth Ellis, Julia Decerega, Oscar Cruz, Katie Faryniarz, and Bryan Kim, who ensure JPMorganChase Institute’s insights reach our diverse stakeholders.
We thank colleagues, Michael Neal of the Urban Institute and Abigail Suarez of the JPMorganChase PolicyCenter for their expertise, generous feedback, challenges, and encouragement along the way. Finally, we acknowledge Jamie Dimon, CEO of JPMorgan Chase & Co., for his vision and leadership in establishing the Institute and enabling the ongoing research agenda. We remain deeply grateful to Tim Berry, Head of Corporate Responsibility, Heather Higginbottom, Head of Research, Policy & Insights, and others across the firm. This work stands on the collaborative shoulders of many, we thank all for the resources and support to pioneer a new approach to contribute to global economic analysis and insight.
Adams, Brian, Lara Loewenstein, Hugh Montag, and Randal Verbrugge. 2024. Disentangling rent index differences: data, methods, and scope. American Economic Review: Insights 6, no. 2 (2024): 230-245.
Board of Governors of the Federal Reserve System. 2024. Survey of Household Economics and Decisionmaking (SHED) 2024. Washington, DC: Board of Governors of the Federal Reserve System.
Bunn, P., J. Le Roux, K. Reinold, and P. Surico. 2018. The consumption response to positive and negative income shocks. Journal of Monetary Economics 96: pp. 1-15.
Choi, Jung Hyun, Elizabeth Burton, and Kathryn Reynolds. 2024. High Rents Are Posing Financial Challenges for Renters at All Income Levels. Urban Wire, May 1, 2024. Urban Institute.
Clifford, Lauren. 2025. 88% Say They’ve Changed Grocery Shopping Habits Due to Inflation — Here’s How. Edited by Jessica Sain-Baird. Lending Tree Blog. Accessed June 3, 2025. https://www.lendingtree.com/debt-consolidation/grocery-shopping-habits-survey/.
Colburn, Gregg , Christian Hess, Ryan Alen & Kyle Crowder. 2024. The dynamics of housing cost burden among renters in the United States, Journal of Urban Affairs, DOI, 09 Jan 2024: 10.1080/07352166.2023.2288587
Dar, Saad. 2025. 2025 U.S. Rental Market Trends & Conditions: The State of Rental Property Management. Baselane Blog. Accessed May 21, 2025. https://www.baselane.com/resources/rental-market-trends.
Desmond, Matthew. 2020. The Rent Eats First, Even During a Pandemic. New York Times, August 29, 2020. https://www.nytimes.com/2020/08/29/opinion/sunday/coronavirus-evictions-superspreader.html.
Freddie Mac Multifamily, Multifamily Research Center. 2025. 2025 Multifamily Outlook. McLean, VA: Freddie Mac.
Joint Center for Housing Studies of Harvard University. The State of the Nation’s Housing 2024. Cambridge, MA: Harvard University, December 2024.
Joint Center for Housing Studies of Harvard University. Deteriorating Rental Affordability: An Update on America’s Rental Housing 2024. By Whitney Airgood-Obrycki, Alexander Hermann, and Sophia Wedeen. Cambridge, MA: Harvard University, December 2024.
Katz, Lily. "U.S. Asking Rents Fell 1% Year Over Year in April—Biggest Drop in 14 Months." Redfin Blog, May 12, 2025. https://www.redfin.com/news/rental-tracker-april-2025/.
Krueger, Dirk, Egor Malkov, and Fabrizio Perri. 2023. “How do Households Respond to Income Shocks?” Working Paper 31894, National Bureau of Economic Research, Cambridge, MA, November.
McAdam, Peter. "Comparing measures of rental prices can inform monetary policy." Economic Bulletin 2023 (2023): 1-4.
Shomon Shamsuddin and Colin Campbell (2021): Housing Cost Burden, Material Hardship, and Well-Being, Housing Policy Debate, DOI: 10.1080/10511482.2021.1882532
Sokolova, Anna. "Marginal propensity to consume and unemployment: A meta-analysis." Review of Economic Dynamics 51 (2023): 813-846.
U.S. Census Bureau. "Nearly Half of Renter Households Are Cost-Burdened, Proportions Differ by Race." Press Release Number: CB24-150, September 12, 2024.
U.S. Census Bureau. "Quarterly Residential Vacancies and Homeownership, First Quarter 2025." Press Release Number: CB25-58, April, 28, 2025.
Witzen, B. Heath. "An Introduction to the CFPB’s Rental Payment Data and Analysis." Consumer Financial Protection Bureau Office of Research Reports Series 25-4 (2025).
Wheat, Chris. Daniel M. Sullivan, Alexandra Lefevre, Abigail Ostriker. 2024. “Feeling the Heat: How Households Manage High Air Conditioning Bills.” JPMorganChase Institute. https://www.jpmorganchase.com/institute/all-topics/financial-health-wealth-creation/how-households-manage-high-air-conditioning-bills.
Zimmerman, Rachel, and Lauren Hoffman. Increasingly Debt-Strapped Consumers Concerned About Rising Housing-Related Costs. Research Publication. Washington, DC: Fannie Mae, July 24, 2024.
This material is a product of JPMorganChase Institute and is provided to you solely for general information purposes. Unless otherwise specifically stated, any views or opinions expressed herein are solely those of the authors listed and may differ from the views and opinions expressed by J.P. Morgan Securities LLC (JPMS) Research Department or other departments or divisions of JPMorgan Chase & Co. or its affiliates. This material is not a product of the Research Department of JPMS. Information has been obtained from sources believed to be reliable, but JPMorgan Chase & Co. or its affiliates and/or subsidiaries (collectively J.P. Morgan) do not warrant its completeness or accuracy. Opinions and estimates constitute our judgment as of the date of this material and are subject to change without notice. No representation or warranty should be made with regard to any computations, graphs, tables, diagrams or commentary in this material, which is provided for illustration/reference purposes only. The data relied on for this report are based on past transactions and may not be indicative of future results. J.P. Morgan assumes no duty to update any information in this material in the event that such information changes. The opinion herein should not be construed as an individual recommendation for any particular client and is not intended as advice or recommendations of particular securities, financial instruments, or strategies for a particular client. This material does not constitute a solicitation or offer in any jurisdiction where such a solicitation is unlawful.
Footnotes
Relative importance of components in the Consumer Price Indexes: U.S. city average, December 2024, https://www.bls.gov/cpi/tables/relative-importance/2024.htm. It is worth noting that the relative importance of shelter rose from 32.9% in 2021 to 35.5% in 2024.
https://investors.redfin.com/news-events/press-releases/detail/1296/redfin-report-americas-renter-population-grew-1-in-the; https://www.census.gov/newsroom/press-releases/2024/renter-households-cost-burdened-race.html
See Technical Appendix for benchmarking details.
U.S. Bureau of Labor Statistics, Consumer Price Index for All Urban Consumers: Rent of Primary Residence in U.S. City Average [CUUR0000SEHA], retrieved from FRED, Federal Reserve Bank of St. Louis. https://fred.stlouisfed.org/series/CUUR0000SEHA, June 2, 2025.
Zillow Rental Market Report, March 2025. https://www.zillow.com/research/march-2025-rent-report-35084/
Federal Reserve Bank of Atlanta, Wage Growth Tracker. http://atlantafed.org/chcs/wage-growth-tracker
Federal policy for rental housing assistance leverages these concepts of affordability to inform need-based rental assistance appropriations and pro-affordable development incentives. For instance, the Department of Housing and Urban Development’s housing voucher program, generally requires local public housing authorities (PHAs) to cover the difference between the standard 30 percent of a household’s adjusted gross income and the prevailing fair market rent (see GAO’s 2020 Rental Housing report, https://www.gao.gov/assets/710/707269.pdf ). The “30 percent rule” is a standard threshold level of housing cost burden and is rooted in the Brooke Amendment to the 1968 Housing and Community Development Act. Any household spending beyond this threshold is generally considered cost burdened (See HUD’s 2017 Rent Burden in the Housing Choice Voucher Program report, https://www.huduser.gov/portal/sites/default/files/pdf/rent-burden-hcv.pdf)
U.S. Census Bureau. “Nearly Half of Renter Households Are Cost-Burdened, Proportions Differ by Race.” News Release, September 12, 2024. https://www.census.gov/newsroom/press-releases/2024/renter-households-cost-burdened-race.html
To assess changes in rent burden following a rent increase, this analysis calculates burden by comparing summed rent payments to summed monthly inflows within the 3-month intervals directly preceding and following the month of rent increase for each individual. Our approach temporally aligns rent and potential income changes, and thus capturing dynamic changes in each series. However, this approach may be sensitive to instances of non-recurrent income spikes that may not accurately reflect sustained increases in an individual’s steady state earnings capacity. As such, we interpret instances where households improve their burden status with caution.
To address any concerns that our estimates might be sensitive to construction, we inspected density plots at the person-level and confirmed that the joint distribution of burden category changes and post-increase burden showed considerable density above the category change thresholds. Burden increases were more pronounced for initially more vulnerable groups (e.g. Burdened or Severely Burdened), indicating both expanding affordability difficulties alongside deepening burden for those already experiencing housing burden strain. Zooming into the burden distribution demonstrates that many of the threshold transitions we highlight in the discussion involved economically meaningful deterioration in affordability, not driven by marginal nudges over a particular burden category due to pre-existing inframarginal proximity to the set cutoffs.
For oour event study regressions, we estimate the following specification: Outflowsit= β⋅EventTimet+Inflowsit+δi+γy+εit. Where Outflowsit represents the log of durable or nondurable outflows for individual i in event time t. We add 1 to each observation before doing a natural log transformation. β is our coefficient of interest and shows the change in Outflowsit relative to the omitted event time period, t=-2. Inflowsit controls for individual i's net inflows (minus transfers) in event time t. We further control for individual (δi) and year (γy) fixed effects and cluster standard errors at the individual level.
To compute our MPC and elasticity measures, we analyze the sum of rent payments and nondurable outflows 3 months before and after a rent increase for each individual. For MPCs, we regress nondurable outflows on rental payments before and after rent increase, while controlling for changes in total inflows and individual fixed effects. For elasticities, we perform similar calculations using logged values instead of levels.
Beekin’s Recent Movers Indices measures average change over time in the rental prices for new leases, available for multi-family (MF) apartments or single-family rental (SF) homes, at a state or MSA level. Recent Movers Indices is built on a database of more than 14 million rental properties and other public datasets, covering all contiguous US States and over 18,000 zip codes, 100 MSAs for MF and 70 MSAs for SF. https://beekin.co/resources/insights/recent-mover-indices-powered-by-big-data-and-ai/
We obtain shares of single and multi-family occupied rental properties in 2022 by ZIP code from Table S2504: Physical Housing Characteristics for Occupied Housing Units.
To adjust to real terms, we use monthly U.S. Bureau of Economic Analysis, Personal Consumption Price Index indexed to 2017. https://www.bea.gov/news/2025/personal-income-and-outlays-january-2025
Beekin is a decision intelligence platform designed for institutional investors and lenders in the rental housing sector. https://beekin.co/resources/company-news/real-estate-analytics-platform-beekin-to-launch-ai-rental-retention-tool-wilson-at-naa-apartmentalize-conference/
Authors

Chris Wheat
President, JPMorganChase Institute

Makada Henry-Nickie
Housing Finance Research Director, JPMorganChase Institute

Pascal Noel
Neubauer Family Assistant Professor of Finance at the University of Chicago Booth School of Business

Scott Kim
Former Housing Finance Research Associate