
Figure 1.
Latest news

An Ohio-based company is protecting first responders around the world
With support from JPMorganChase, Fire-Dex is providing protective equipment to firefighters in 100 countries and all 50 states.
Learn moreLatest news

Veteran’s Unconventional Path to Landing her Dream Job in Tech
U.S. Army Veteran Ashley Wigfall transitioned to a civilian role and charted her path to technologist through mentorship and skills training at the JPMorgan Chase tech hub in Plano, Texas.
Learn more
Research
October 29, 2025
Amid a softening in the labor market and reduced dynamism, this report measures income growth at the individual level and examines disparate outcomes across age groups.
We find:
Weakening labor market dynamism weighs especially on young workers, who rely to a greater extent on job switching to climb the career ladder.1 Monetary policymakers have noted outcomes for this group, in part because they tend to be more sensitive to the overall state of the economy.2 Slower wage gains add to challenges facing younger generations: their greater exposure to the decline in housing affordability and relatively late entry into a rising stock market make it harder for them to achieve financial goals.
The labor market has softened. The official unemployment rate has risen about a percentage point from its low in 2023, and the pace of jobs growth has fallen. Indicators of labor market dynamism—captured via gross hiring or quits rates—have fallen to levels not seen in a decade, outside of the pandemic disruption.3 Amid uncertainty, measures of the intensive margin of the labor market—how incomes are changing—provide a complementary perspective to headline payroll gains, helping assess balance in the labor market.
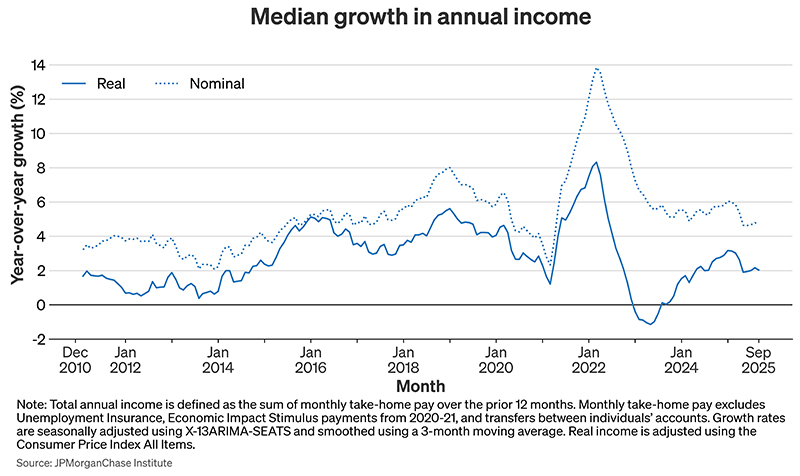
In this Brief, we measure median year-over-year income growth in a population-representative sample of deidentified data over December 2010 through September 2025.4 The income measure is take-home pay, comprising inflows into checking accounts, excluding transactions such as Unemployment Insurance, Economic Impact Stimulus payments from 2020–21, and transfers between individuals’ accounts. We report the median of year-over-year changes in trailing 12-months’ worth of income, following a method similar to those based on public microdata.5
We find median income growth in September 2025 dipped to about 2 percent in real terms for prime-aged individuals, while nominal income growth remained just under 5 percent. Real income growth among individuals aged 25–29 has also fallen compared to other groups, implying less growth for people early in their careers. These dynamics show a downgrade in purchasing power growth for all individuals and a meaningful loss of momentum in early-career earnings advancement.
As of September, median income growth for prime-age individuals—those between 25–54 years old—was just under 5 percent, or 2 percent in real terms, adjusting for changes in the Consumer Price Index All Items.6 Figure 1 shows that in terms of real purchasing power, the recent level is near the slowest pace of growth seen in a decade, outside of the pandemic and subsequent inflation. The last period of sustained growth below the current reading was in the early 2010s, when the unemployment rate was still elevated from the Great Recession. Importantly, nominal growth remains roughly consistent with pre-pandemic levels, but real purchasing power gains are at a relatively low level because of the higher pace of consumer price increases.
Figure 1.
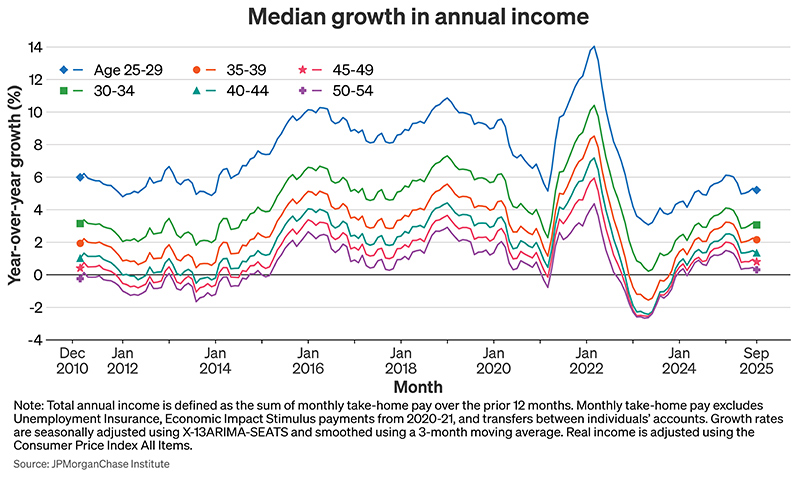
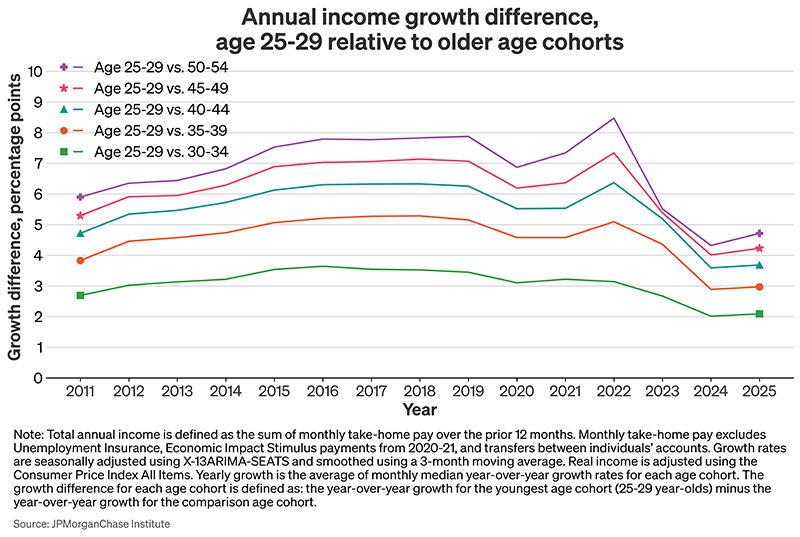
The slowdown in real growth has been most pronounced for younger individuals. Early in most individuals’ working lives, people tend to have lower levels of income but relatively high growth.7 However, income advancement for this group—those aged 25–29 in our sample—has slowed down by more than older individuals over the past few years. The two panels of Figure 2 show income growth by age groups and a breakout showing differentials at points in time. Growth for the 25–29-year-old group is now just 4 percentage points higher than a typical mid-career individual in their 40s. This difference represents a shift down from the 6–7 percent level prior to the pandemic, a range that largely persisted through 2022. Looking back further, the recent reading suggests a smaller youth-advantage than in the early 2010s, when the labor market was still recovering from the Great Recession.
Figure 2.
Outcomes currently facing the younger population carry implications beyond concern for this potentially vulnerable group: they can provide a signal for the state of the overall labor market. Academic and policy work focusing on the unemployment rate of different demographic groups have found that young people often exhibit excess sensitivity to the overall state of the labor market (Aaronson, et al. 2019). Consistent with these findings, the relative slowdown in growth for the younger segment in the population is a potential function of the slowdown in broader labor market dynamism—seen in lower gross hirings and quit rates.8
Breaking out income gains into a nominal and real component and by age group reveals basic facts that help dimension the broad slowdown in the labor market. First, persistently high increases in consumer prices have been a real headwind to purchasing power in recent years. Inflation hasn’t yet fallen to the Fed’s two percent objective, meaning that the solid recent rate of nominal income gains corresponds to nearly the weakest gains in real purchasing power seen over the past decade. Second, the recent slowdown in median income gains has been led by the young. While private sector layoffs remain low, the labor market is producing fewer new job matches. This can disproportionately affect younger people that rely on a dynamic labor market to climb the career ladder, explaining their slower pace of gains relative to historical trends.9
The decline in income gains comes at a challenging time for younger generations. People in their twenties and early thirties are less likely to own homes than older individuals, meaning the rise in housing costs since 2022 has hit this group particularly hard.10 And while they are getting an earlier start to investing, they haven’t benefited as much from the past decade of strong returns.11 Without stronger income gains, they may need to wait even longer for their budgets to catch up to their financial goals.
Aaronson, Stephanie R., Mary C. Daly, William L. Wascher, and David W. Wilcox. 2019. "Okun Revisited: Who Benefits Most from a Strong Economy?" Brookings Papers on Economic Activity 50, no. 1 (Spring 2019): 333–404. https://www.brookings.edu/wp-content/uploads/2019/03/Aaronson_web.pdf
Bosler, Canyon and Petrosky-Nadeau. 2016. “Job-to-Job Transitions in an Evolving Labor Market.” Federal Reserve Bank of San Francisco Economic Letter. https://www.frbsf.org/research-and-insights/publications/economic-letter/2016/11/job-to-job-transitions-in-evolving-labor-market/
Guvenen, Fatih, Fatih Karahan, Serdar Ozkan, and Jae Song. 2015, revised 2019. “What Do Data on Millions of U.S. Workers Reveal about Life-Cycle Earnings Dynamics?” Federal Reserve Bank of New York Staff Reports, no.710. https://www.newyorkfed.org/medialibrary/media/research/staff_reports/sr710.pdf
Mincer, Jacob. 1974. Schooling, Experience and Earnings. Columbia University Press.
Topel, Robert H. and Michael P. Ward. 1992. “Job Mobility and the Careers of Young Men.” Quarterly Journal of Economics.
Wheat, Chris, and George Eckerd. 2024. “Climbing up (or off) the career ladder: Lifecycle income progression by age.” JPMorganChase Institute. https://www.jpmorganchase.com/institute/all-topics/financial-health-wealth-creation/climbing-up-or-off-the-career-ladder-lifecycle-income-progression-by-age
Wheat, Chris, and George Eckerd. 2025. “Sizing up real income gains December 2019 to March 2025.” JPMorganChase Institute. https://www.jpmorganchase.com/institute/all-topics/financial-health-wealth-creation/sizing-up-real-income-gains-december-2019-to-march-2025
Wheat, Chris, Makada Henry-Nickie, Pascal Noel, and Scott Kim. 2025. “When the rent comes due: Impact of inflation on renters' financial security.” JPMorganChase Institute. https://www.jpmorganchase.com/institute/all-topics/community-development/inflation-impact-on-renters
We thank our research team, especially Francesca Guiso, for her contributions to the analysis. We are indebted to our internal partners and colleagues, who support delivery of our agenda in a myriad of ways and acknowledge their contributions to each and all releases.
This material is a product of JPMorganChase Institute and is provided to you solely for general information purposes. Unless otherwise specifically stated, any views or opinions expressed herein are solely those of the authors listed and may differ from the views and opinions expressed by J.P. Morgan Securities LLC (JPMS) Research Department or other departments or divisions of JPMorgan Chase & Co. or its affiliates. This material is not a product of the Research Department of JPMS. Information has been obtained from sources believed to be reliable, but JPMorgan Chase & Co. or its affiliates and/or subsidiaries (collectively J.P. Morgan) do not warrant its completeness or accuracy. Opinions and estimates constitute our judgment as of the date of this material and are subject to change without notice. No representation or warranty should be made with regard to any computations, graphs, tables, diagrams or commentary in this material, which is provided for illustration/reference purposes only. The data relied on for this report are based on past transactions and may not be indicative of future results. J.P. Morgan assumes no duty to update any information in this material in the event that such information changes. The opinion herein should not be construed as an individual recommendation for any particular client and is not intended as advice or recommendations of particular securities, financial instruments, or strategies for a particular client. This material does not constitute a solicitation or offer in any jurisdiction where such a solicitation is unlawful.
Wheat, Chris, and George Eckerd. 2025. “Real income growth shifts down, especially for the young.” JPMorganChase Institute. https://www.jpmorganchase.com/institute/all-topics/financial-health-wealth-creation/real-income-growth-shifts-down-especially-for-the-young
Footnotes
Job switching is much more common among people in their twenties relative to later working years and matters more for their income growth, according to academic and policy research (Bosler and Petrosky-Nadeau, 2016; Topel and Ward, 1992).
The September FOMC meeting minutes show policymakers taking note of the recent rise in the unemployment rate for younger individuals as a potential warning signal for the state of the labor market.
https://www.federalreserve.gov/monetarypolicy/fomcminutes20250917.htm
We use a representative subsample of 20 million individuals based on age and geographical location for this analysis.
See, for example, the Atlanta Fed Wage Growth Tracker. The 12-month rolling window helps reduce noise, such as that generated from lumpy income in the form of annual bonuses or tax refunds.
To align with the income measure, the price adjustment for September 2025 is the percent change in CPI from October 2024 to September 2025 relative to October 2023 to September 2024.
This finding goes back to canonical papers like Mincer (1974) and newer papers using large-scale longitudinal data like Guvenen et al. (2019). See also Wheat and Eckerd (2025).
People early in their careers often use job-to-job transitions to find new opportunities for growth, including better alignment between their abilities and the skills required by different jobs. The slowdown in “churn” in the labor market therefore may disproportionately affect the career prospects of younger individuals.
Job switching is an especially important factor early in individuals’ careers. See Bosler, Canyon and Petrosky-Nadeau 2016 and Topel and Ward, 1992.
The homeownership rate among those under 35 years old was 39.0 percent in 2022, compared with 62.2 and 70.5 for the 35–44 and 45–54 age groups, according to analysis of Census data. Glaeser and Gyourko (2025) cover the rise in home prices and the role of housing supply. Wheat and Eckerd (2025) cover the impact of rising home prices and mortgage interest rates and the budgetary impact on individuals aged 25–44. Wheat et al. (2025) cover the impact of rising rents on non-housing spending.
Wheat and Eckerd (2025) find that the share of 25-year-olds making investments as of 2024 had risen six-times the decade-ago level.
Authors

Chris Wheat
President, JPMorganChase Institute

George Eckerd
Wealth and Markets Research Director, JPMorganChase Institute
Media Contact
Shelby Wagenseller
Shelby.Wagenseller@jpmchase.com