
Figure 1: Median incomes were roughly flat from year-ago levels across income groups after adjusting for inflation.
Latest news

An Ohio-based company is protecting first responders around the world
With support from JPMorganChase, Fire-Dex is providing protective equipment to firefighters in 100 countries and all 50 states.
Learn moreLatest news

Veteran’s Unconventional Path to Landing her Dream Job in Tech
U.S. Army Veteran Ashley Wigfall transitioned to a civilian role and charted her path to technologist through mentorship and skills training at the JPMorgan Chase tech hub in Plano, Texas.
Learn more
Research
May 22, 2025
The labor market has remained solid in recent months, but it may be hard to see that strength in your paycheck. The JPMorganChase Institute's Purchasing Power series tracks how real take-home income has changed since December 2019, offering a more grounded view of household financial health than headline indicators alone. This latest update, through March 2025, reinforces a key pattern we observed last fall: overall income growth remains modest, and lower-income workers have seen their relative gains stall.
This edition provides a sharper look at why income changes from 2019 to 2025 may feel underwhelming. Tracking median individual income, accounting for inflation and expected career-stage progress, growth has lagged per-person Gross Domestic Product (GDP) and pre-pandemic trends. And although the labor market has remained strong—with low unemployment and consistent job gains—workers take home a smaller share of total economic output than they did before the pandemic. These measures can be used by policymakers to gauge how changes in labor market conditions over time correspond to overall income growth and shifts across the income distribution.
Real income dynamics shown here can be interpreted with an eye on increasing downside risks. In the past few months, near-term inflation expectations and economic uncertainty have risen, and consumer sentiment has fallen sharply.1 Understanding pre-existing trends at this time may help policymakers assess underlying resilience or fragility of households to future economic outcomes.
Key findings
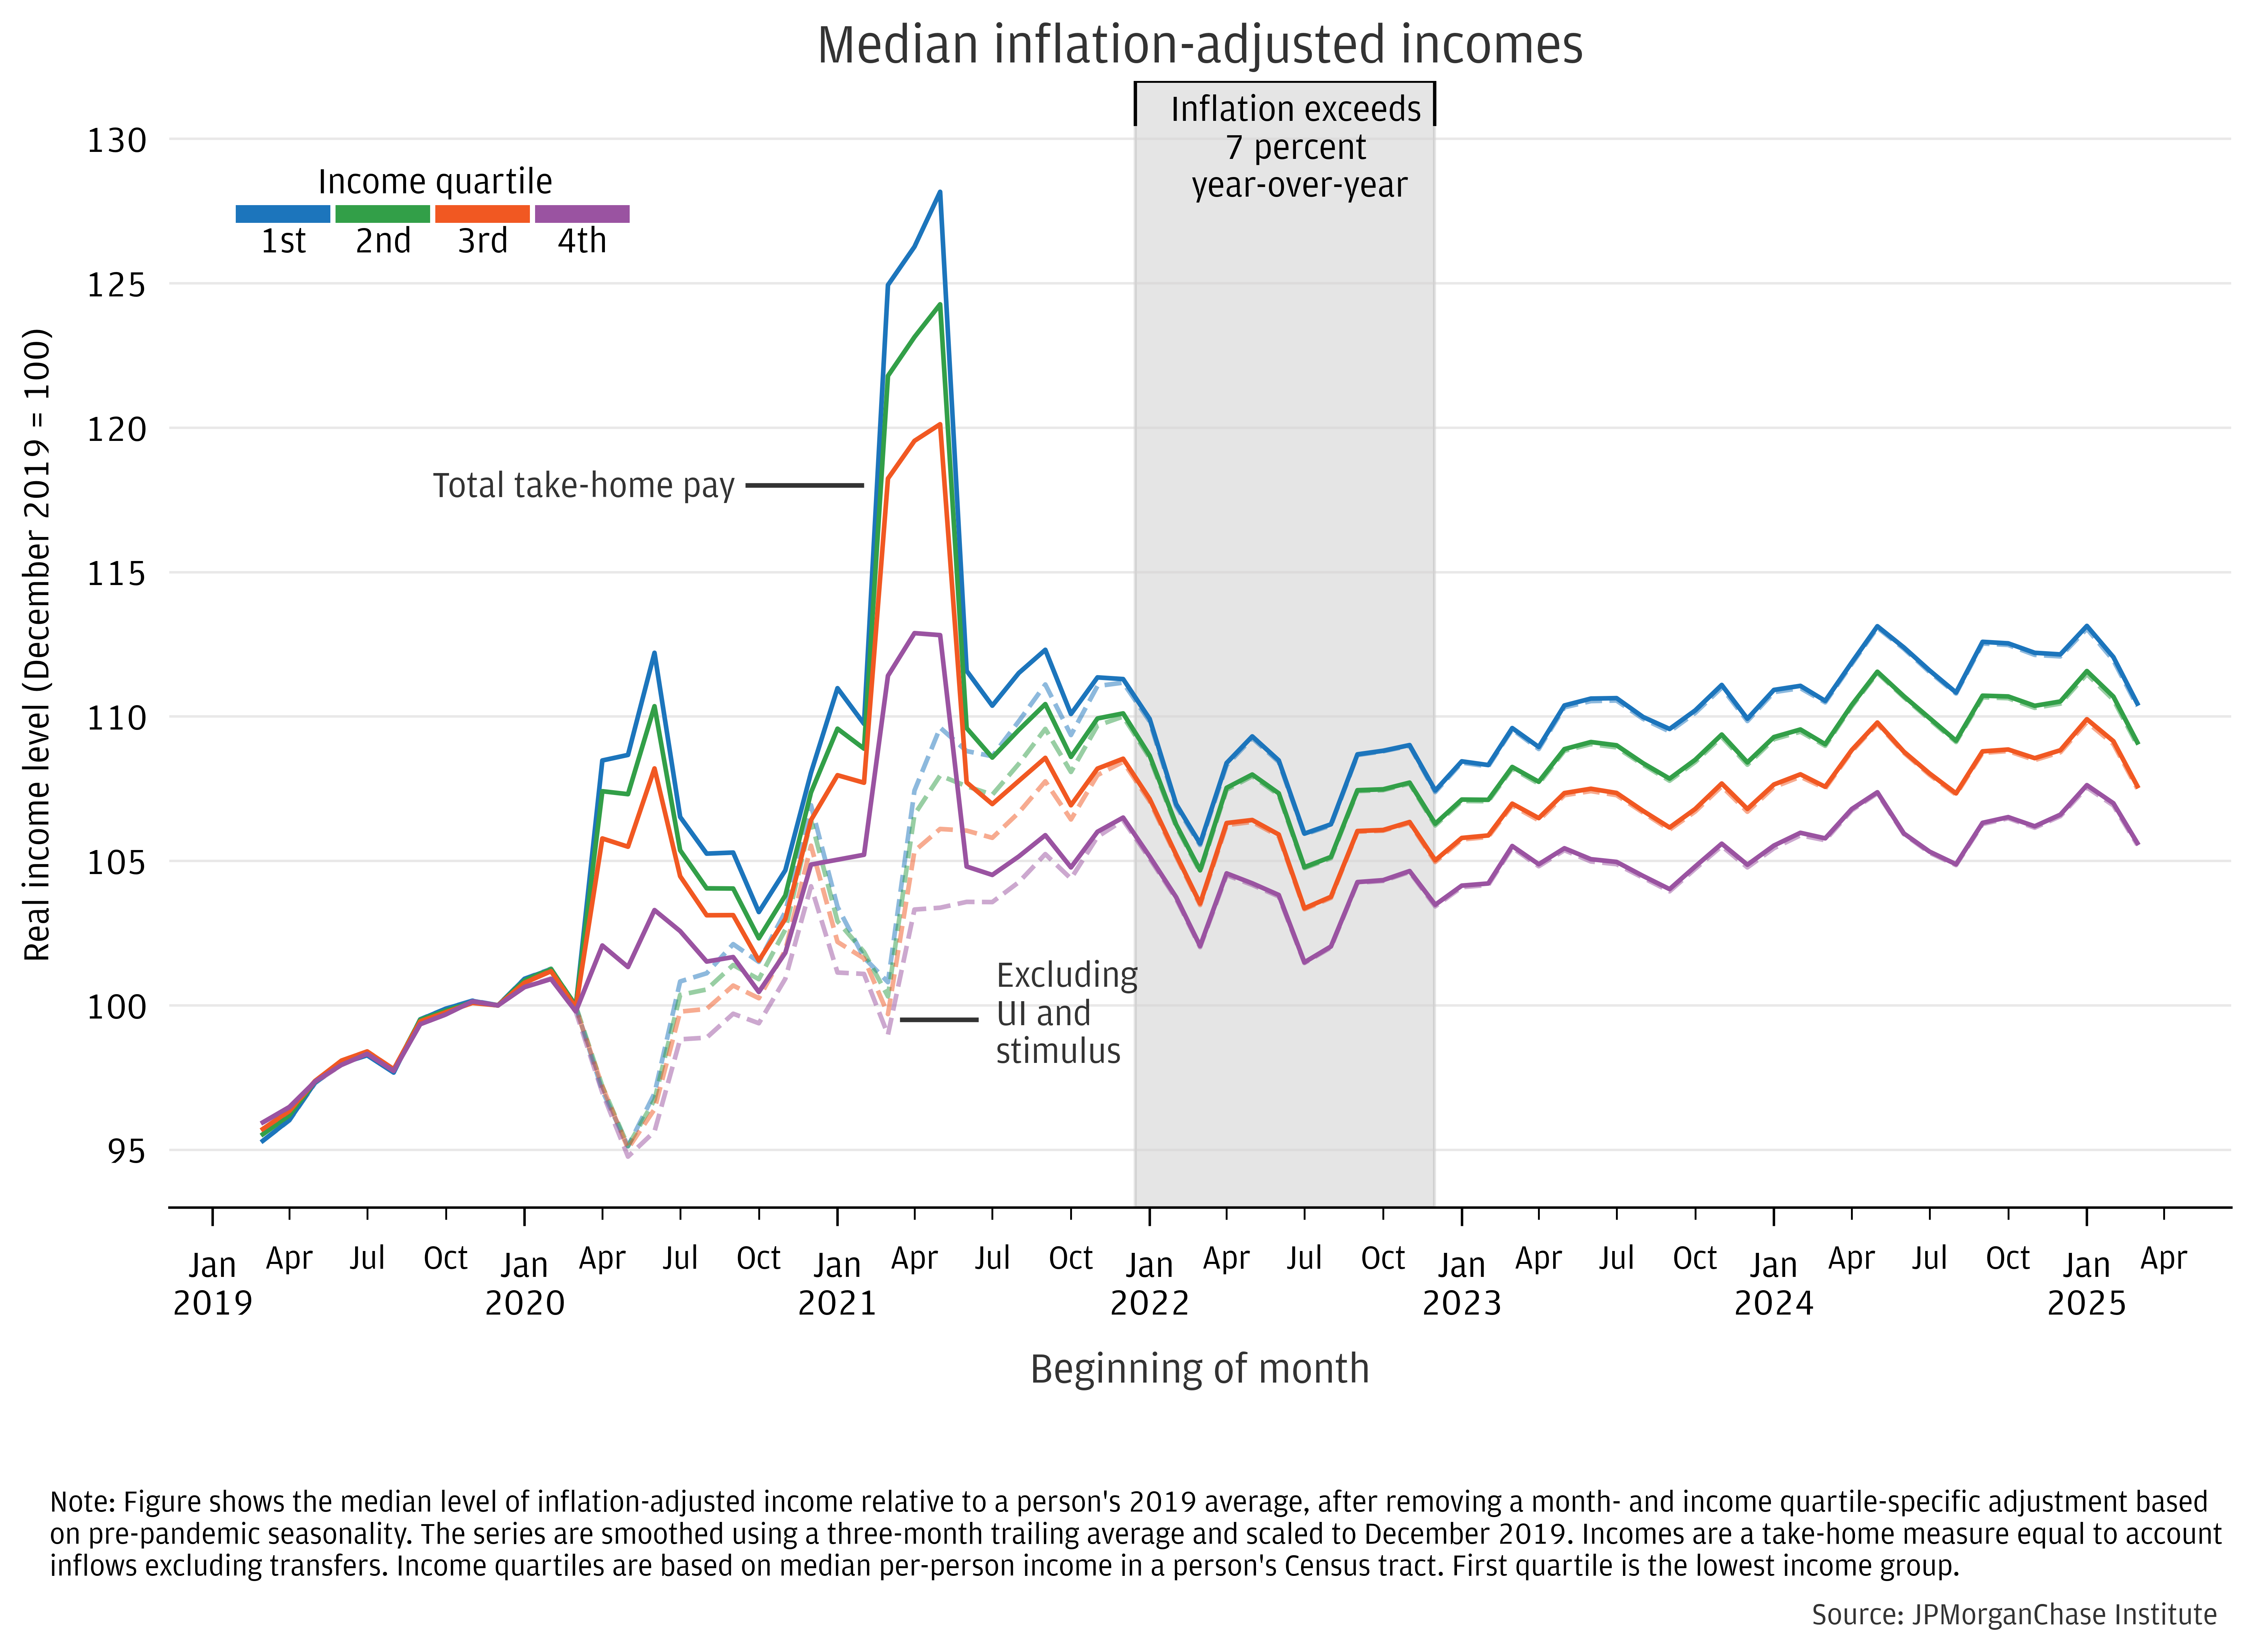
Figure 1 shows median monthly changes in real incomes by income quartile from December 2019 to March 2025. We adjust for inflation using the Consumer Price Index for All Items (CPI). This five-year period comprises notable sub-episodes for income dynamics: (1) strong gains in total income peaking in 2021, fueled by stimulus and a quickly recovering labor market; (2) decline and stagnation during 2022, as prices rose and stimulus faded; and (3) modest real gains since 2023.
For all income groups, median growth was about flat from March 2024 to March 2025 after adjusting for CPI. Notably, real income levels in March 2025 were approximately the same as in late 2021, when pandemic fiscal stimulus had largely faded, but prior to the 2022 peak in inflation. Since December 2019, lower income groups have continued to sustain modest, relative gains. However, differences by income group have been stable since late 2021: the solid labor market since then has not led to further narrowing of income gaps.
Figure 1: Median incomes were roughly flat from year-ago levels across income groups after adjusting for inflation.
This report uses data covering nearly 20 million active checking account users from 2008−2025, over 7 million of which make up the 2019−2025 sample. It tracks people’s incomes over time and shows the median change in incomes divided by CPI, rebased to December 2019. The panel is balanced—the same people recorded every month—with an average age of 39 in 2019 and 44 in 2024. This approach effectively straddles the workforce’s median age of 42, according to the Bureau of Labor Statistics.2,3 Due to aging inherent in within-person income measures, the sample captures career progression in addition to economy-wide gains. Earnings growth tends to be faster during people’s 20s, then steadily declines, turning negative in people’s 50s, on average (Guvenen et al., 2021; Wheat and Eckerd, 2024).
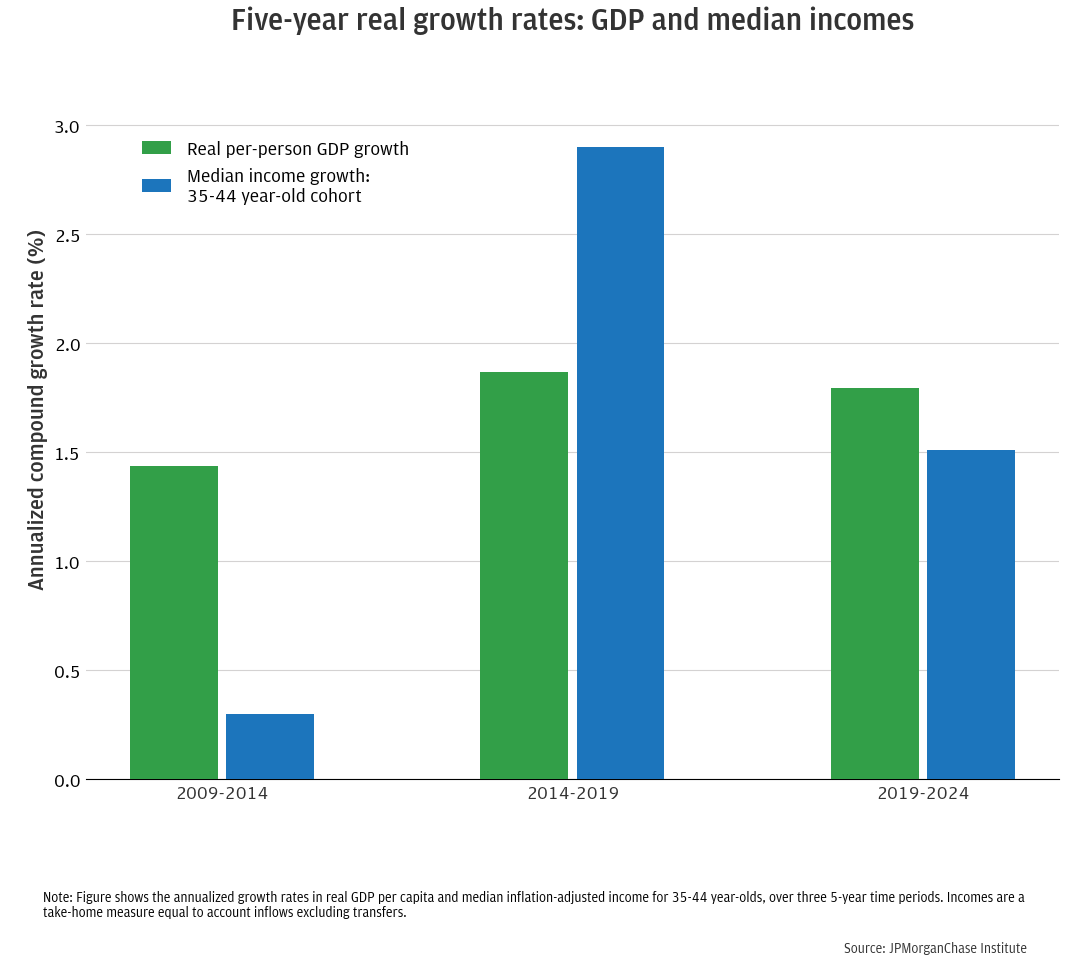
Median real growth in take-home pay was comparatively slow during the 2019–2024 period relative to its pre-pandemic trend and compared to overall economic growth within the same period. Real GDP per-person grew 1.8 percent annualized (9.3 percent total) from 2019 to 2024, compared to a median pay increase of 1.5 percent annualized (7.6 percent total) for our sample’s cohort of people aged 35−44 in 2019. By contrast, from 2014 to 2019, the pace of real median take-home pay growth averaged a percentage point higher than real GDP growth. Still, income gains since 2019 have been better than from 2009 to 2014. This reference period featured relatively low GDP growth—reflecting a rebound, albeit sluggish, from the 2007−2009 Great Recession—and quite low real income growth amid high unemployment.
Figure 2: Relative to GDP growth and pre-pandemic trends, median real income growth has been modest.
Individual-level income performance relative to GDP is related to the economic concept of the labor share of total output. This quantity measures how much of national income accrues to workers, with payments to capital and profits making up notable parts of the remainder. The percentage of total output paid as wages and salaries declined during and after the Great Recession, before stabilizing and then rising over 2014−2019, according to the Bureau of Labor Statistics (BLS).4 During 2019−2024, the share first rose (in part because economic output contracted temporarily), but subsequently fell to new historic lows. The shift lower in median pay gains relative to GDP is consistent with the trend lower in the labor share of output since 2019, observed in aggregate public data. Taking these three intervals together, the median real income changes experienced by workers, relative to economic output, has been consistent with the aggregate trends in the labor share of GDP.
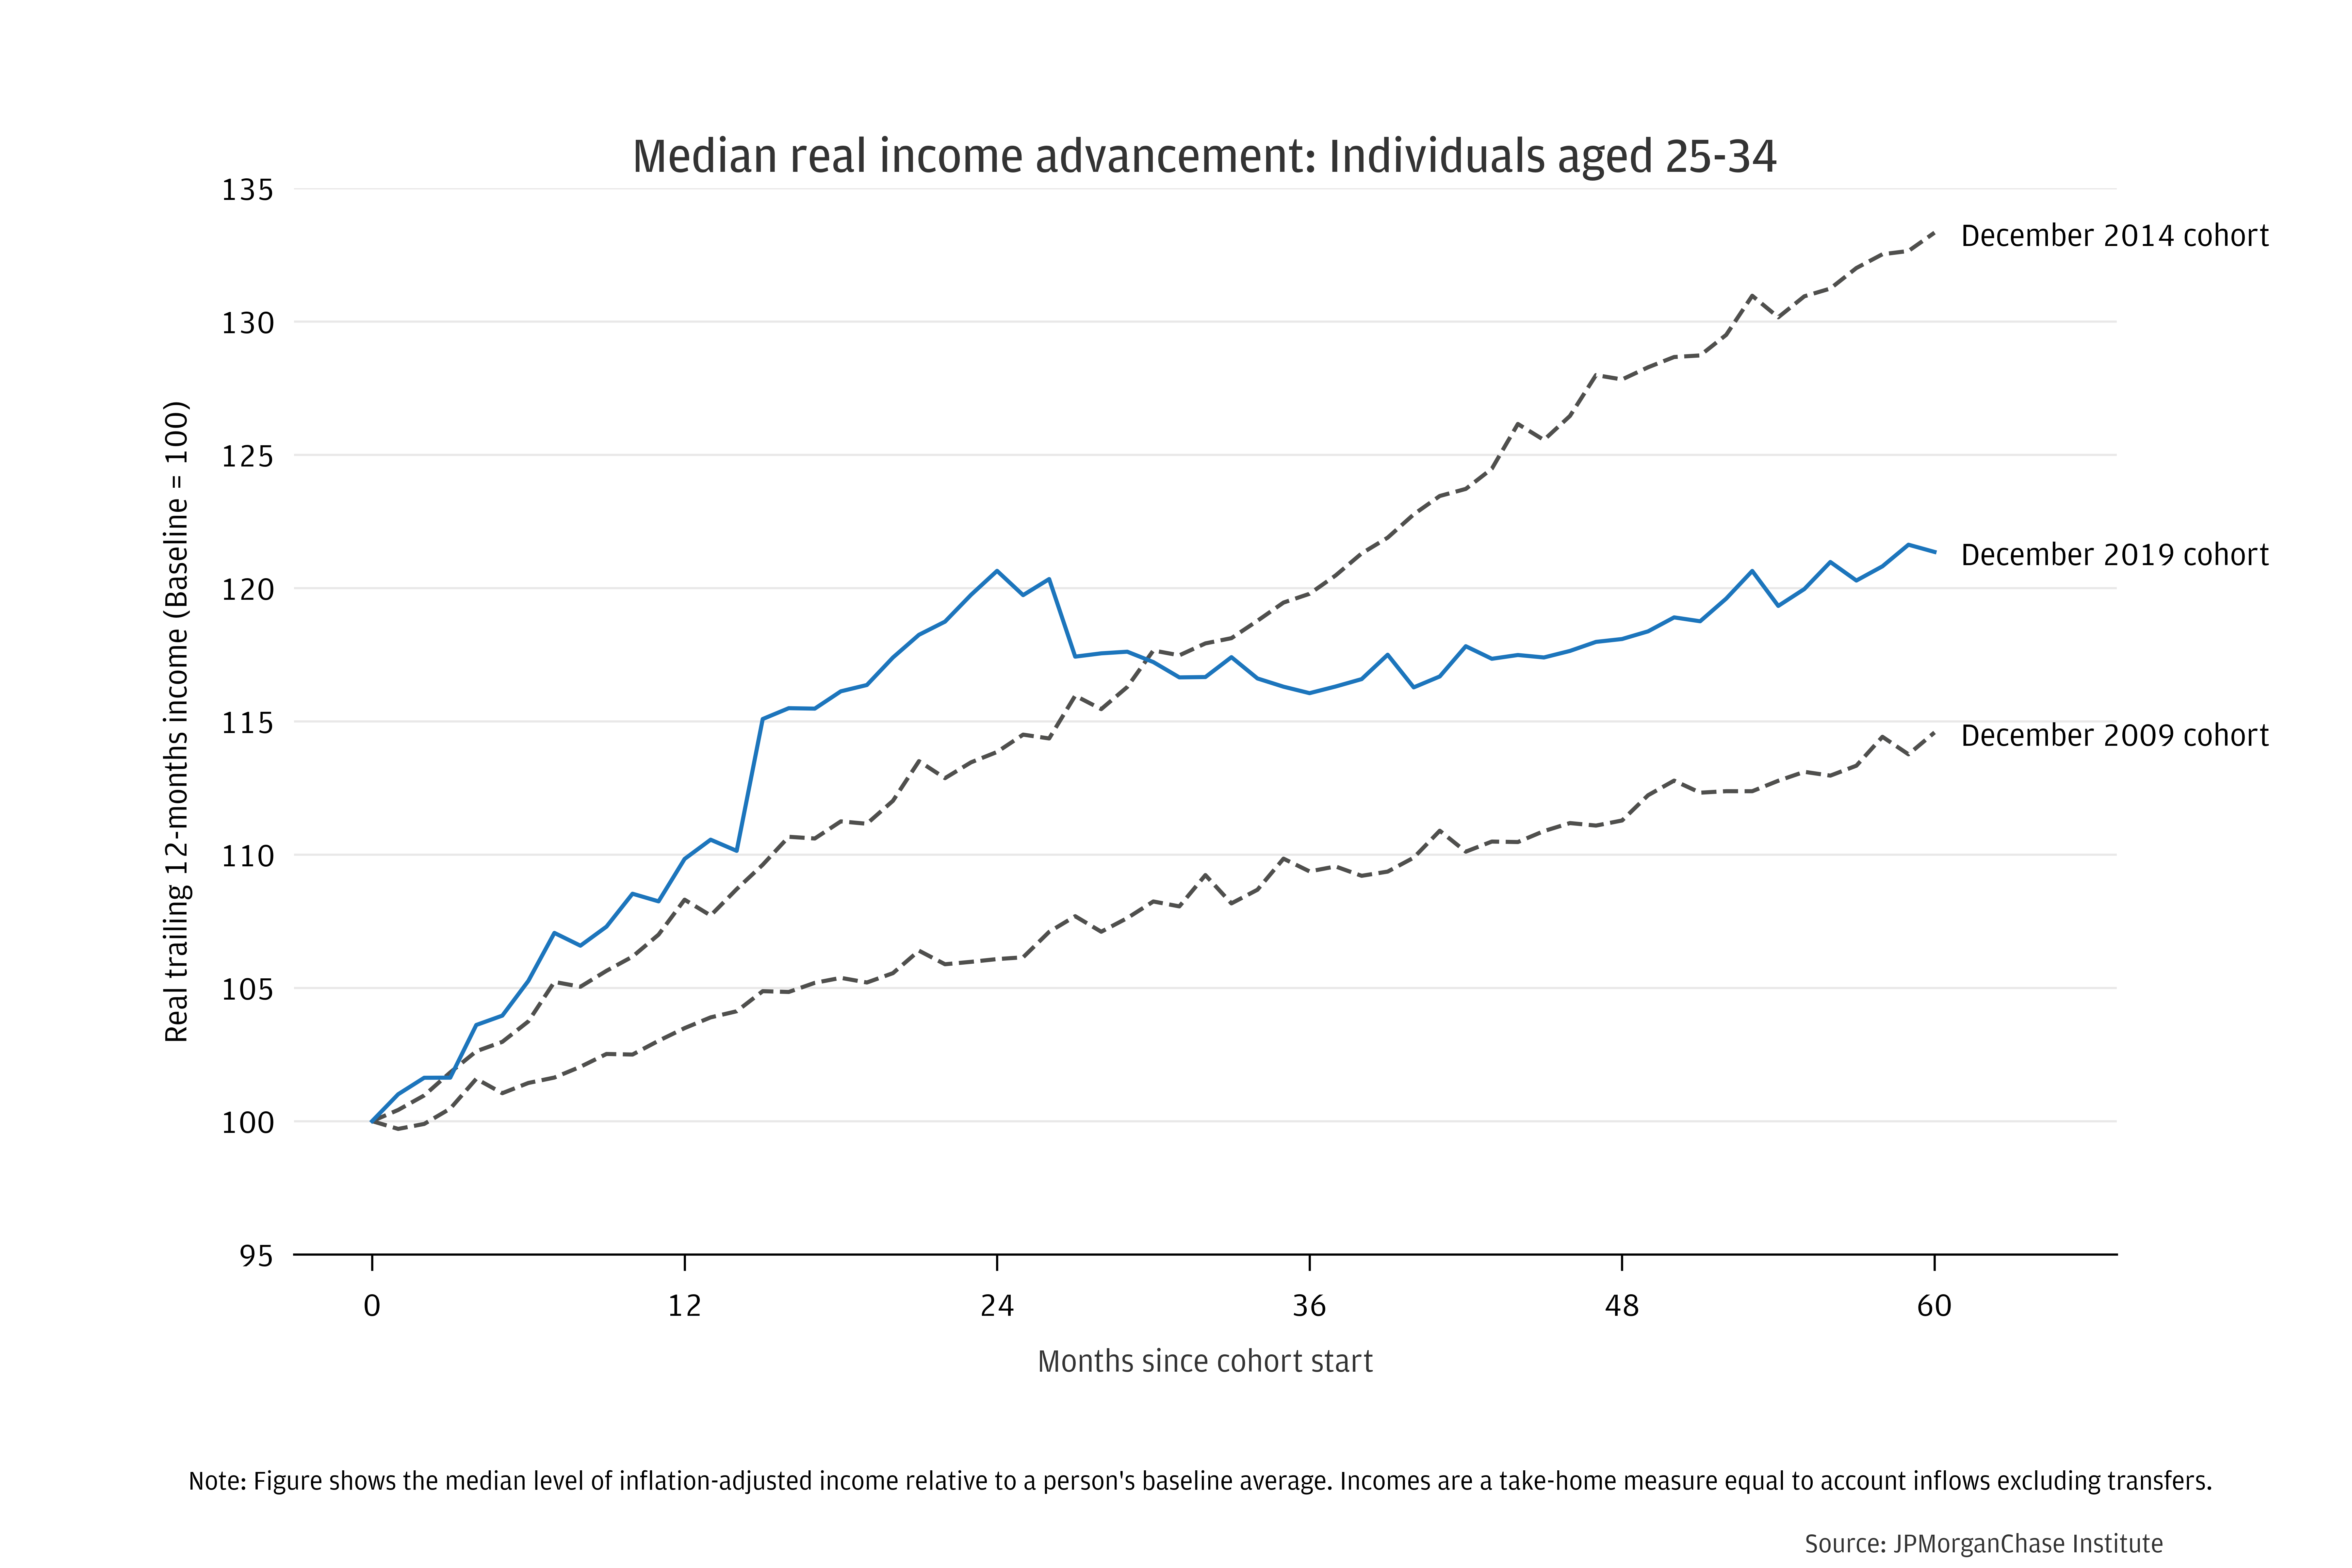
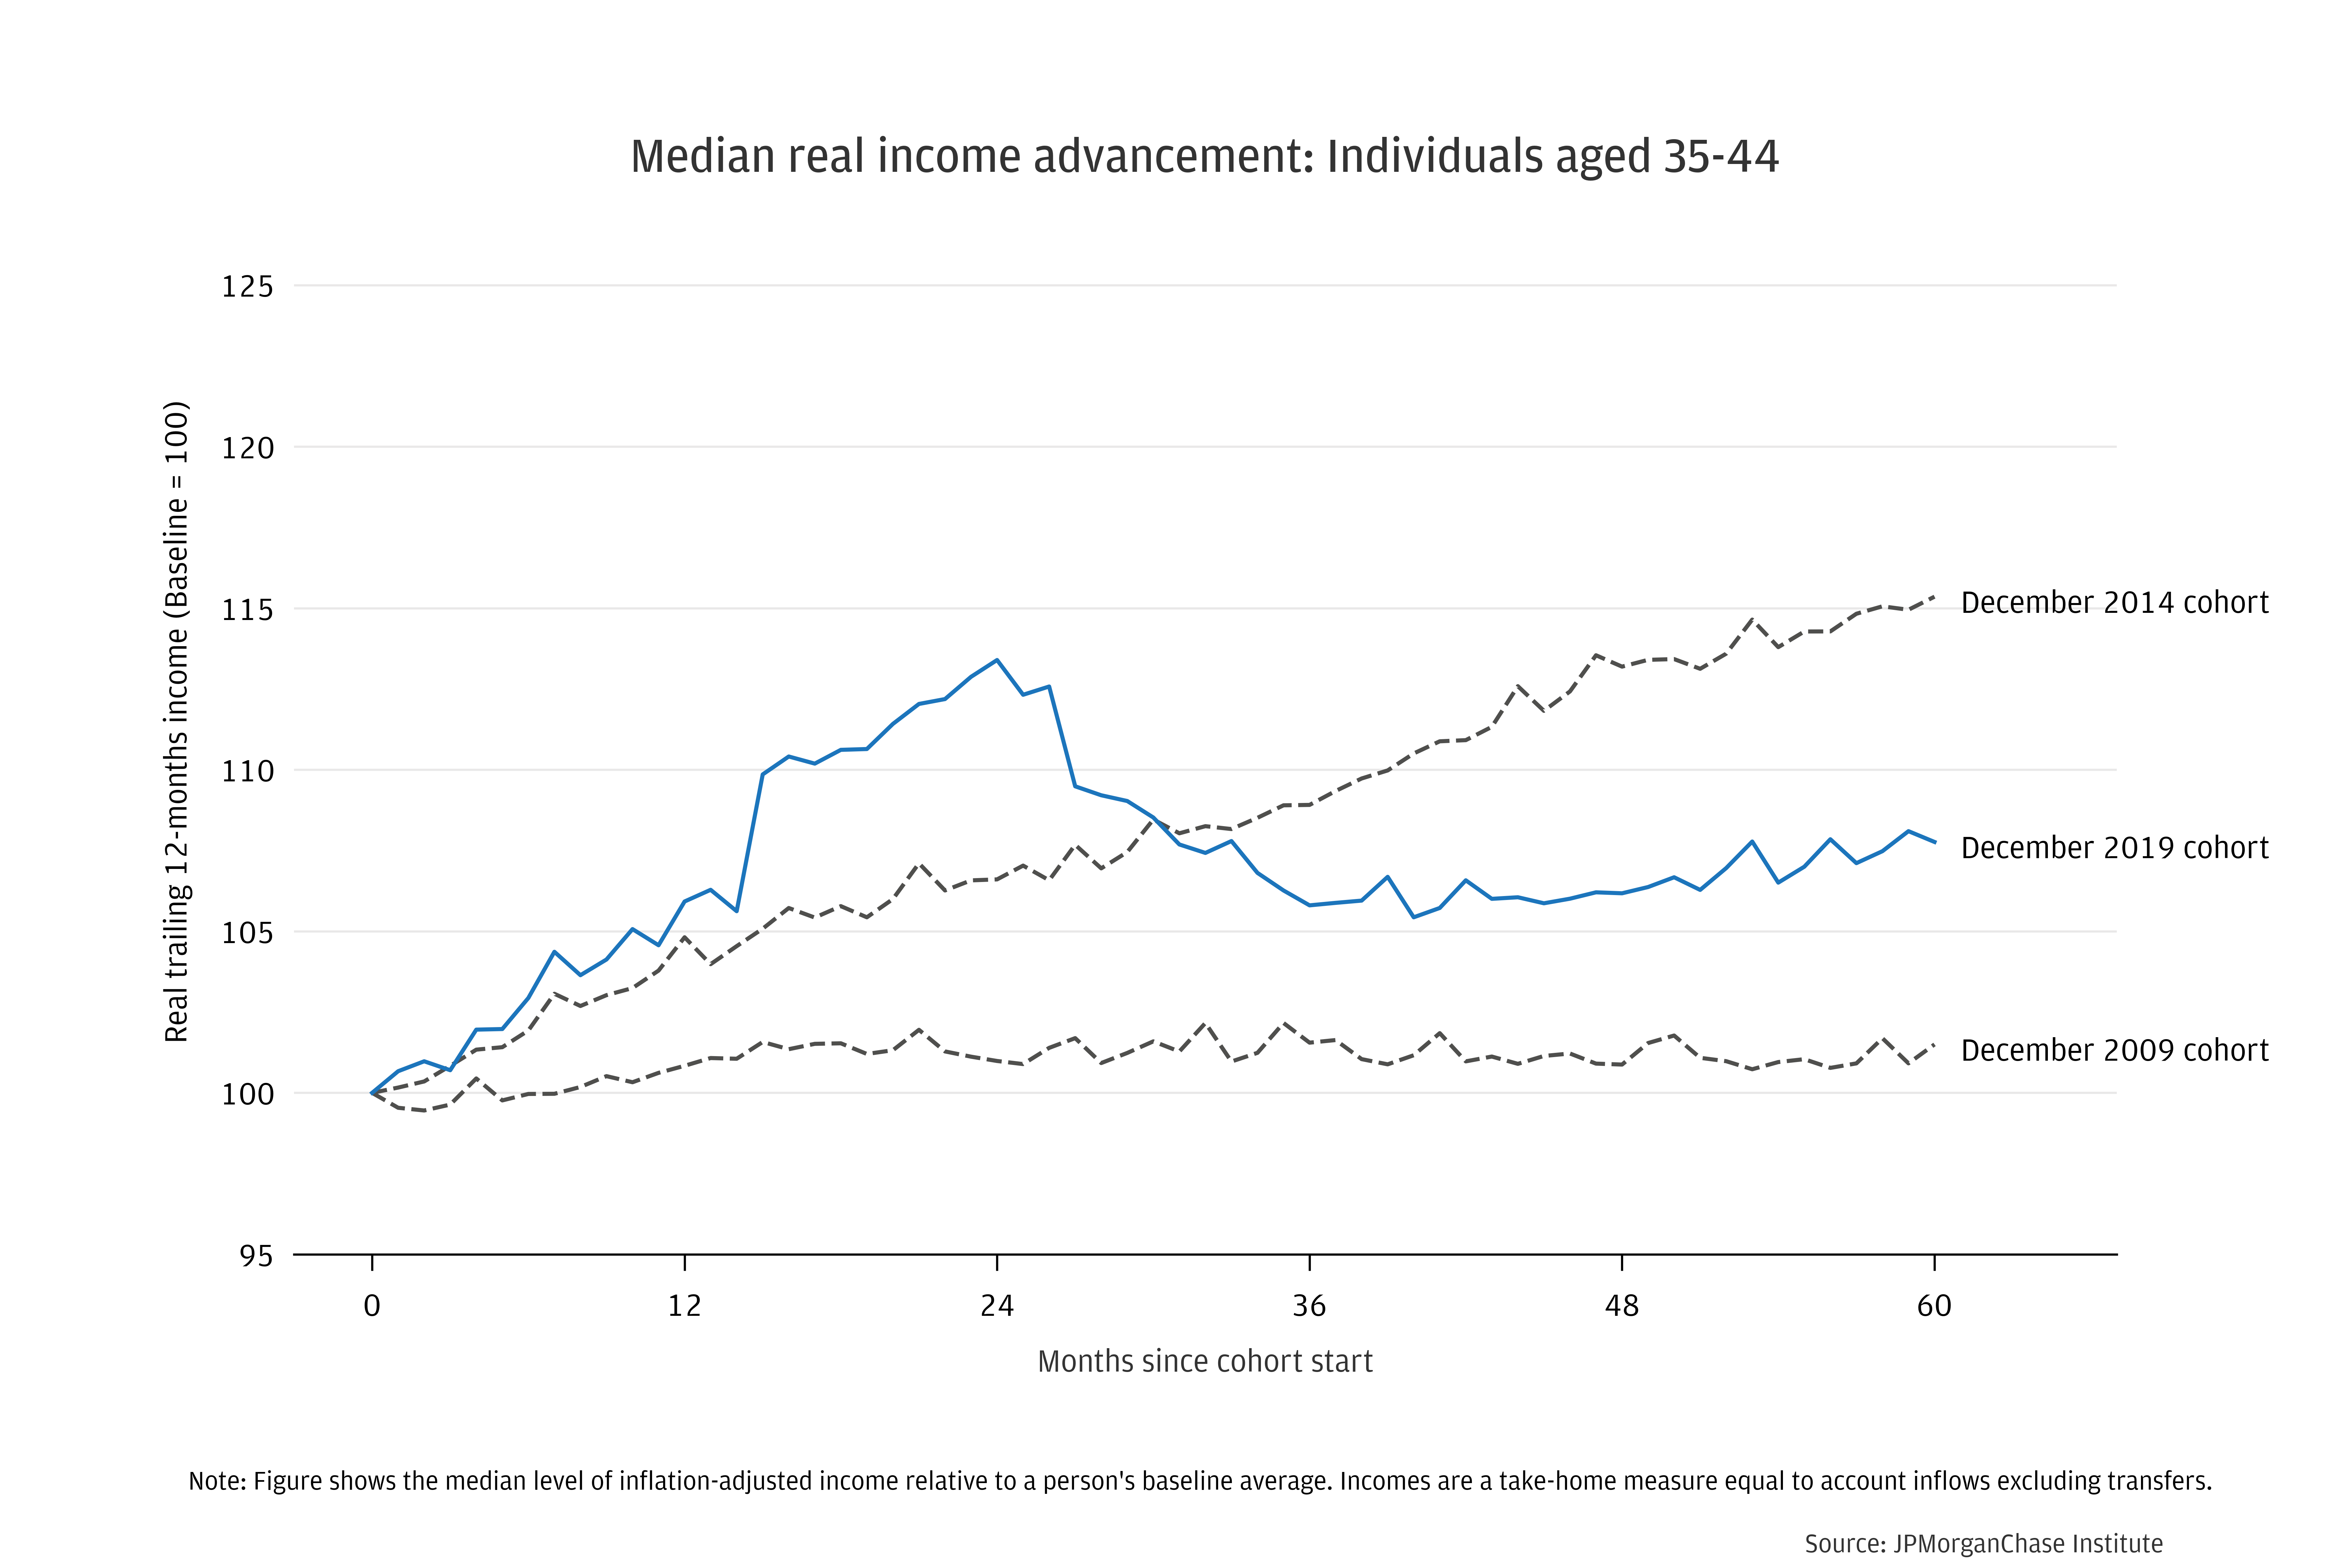
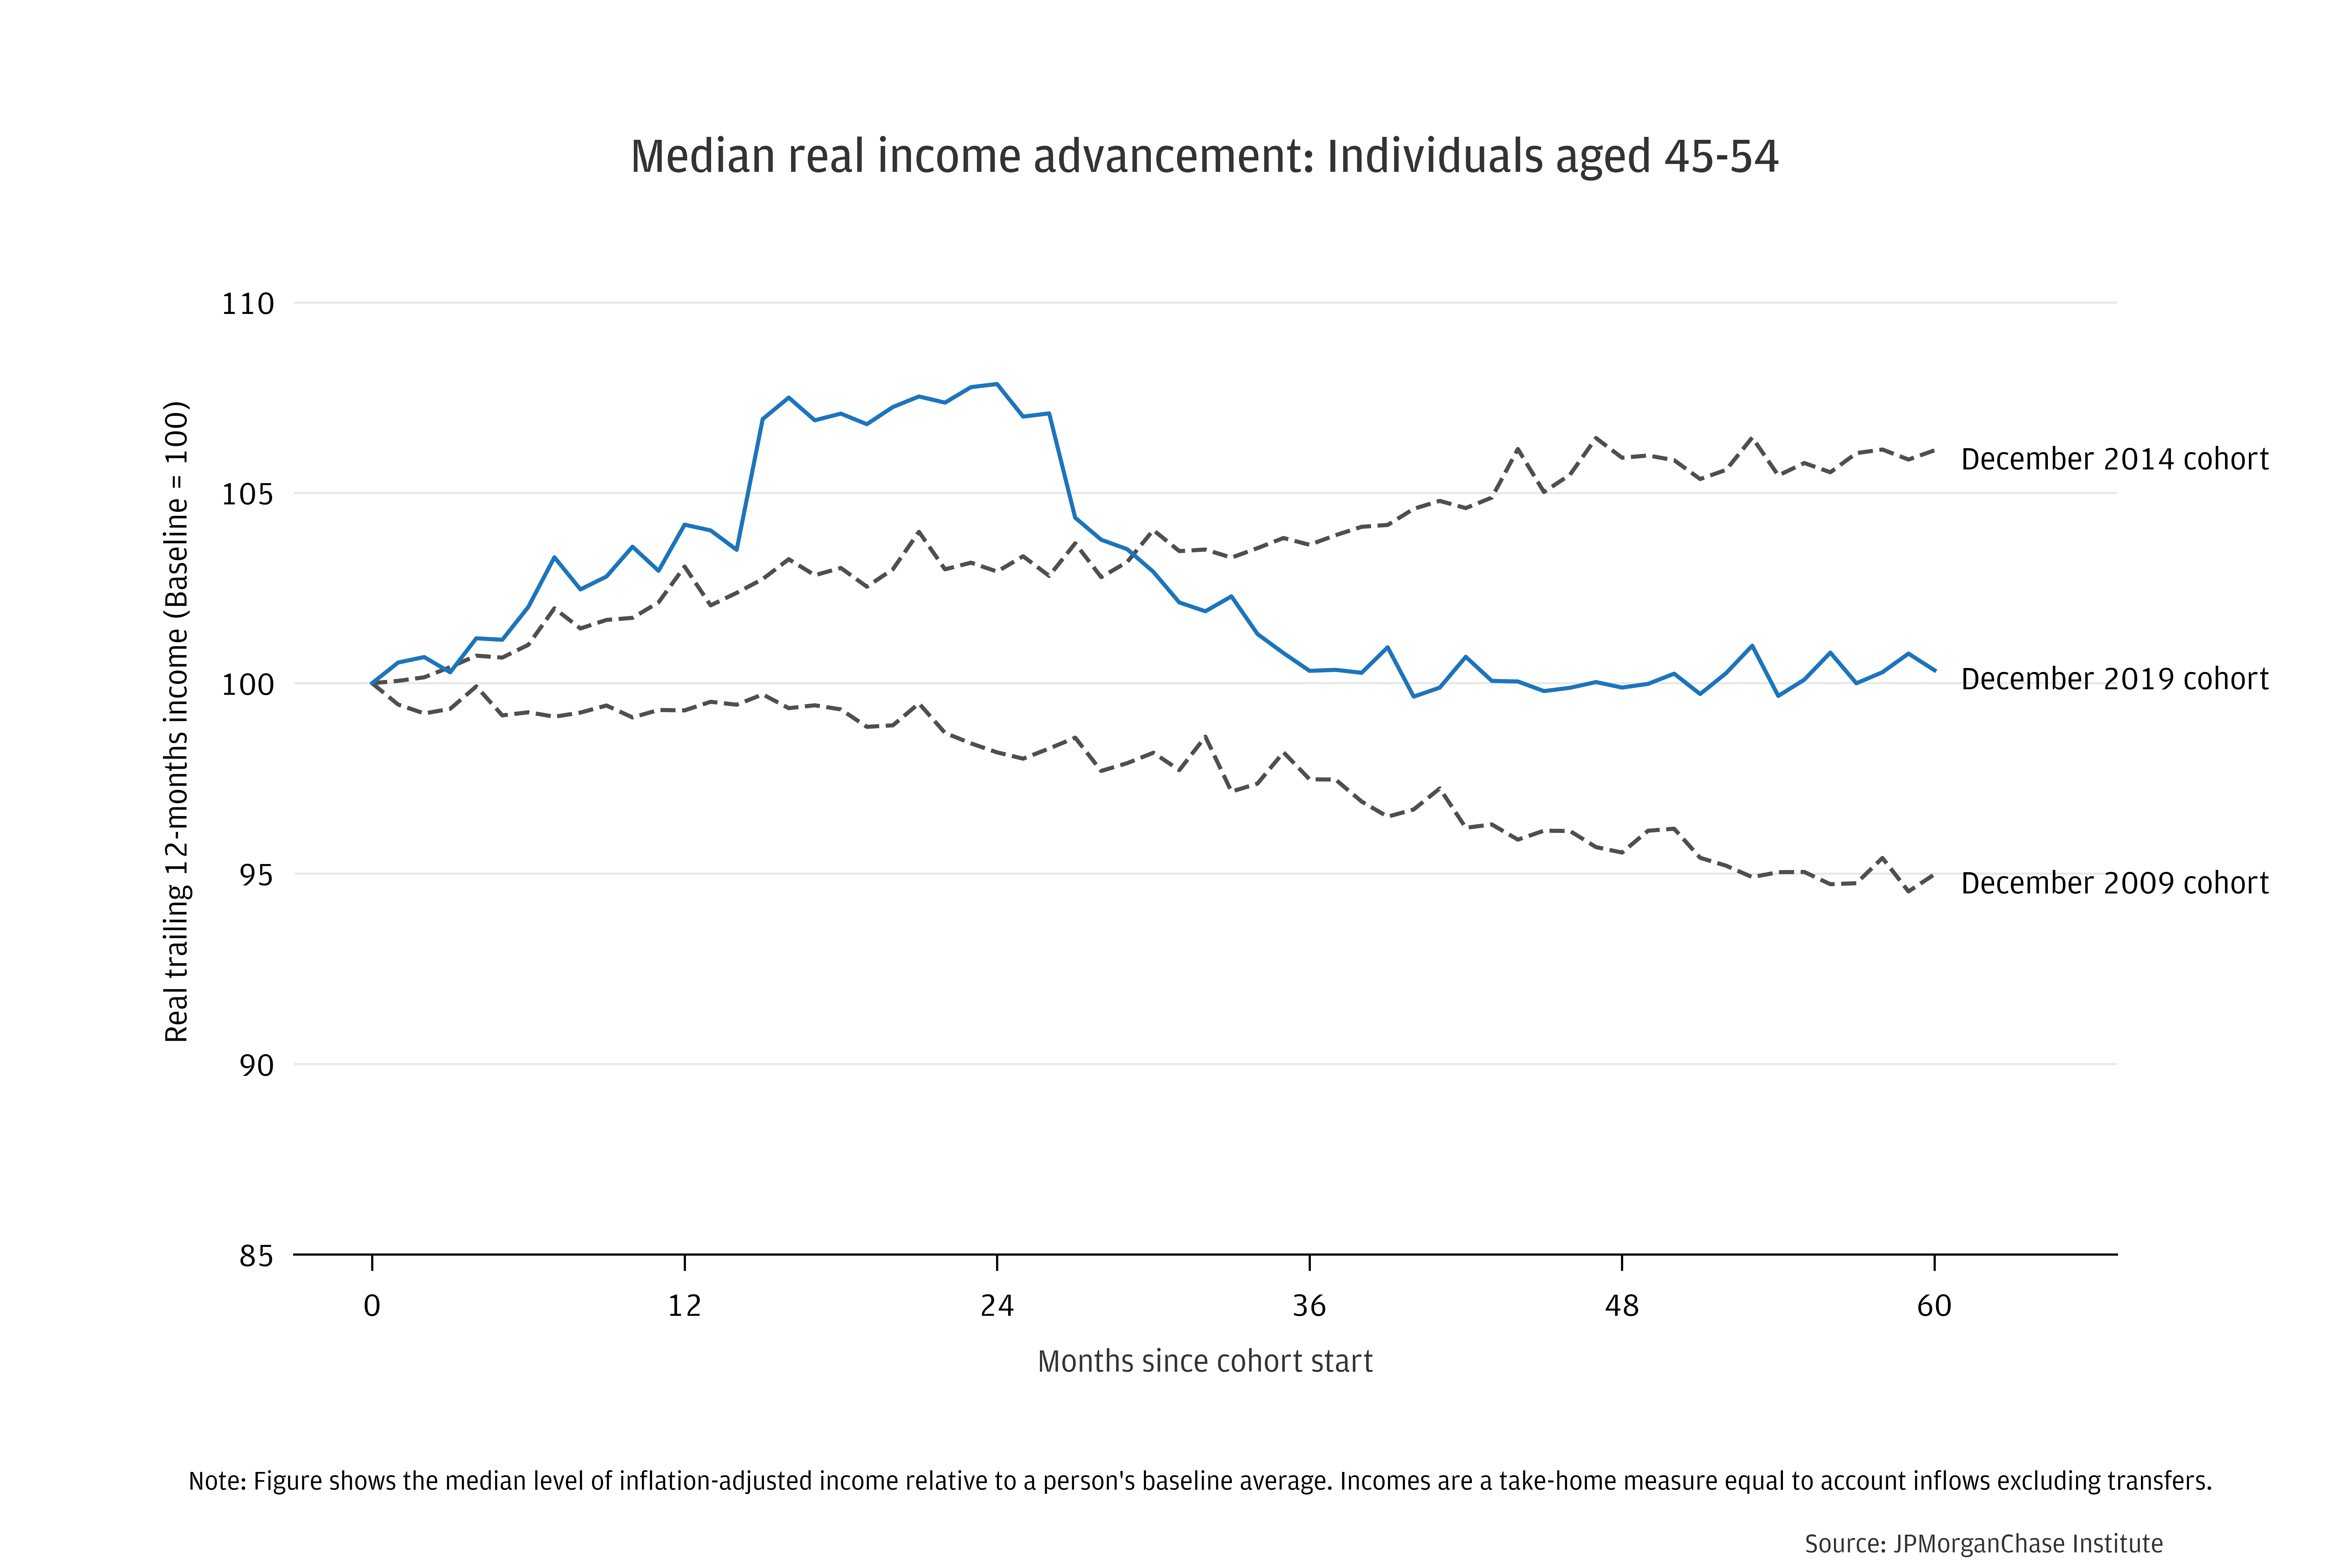
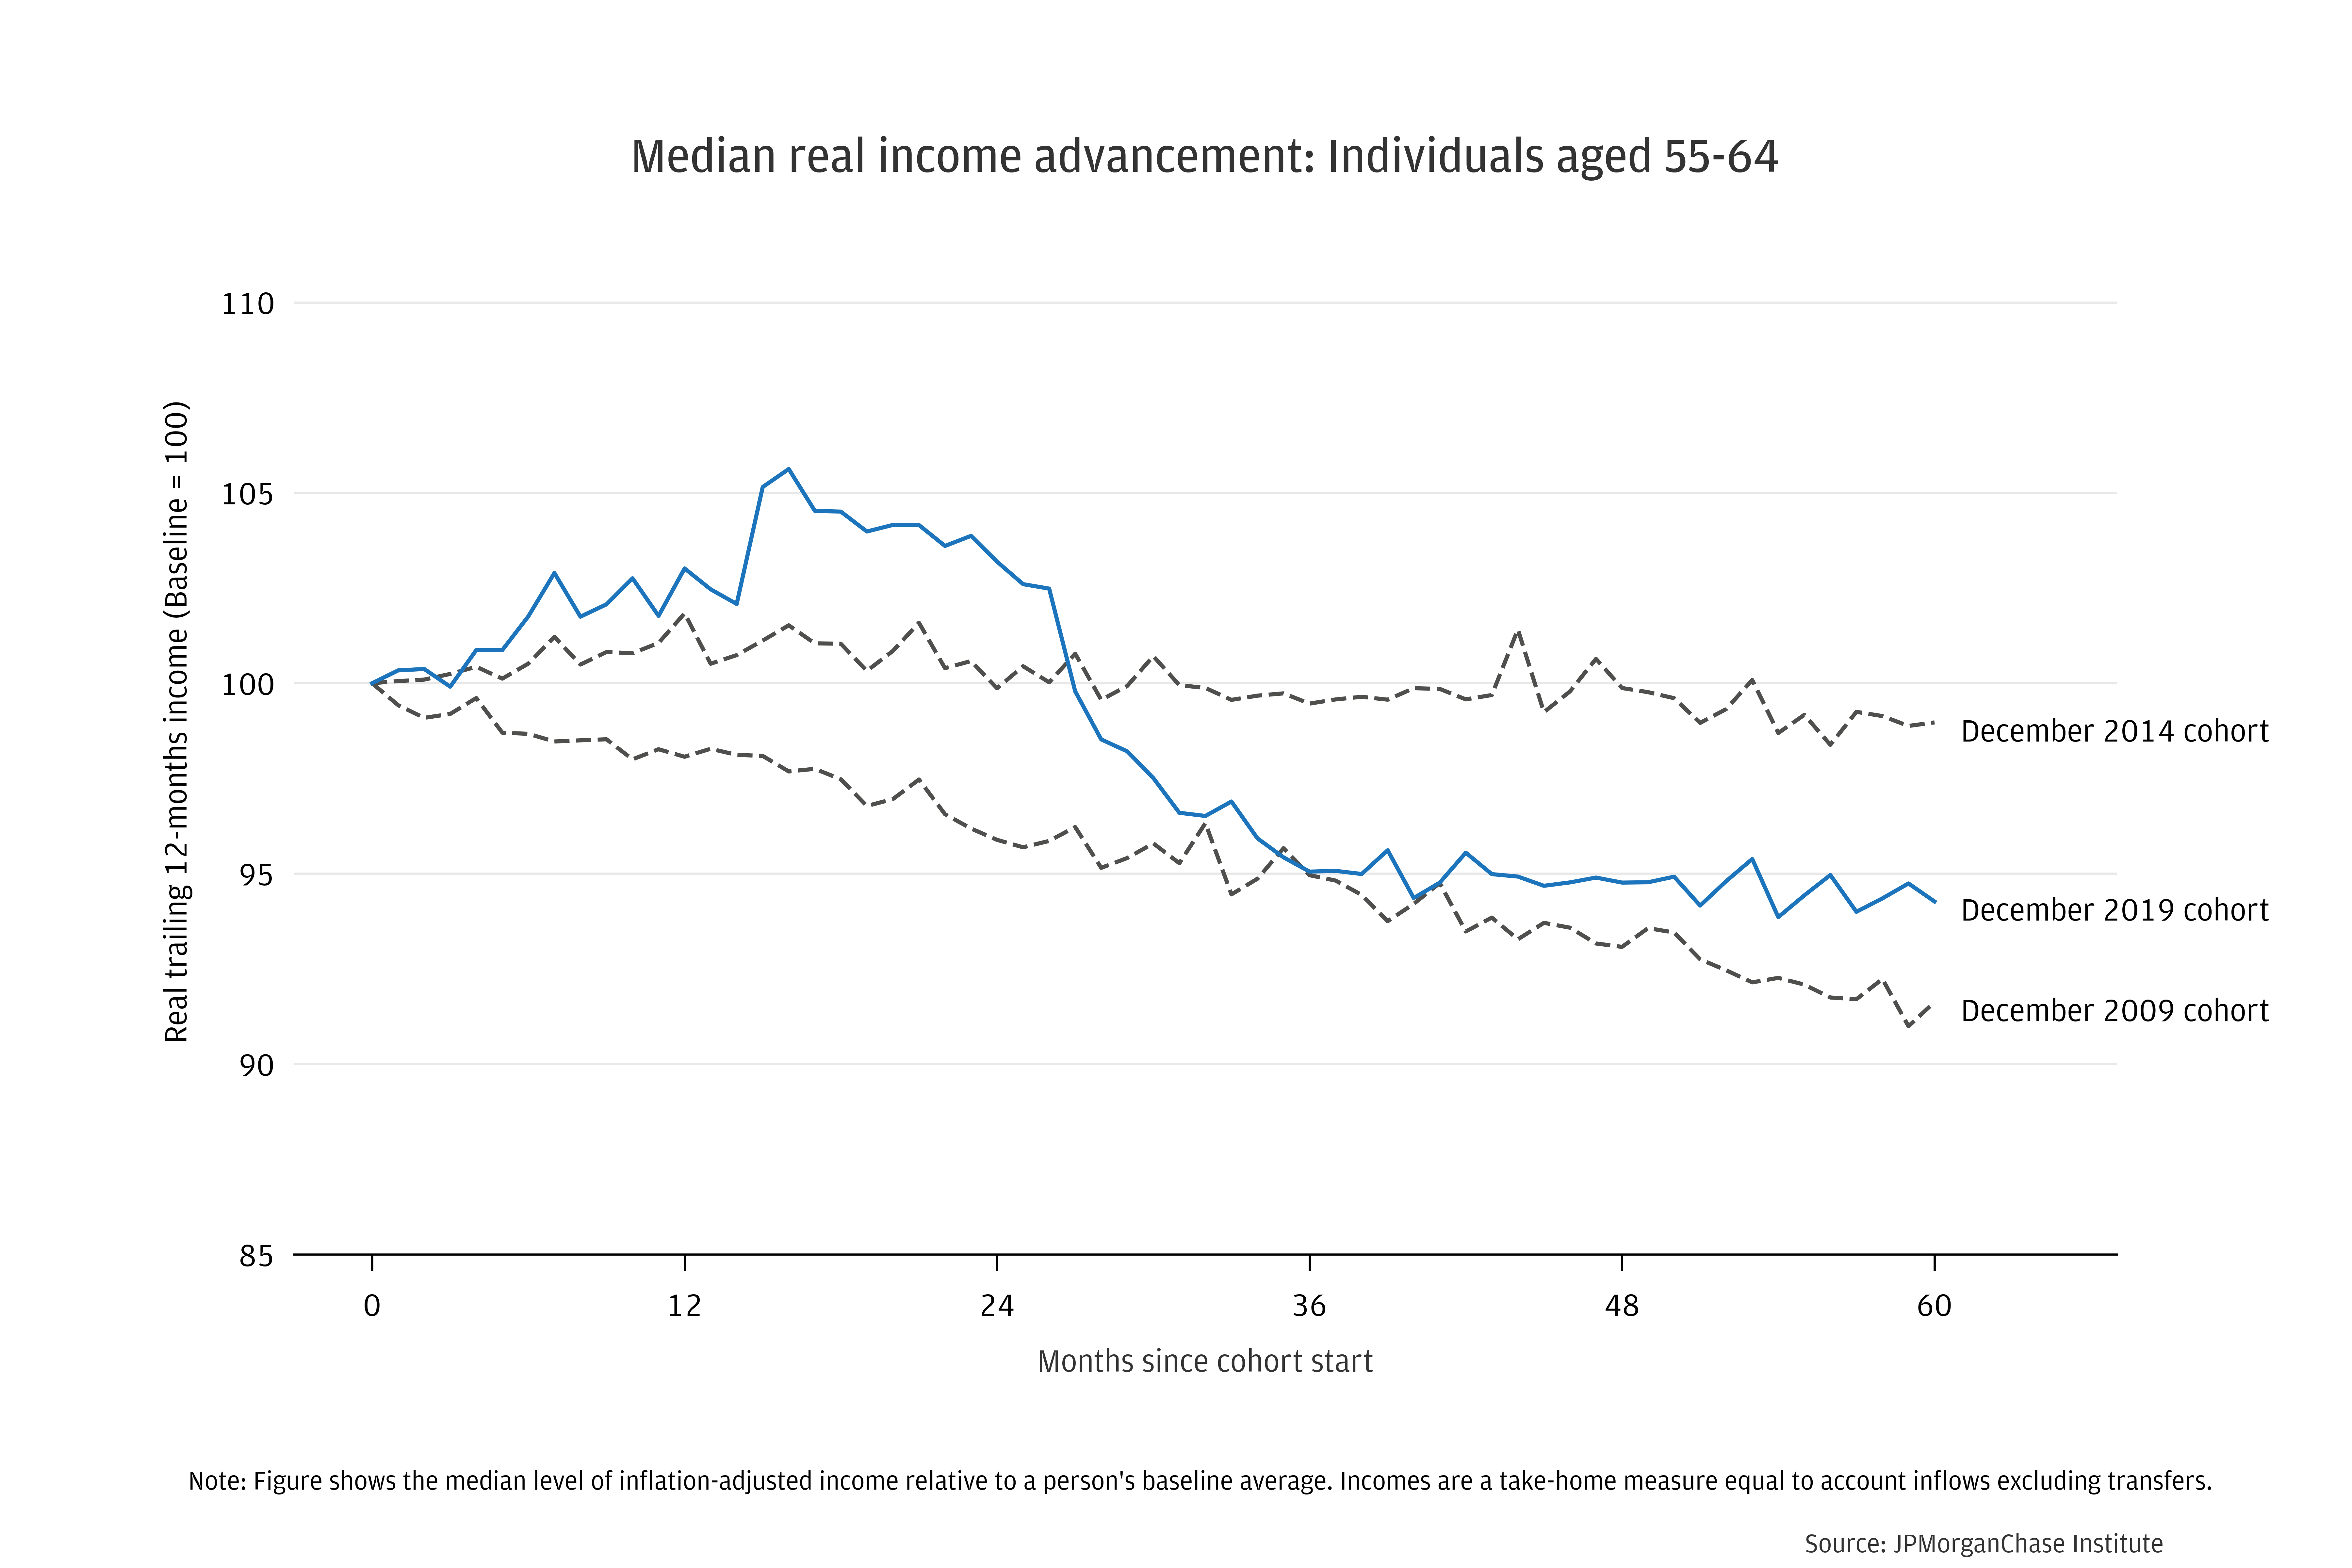
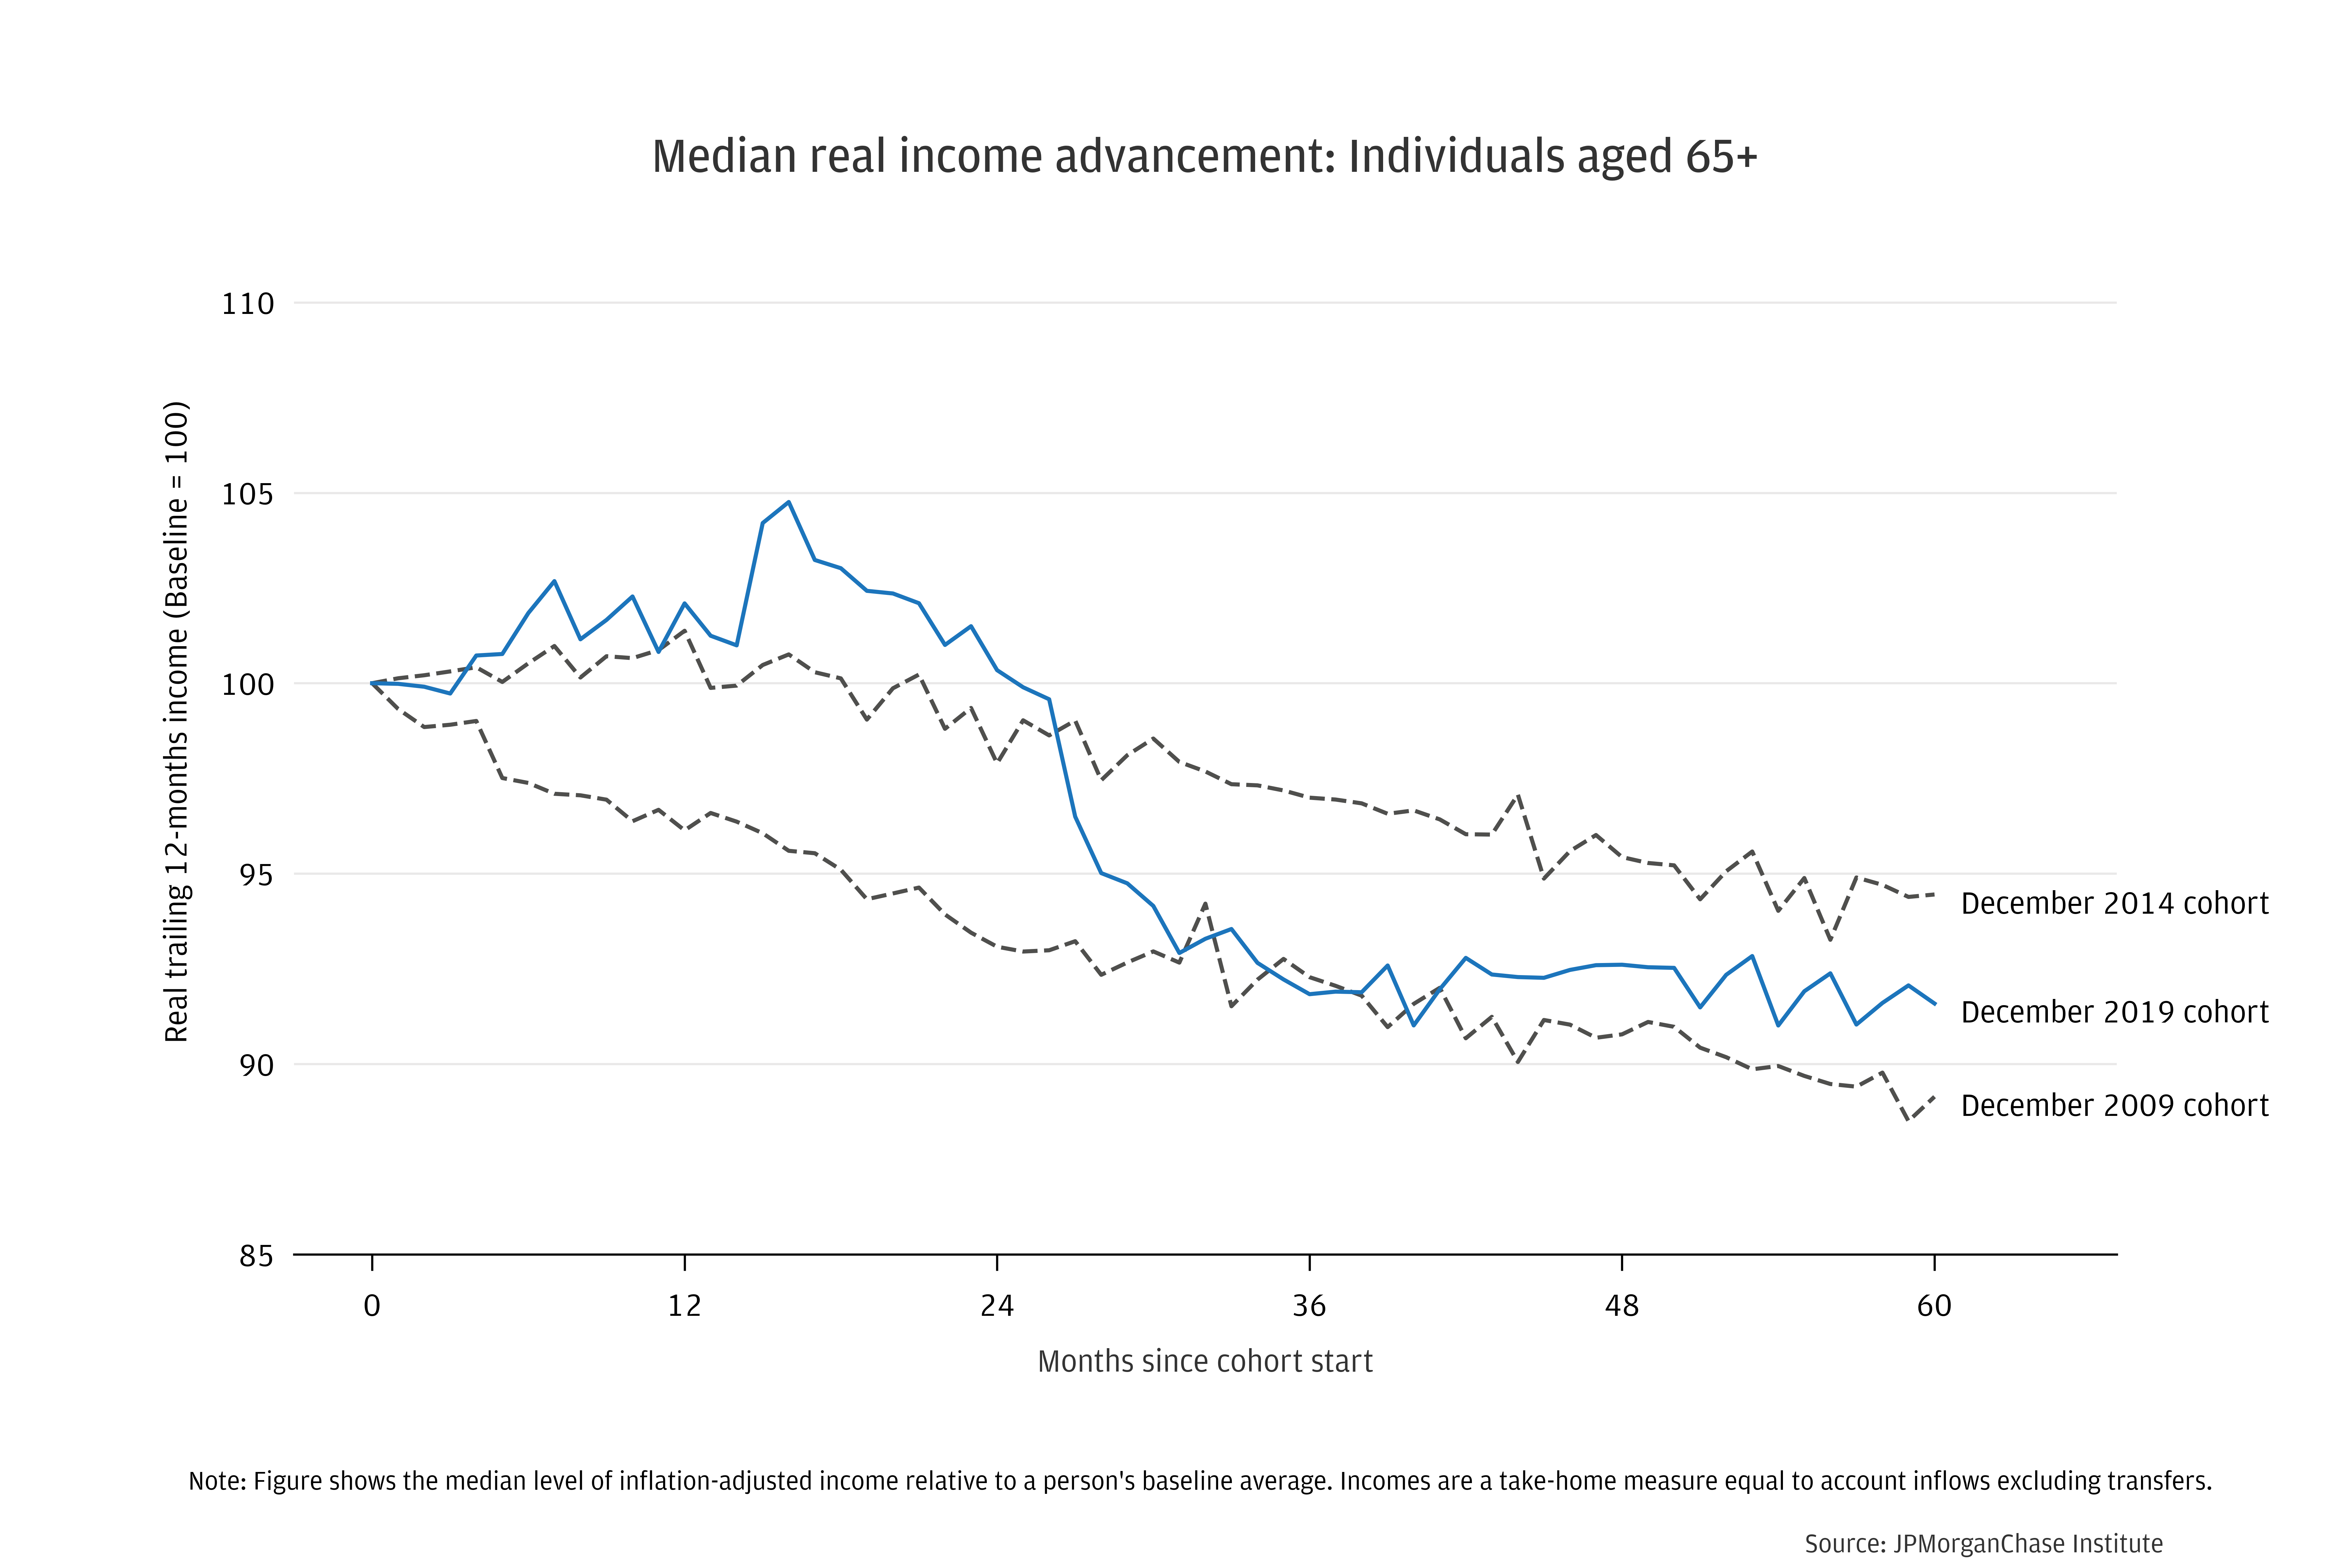
Figure 3 shows median real income growth for each age group, comparing 2019−2024 to both 2009−2014 and 2014−2019. The panels tell a largely consistent story across age groups. Each shows 2019–2024 outperforming 2009–2014, but underperforming 2014–2019, mirroring the performance for 35–44-year-olds seen in Figure 2. Younger people tend to show much higher growth than older people, a function of career progression over the lifecycle (Guvenen 2021; Wheat and Eckerd, 2024).
Compared to the cohorts starting in 2009 and 2014, inflation-adjusted income growth had been low for older people (55–64 and 65+), as of the end of 2022 (36 months after the cohort start). The trend may have been influenced by the rise in early retirements during the pandemic (Montes, Smith, and Dajon, 2024). Since then, median real income paths improved for older age groups, posting net gains in between the two pre-pandemic benchmarks, in-line with the younger cohorts.
Figure 3: Real income growth from December 2019 through December 2024 was in between that of five-year paths for cohorts starting in 2009 and 2014, across age groups.
Personal income growth, relative to prices, across the population is one way to gauge how well overall economic performance translates into gains in people’s well-being. Advancements in real purchasing power since 2019 have been below the pre-pandemic trend, whereas GDP growth over the past five years has been approximately the same as it was from 2014 through 2019. While the labor market has been strong, American workers may sense that it could have been even stronger.
In terms of differences by income level, the tight pre-pandemic labor market delivered sustained, relative gains for lower-income people. Excluding government stimulus, income growth remained stronger for lower-income people from December 2019 through the end of 2021. Since then, growth has been approximately the same across income quartiles. While the labor market has been strong enough to sustain relative gains for lower-earners, income gaps haven’t continued to shrink.
These measures can be used by policymakers to gauge conditions that contribute to widening or closing income disparities. The Purchasing Power series will continue as part of the Institute’s effort to track the financial experience of American workers in real terms.
Baker, Scott R, Nicholas Bloom, and Steven J Davis. “Measuring Economic Policy Uncertainty.” Quarterly Journal of Economics. 2016. https://academic.oup.com/qje/article-abstract/131/4/1593/2468873
Guvenen, Fatih, Karahan, Fatih, Ozkan, Serda, and Jae Song. 2021. “What Do Data on Millions of U.S. Workers Reveal about Lifecycle Earnings Dynamics?” Econometrica 89(5): 2303-2339. https://doi.org/10.3982/ECTA14603
Montes, Joshua, Christopher Smith, and Juliana Dajon. 2022. "’The Great Retirement Boom’: The Pandemic-Era Surge in Retirements and Implications for Future Labor Force Participation.” Finance and Economics Discussion Series. November 2022. https://www.federalreserve.gov/econres/feds/the-great-retirement-boom.htm
Wheat, Chris, and George Eckerd. 2024. “Climbing up (or off) the career ladder: Lifecycle income progression by age.” JPMorganChase Institute. https://www.jpmorganchase.com/institute/all-topics/financial-health-wealth-creation/climbing-up-or-off-the-career-ladder-lifecycle-income-progression-by-age
We thank our research team, especially Francesca Guiso and Ali Tintera, for their contributions to the analysis. We also thank Liz Ellis, Oscar Cruz, and Alfonso Zenteno for their support. We are indebted to our internal partners and colleagues, who support delivery of our agenda in a myriad of ways and acknowledge their contributions to each and all releases.
We would like to acknowledge Jamie Dimon, CEO of JPMorganChase, for his vision and leadership in establishing the Institute and enabling the ongoing research agenda. We remain deeply grateful to Peter Scher, Vice Chairman, Tim Berry, Head of Corporate Responsibility, Heather Higginbottom, Head of Research & Policy, and others across the firm for the resources and support to pioneer a new approach contributing to global economic analysis and insight.
This material is a product of JPMorganChase Institute and is provided to you solely for general information purposes. Unless otherwise specifically stated, any views or opinions expressed herein are solely those of the authors listed and may differ from the views and opinions expressed by J.P. Morgan Securities LLC (JPMS) Research Department or other departments or divisions of JPMorgan Chase & Co. or its affiliates. This material is not a product of the Research Department of JPMS. Information has been obtained from sources believed to be reliable, but JPMorgan Chase & Co. or its affiliates and/or subsidiaries (collectively J.P. Morgan) do not warrant its completeness or accuracy. Opinions and estimates constitute our judgment as of the date of this material and are subject to change without notice. No representation or warranty should be made with regard to any computations, graphs, tables, diagrams or commentary in this material, which is provided for illustration/reference purposes only. The data relied on for this report are based on past transactions and may not be indicative of future results. J.P. Morgan assumes no duty to update any information in this material in the event that such information changes. The opinion herein should not be construed as an individual recommendation for any particular client and is not intended as advice or recommendations of particular securities, financial instruments, or strategies for a particular client. This material does not constitute a solicitation or offer in any jurisdiction where such a solicitation is unlawful.
Wheat, Chris, and George Eckerd. 2025. “Sizing up real income gains December 2019 to March 2025.” JPMorganChase Institute. https://www.jpmorganchase.com/institute/all-topics/financial-health-wealth-creation/sizing-up-real-income-gains-december-2019-to-march-2025.
Footnotes
Inflation expectations: see, for example, The New York Fed’s Survey of Consumer Expectations one-year ahead inflation expectation estimates. Consumer sentiment: see University of Michigan headline indicator. For economic uncertainty: measure by Baker, Bloom, and Davis (2016) updated for April 2025.
See table (accessed February 2025): Median age of the labor force, by sex, race, and ethnicity
This process is a change from our September 2024 report, which included individuals up to age 68, as of 2019. That sample matched the typical age of the workforce at the start of the panel, but was therefore 3.5 years older by the end. Our revised methodology effectively balances a slightly younger cohort early in the sample and a slightly older cohort later in the sample, without introducing distortions from sample composition change.
See Nonfarm Business Sector: Labor Share for All Workers. FRED ticker: PRS85006173, sourced from BLS
Authors

Chris Wheat
President, JPMorganChase Institute

George Eckerd
Wealth and Markets Research Director, JPMorganChase Institute