
Figure: Housing affordability changes across urban-rural and income spectrums show affordability worsening most in the lower-income urban center of Columbus.
Latest news

An Ohio-based company is protecting first responders around the world
With support from JPMorganChase, Fire-Dex is providing protective equipment to firefighters in 100 countries and all 50 states.
Learn moreLatest news

Veteran’s Unconventional Path to Landing her Dream Job in Tech
U.S. Army Veteran Ashley Wigfall transitioned to a civilian role and charted her path to technologist through mentorship and skills training at the JPMorgan Chase tech hub in Plano, Texas.
Learn more
Research
June 26, 2025
Columbus’s population and labor market have grown markedly faster than most of its midwestern peer cities over the past two decades.1 Over the 2010s, relatively favorable housing affordability contributed to the quality of life in the Columbus area and its attractiveness as a potential home for families and business—an outcome seen across other cities in Ohio.2 However, the national decline in housing affordability since the pandemic also hit Columbus. Like other cities, typical home prices have increased faster than incomes in the area. Additionally, higher interest rates are compounding the financial difficulties for people seeking to become first-time homeowners. In the following research focused on Columbus, we use unique data on income growth of 25-44-year-olds to highlight how the challenge of attaining homeownership is evolving for different parts of the metro area.
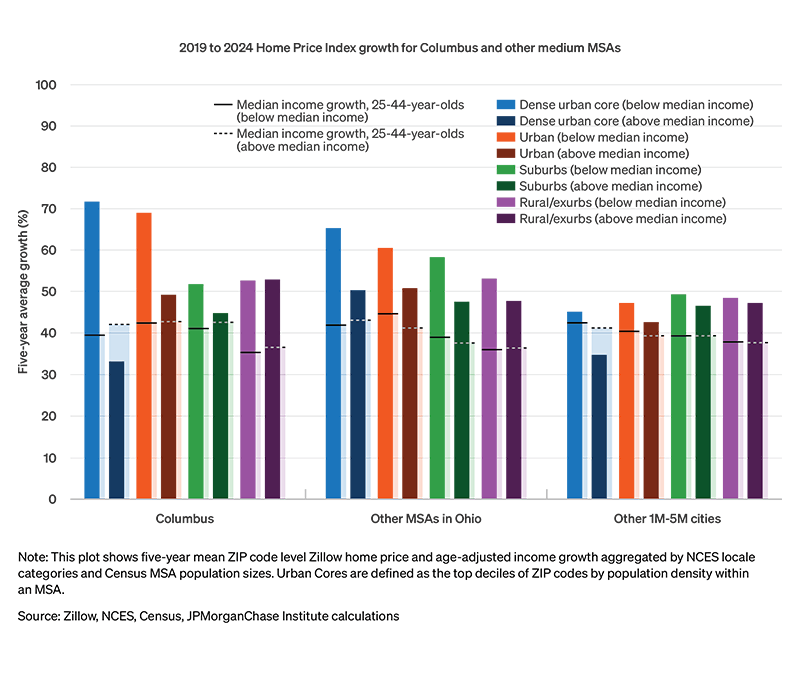
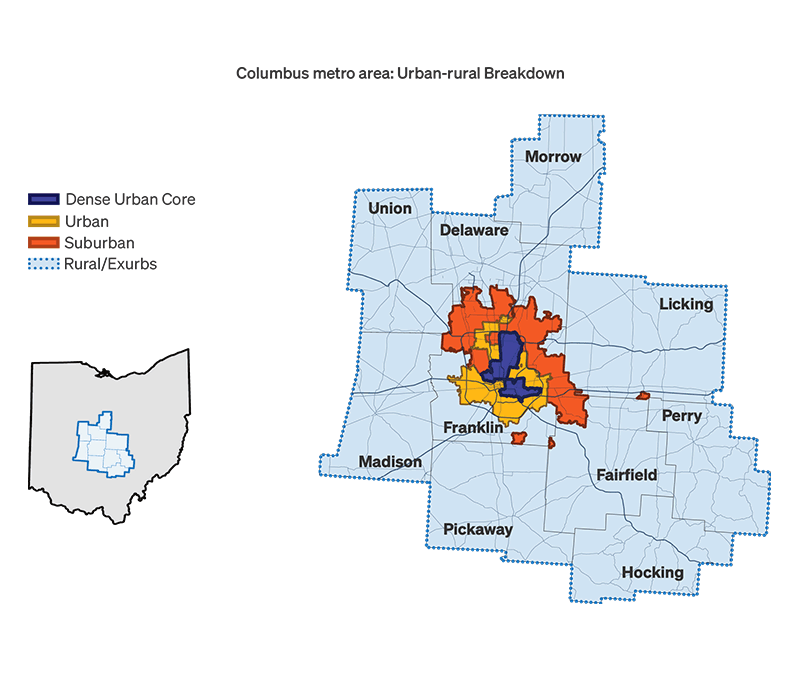
While the overall decline in housing affordability in Columbus is similar to many other U.S. cities, dynamics have varied markedly across the metro area. In particular, the gap in home prices between lower- and higher-income areas in Columbus was larger than it was in other mid-sized cities in Ohio and the national average, especially in the densely populated city center. Figure 1 captures Columbus’ 2019−2024 change in home prices relative to median growth in take-home pay for individuals of typical first-time homebuying age: those 25−44 years-old in 2019. It shows the extent to which income growth kept pace (or not) with home prices with breakouts along the urban-rural spectrum3 and by neighborhood income level. A map included at the end of the note depicts the urban, suburban, and rural breakdown of the Columbus metro area.
Figure: Housing affordability changes across urban-rural and income spectrums show affordability worsening most in the lower-income urban center of Columbus.
The largest declines in affordability occurred in lower income areas in the more densely populated urban areas of the city. Higher-income areas of urban Columbus didn’t experience as much home price growth—income growth exceeded that of home prices in the high-income parts of the urban center—potentially due to growing prominence of work-from-home arrangements disproportionately available among higher-income professions.4 Residents in these areas prior to the pandemic were more likely to have opportunities to access more space in the suburbs. Other Metropolitan Statistical Areas (MSA) in Ohio and similarly sized metros nationally showed a similar pattern, with lower-income areas experiencing greater declines in affordability, although the differences by income segment were less pronounced than in Columbus.
These patterns highlight the complex changes in the housing market in Columbus. Areas that may have been attractive entry points to the housing market in lower-income urban areas have become less attainable: their prices have been bid higher, making renters in those areas less able to make the transition to homeownership. Meanwhile, the suburbs and rural areas of the Columbus metro area have also become less affordable, affecting areas with both high- and low-income residents. Families with limited resources struggling to find affordable housing options in the area can feel squeezed in these circumstances. As highlighted in a recent Axios article on the Columbus housing market, rising construction costs make it less likely that housing supply growth will alleviate worsening affordability conditions.
The map below shows the Columbus metro area broken out by urban, suburban, and rural categories, based on NCES classifications. The urban-core group denotes ZIP codes in the top decile of the metro area in terms of population density, based on Census data.
This material is a product of JPMorgan Chase Institute and is provided to you solely for general information purposes. Unless otherwise specifically stated, any views or opinions expressed herein are solely those of the authors listed and may differ from the views and opinions expressed by J.P. Morgan Securities LLC (JPMS) Research Department or other departments or divisions of JPMorgan Chase & Co. or its affiliates. This material is not a product of the Research Department of JPMS. Information has been obtained from sources believed to be reliable, but JPMorgan Chase & Co. or its affiliates and/or subsidiaries (collectively J.P. Morgan) do not warrant its completeness or accuracy. Opinions and estimates constitute our judgment as of the date of this material and are subject to change without notice. No representation or warranty should be made with regard to any computations, graphs, tables, diagrams or commentary in this material, which is provided for illustration/reference purposes only. The data relied on for this report are based on past transactions and may not be indicative of future results. J.P. Morgan assumes no duty to update any information in this material in the event that such information changes. The opinion herein should not be construed as an individual recommendation for any particular client and is not intended as advice or recommendations of particular securities, financial instruments, or strategies for a particular client. This material does not constitute a solicitation or offer in any jurisdiction where such a solicitation is unlawful.
Authors

Chris Wheat
President, JPMorganChase Institute

George Eckerd
Wealth and Markets Research Director, JPMorganChase Institute