

Figure 1: In May 2025, bank balances were up 23 percent relative to 2019 balances, which is less than historical growth trends over a six-year period.

Creating thriving communities together
See how our clients and partners—from small business owners to workforce training leaders—work with JPMorganChase to drive meaningful impact and economic growth where they live and work.
Learn moreLatest news

Veteran’s Unconventional Path to Landing her Dream Job in Tech
U.S. Army Veteran Ashley Wigfall transitioned to a civilian role and charted her path to technologist through mentorship and skills training at the JPMorgan Chase tech hub in Plano, Texas.
Learn moreThe JPMorganChase Institute’s latest Household Finance Pulse examines how U.S. households are managing cash in 2025 and offers a detailed view into consumer finances in today’s economic environment, drawing on de-identified data from 4.7 million Chase households. The key takeaway is that, while balances in checking and savings accounts are lower than expected, total cash reserves may actually be in better shape than they first appear.
With interest rates still elevated and continuing questions about consumer resilience, this report offers helpful insight into how households are navigating the current economy.
Amid growing uncertainty in the economy, understanding how households are managing their cash is one of the clearest ways to assess their financial health.
During the pandemic, a combination of government relief efforts and limited spending opportunities helped households build more cash in their checking and savings accounts than ever before.1 But as government supports ended and normal economic activity resumed, those balances began to fall. At the same time, inflation soared and further eroded the real value of balances. The Institute has been closely tracking the rise and fall of bank balances in our ongoing Household Finances Pulse series, with our most recent release showing that in 2023 bank balances had returned to normal levels compared to historical trends but then continued to decline.
Is it concerning that bank balances are below what pre-pandemic trends suggest is normal? Unusually low bank balances could be a sign of current or future financial vulnerability. But they could also be a result of households investing more, seeking higher returns from elevated interest rates in other kinds of accounts.
To answer that question, we expanded our measure of cash reserves to include estimates of balances in other liquid accounts like brokerages and money market accounts. Using de-identified administrative banking data for 4.7 million households that bank with Chase, we measure not only bank account balances but the running total of transfers to investment and other accounts to approximate total cash reserves.2,3 We find that while inflation-adjusted balances in checking and savings accounts remain low with a flat growth trajectory, total cash reserves have likely been rising since mid-2024 and are approaching historical growth trends.4
During the pandemic, balance growth dramatically outpaced historical trends and households accrued large cash balances. To understand whether households have maintained unusually high balances or have resumed pre-pandemic behavior, we compare balances to historical trends which households presumably would have followed absent disruptions from the pandemic. The latest data show that households’ bank balances are currently below what we would have expected based on historical trends.
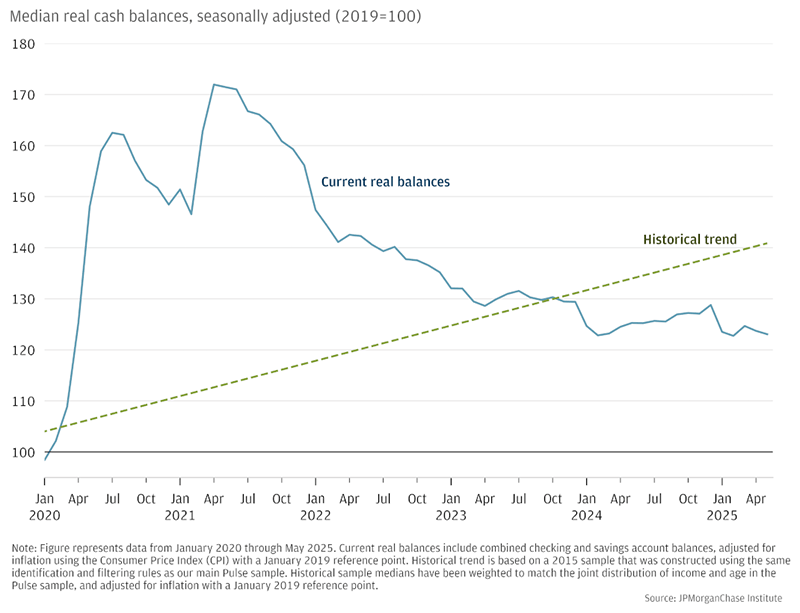
Figure 1 shows this by tracking relative balance growth: the change in seasonally-adjusted monthly median real bank balances—checking and savings accounts—indexed to the median bank balance in 2019. As households age, their incomes tend to increase and they tend to spend and save more, resulting in higher cash balances over time. In historical data, household bank balances have an annual growth rate of 6.9 percent.5 We observe much higher than usual balance growth during the pandemic and its associated policy responses, with balances peaking after the last round of EIP checks were deposited in March 2021, and declining through 2023. The rate of decline slowed over time, flattening in 2024, and median bank balances were up 23 percent in May 2025. This is lower than the 40 percent we would have expected based on typical balance growth over a six-year period.
Figure 1: In May 2025, bank balances were up 23 percent relative to 2019 balances, which is less than historical growth trends over a six-year period.
The above trends are based only on checking and savings account balances, which raises the question: what do growth rates look like for total cash reserves across the full set of a household’s liquid accounts? High interest rates in recent years may have prompted households to keep less cash in their checking and savings accounts and more in accounts that yield higher returns. That would show up in our data as declining checking and savings account balances, impacting the results in Figure 1. Indeed, the use of investment brokerage accounts has increased notably in recent years, with households across the income distribution increasing engagement with investment accounts. The number of individuals making investing transfers increased in 2020 and remained at or above that elevated level going forward (Wheat and Eckerd, 2024). With households transferring more money out of checking and savings accounts and into investments, CDs, and money market accounts, the declines in bank balances documented above may create an overly pessimistic picture of recent trends. Total cash reserves may be on an increasing trajectory even while checking and savings account balances continue to decrease.
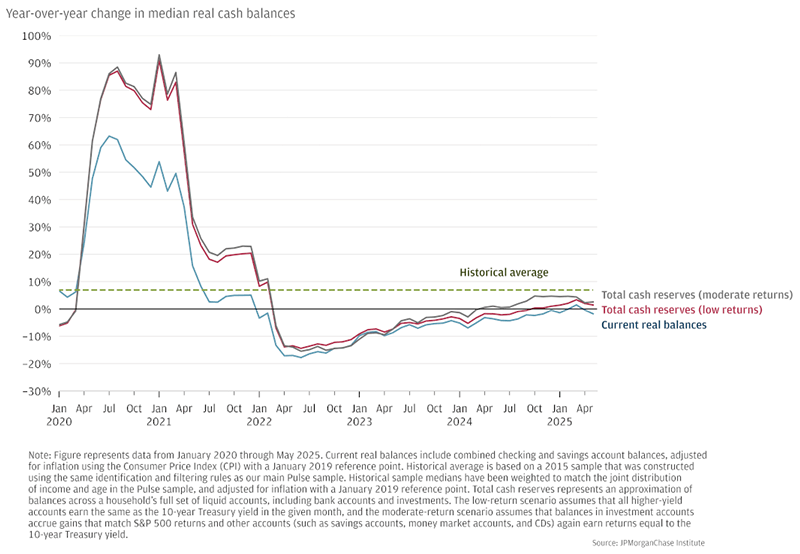
While we cannot directly observe total cash reserves, we approximate balances across a household’s full set of liquid accounts by tallying observed transfers out of checking and savings accounts. We account for potential returns to those additional accounts via two scenarios: a conservative low-return scenario where all higher-yield accounts earn the same as the 10-year Treasury yield in the given month, and a moderate-return scenario where balances in investment accounts accrue gains that match S&P 500 returns and other accounts (such as savings accounts, money-market accounts, and CDs) again earn returns equal to the 10-year Treasury yield.7
Figure 2 shows year-over-year change in median monthly balance for bank balances and total cash reserves. By May 2025, bank balances had stopped declining year-over-year, but had not yet returned to the positive growth that we would expect based on historical trends. Total cash reserves, on the other hand, had returned to positive growth by May 2025. As noted above, households tend to steadily increase cash savings in their bank accounts over time, with monthly median balances typically elevated around 7 percent over the prior year. Trends for both bank balances and total cash reserves have been outside of that norm in recent years. Year-over-year balance growth was very high during 2020 and early 2021 due to pandemic-era government supports, but turned negative in 2022 as households spent down their elevated cash balances. From 2022 through 2023, year-over-year balance changes were negative but on an upward trajectory, as decreases slowed.
By the end of 2024, bank balances had reached parity with the prior year, and growth remained roughly zero or slightly negative through May 2025. However, we begin to see positive growth when we look at total cash reserves. Under the moderate-return scenario, growth became positive in April 2024 and reached a rate of 5 percent in early 2025, with growth around 3 percent in May. The low-return scenario has slightly lower growth of 1.4 percent in May 2025. Given these results, declining trends in checking and savings account balances may be due to households moving cash out of checking and savings accounts in favor of other types of accounts. Our approximation of total household cash reserves suggests that households may have returned to positive cash balance growth much earlier than checking and savings balances alone would suggest.
Figure 2: Year-over-year bank balance growth remains roughly zero in early 2025, lagging expected growth of around 7 percent based on historical data.
Are these balance trends universal, or do some types of households differ in balance trajectories? While balance levels differ by income, we also observe different trends in balance growth by income8: low-income households returned to positive year-over-year growth last year, while checking and savings account balances are still declining slightly for high-income households. Figure 3 shows year-over-year balance growth by income quartile (see the Appendix for balance levels and relative balance growth by income quartile). Across income quartiles, balance growth is very high during 2020 and early 2021, turning negative by 2022 as households depleted their elevated cash reserves. From 2022 through 2024, balance changes were negative but on a steep upward trajectory for low-income households, with high-income households following a much flatter trajectory during that period. Since September 2024, households in the lowest income quartile have had annual bank balance growth of 1 to 3 percent, dipping back to zero growth in May 2025. In contrast, high-income households’ bank balances continue to decline, though at a slowing rate: only 3 percent negative in May 2025.
Figure 3: Year-over-year bank balance growth was 1 to 3 percent for low-income households in early 2025, compared with continuing declines of 3 percent year-over-year for high-income households.
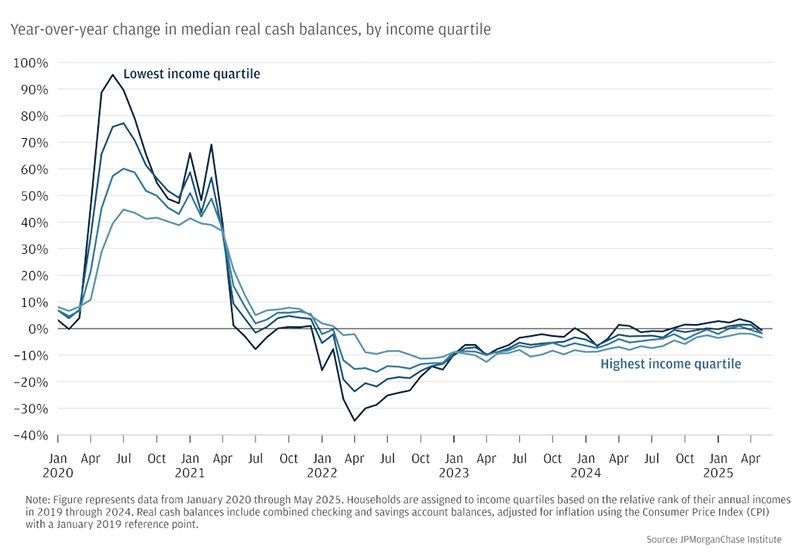
Figure 4 shows that total cash reserve growth has been positive for most income groups for at least the last year, following a different pattern than bank account balance growth. Under both return scenarios, households in all income groups have returned to positive year-over-year growth of total cash reserves. Households in the lowest income quartile have had positive cash reserve growth since March 2024, with 5 percent growth in 2025 under the low-return scenario and 6 percent growth under the moderate-return scenario. Total cash reserve growth remained negative longer for households in the highest income quartile, particularly for the low-return scenario where growth remained negative through January 2025, becoming positive in February with 1 to 2 percent growth through May 2025. Under the moderate-return scenario, total cash reserve growth for high-income households has been positive since March 2024, with 4 percent growth in 2025. Overall, total cash reserves are on the rise once we account for cash held outside of the household’s checking and savings accounts, indicating that continued draw-down of checking and savings account balances may be due to households reallocating cash into other types of accounts.
Figure 4: Total cash reserve growth has been positive for most income groups for at least the last year.
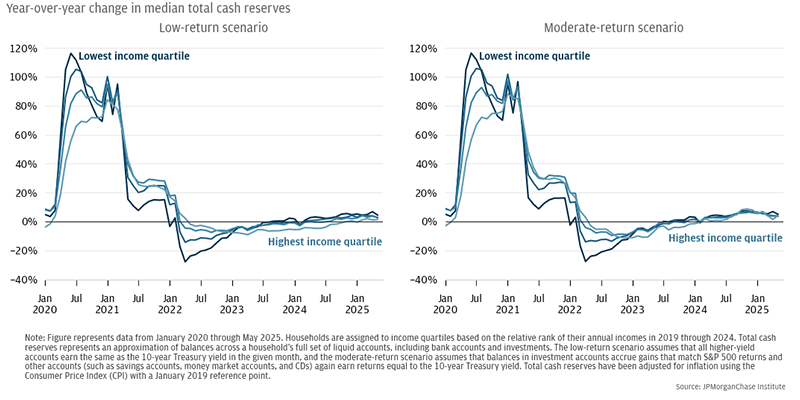
Figure A1: Monthly bank balances continue to decline for high-income households.
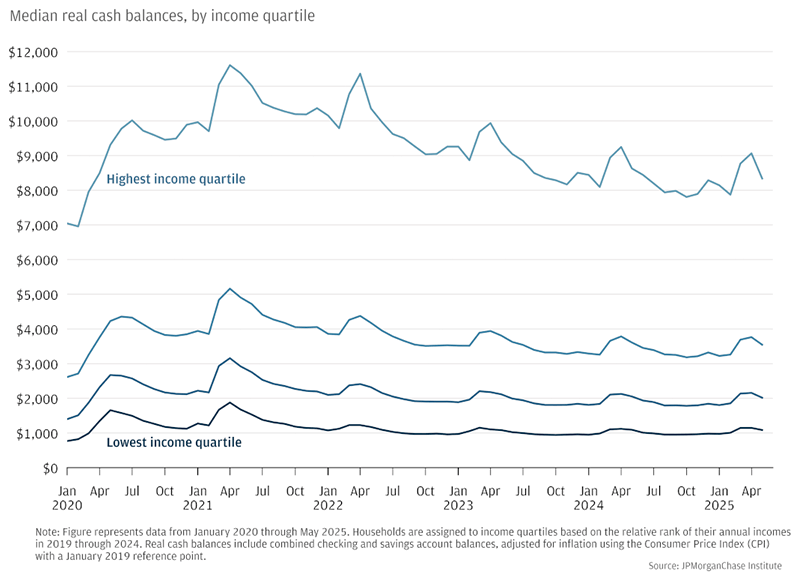
Figure A2: For low-income households, median balances were up 23 percent in May 2025 relative to 2019, and high-income households were up 16 percent.
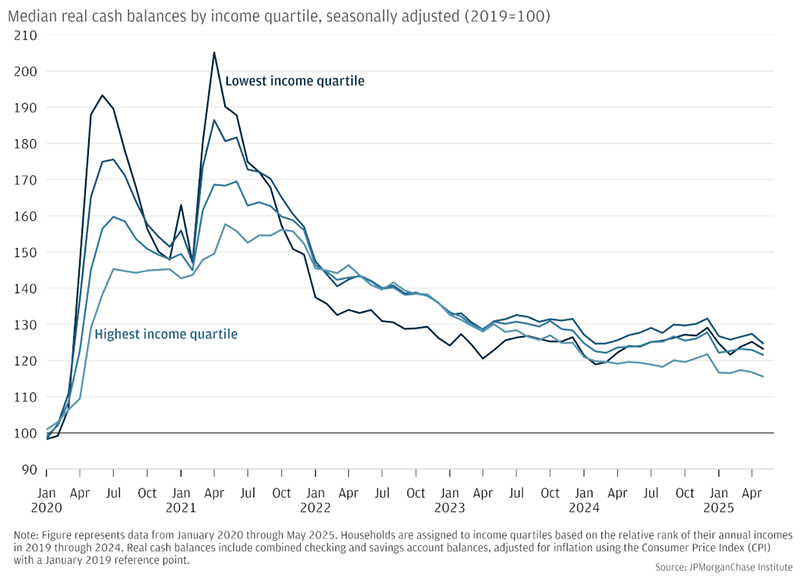
Figure A3: For all race groups, monthly bank balances were relatively steady in recent months, aside from typical seasonal trends.
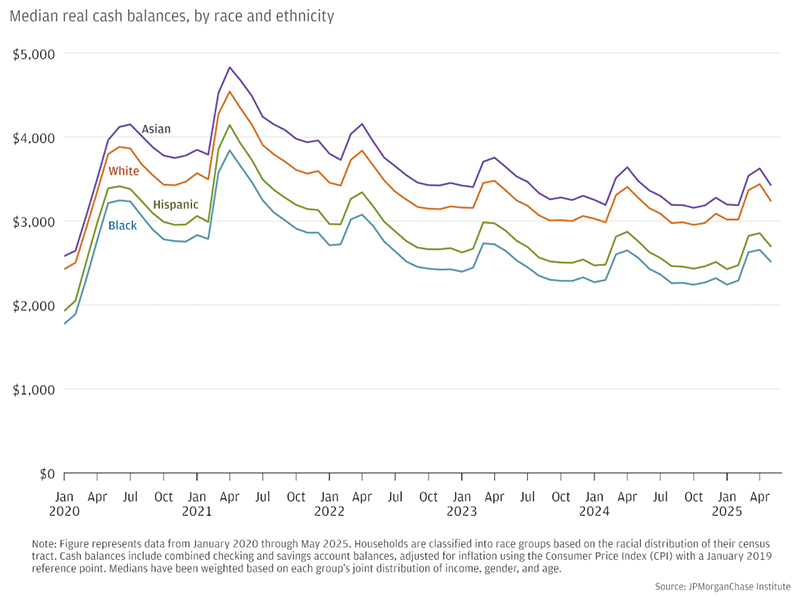
Figure A4: Year-over-year bank balance growth was around zero for all race groups in early 2025.
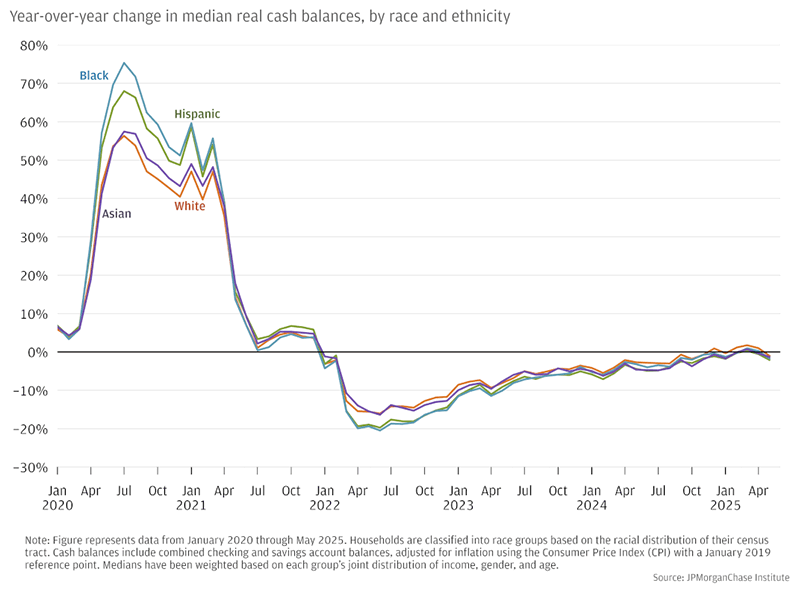
Figure A5: On a relative basis, median real balances diverged from nominal balances in the spring of 2021, widening the gap from 2022 onward.
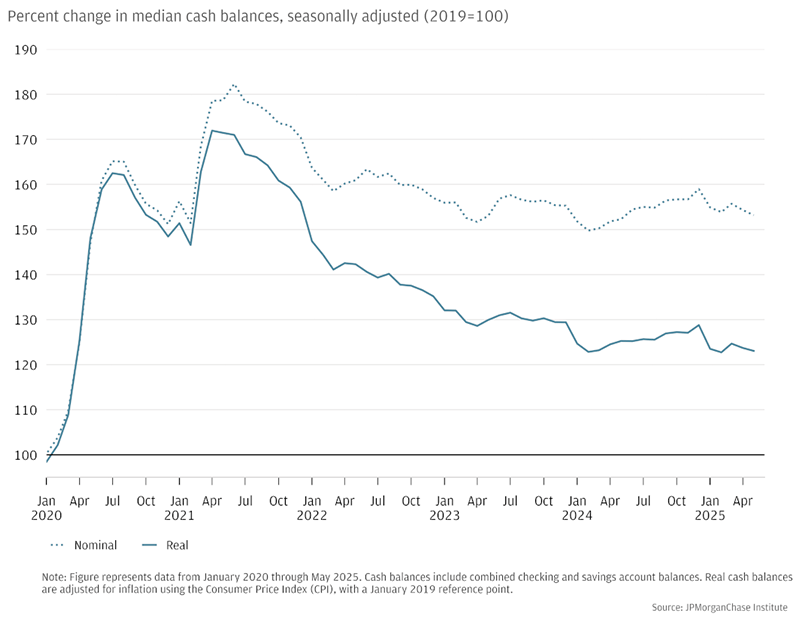
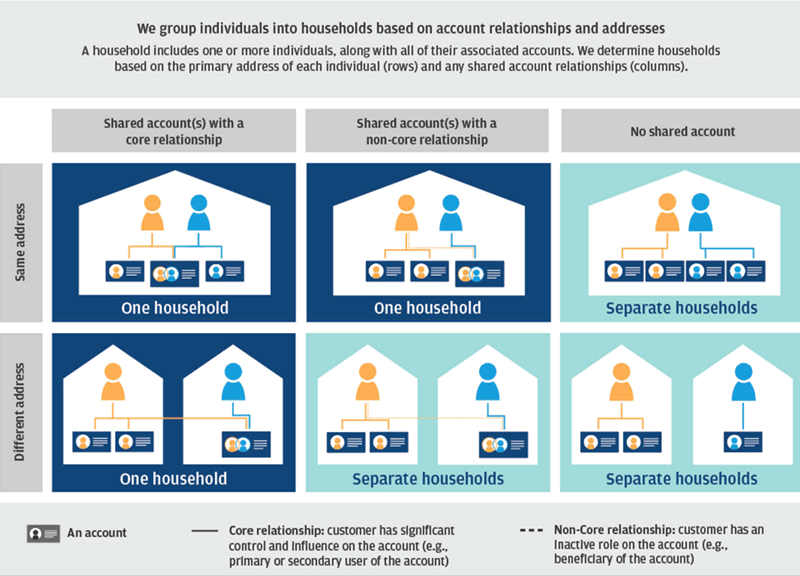
Figure A6: Our household unit of analysis groups people into households based on shared account relationships, enabling analysis across all Chase accounts in the household.
We thank our research team, specifically Peichen Li, for their hard work and contribution to this research. Additionally, we thank Alfonso Zenteno and Oscar Cruz for their support. We are indebted to our internal partners and colleagues, who support delivery of our agenda in a myriad of ways and acknowledge their contributions to each and all releases.
We are also grateful for the invaluable constructive feedback we received from external experts and partners. We are deeply grateful for their generosity of time, insight, and support.
We would like to acknowledge Jamie Dimon, CEO of JPMorgan Chase & Co., for his vision and leadership in establishing the Institute and enabling the ongoing research agenda. We remain deeply grateful to Peter Scher, Vice Chairman, Tim Berry, Head of Corporate Responsibility, Heather Higginbottom, Head of Research & Policy, and others across the firm for the resources and support to pioneer a new approach to contribute to global economic analysis and insight.
This material is a product of JPMorganChase Institute and is provided to you solely for general information purposes. Unless otherwise specifically stated, any views or opinions expressed herein are solely those of the authors listed and may differ from the views and opinions expressed by J.P. Morgan Securities LLC (JPMS) Research Department or other departments or divisions of JPMorgan Chase & Co. or its affiliates. This material is not a product of the Research Department of JPMS. Information has been obtained from sources believed to be reliable, but JPMorgan Chase & Co. or its affiliates and/or subsidiaries (collectively J.P. Morgan) do not warrant its completeness or accuracy. Opinions and estimates constitute our judgment as of the date of this material and are subject to change without notice. No representation or warranty should be made with regard to any computations, graphs, tables, diagrams or commentary in this material, which is provided for illustration/reference purposes only. The data relied on for this report are based on past transactions and may not be indicative of future results. J.P. Morgan assumes no duty to update any information in this material in the event that such information changes. The opinion herein should not be construed as an individual recommendation for any particular client and is not intended as advice or recommendations of particular securities, financial instruments, or strategies for a particular client. This material does not constitute a solicitation or offer in any jurisdiction where such a solicitation is unlawful.
Wheat, Chris, Erica Deadman, Daniel M. Sullivan. 2025. “Household Finances Pulse through May 2025: Bank balances are flat but total savings are growing again.” JPMorganChase Institute. https://www.jpmorganchase.com/institute/all-topics/financial-health-wealth-creation/household-finances-pulse-through-may-2025
Wheat, Chris, and George Eckerd. 2024. “The Rise in Retail Investing: Roles of the Economic Cycle and Income Growth.” JPMorgan Chase Institute. https://www.jpmorganchase.com/institute/all-topics/financial-health-wealth-creation/the-rise-in-retail-investing-roles-of-the-economic-cycle-and-income-growth
During the pandemic, the federal government provided cash assistance and relief to households through a range of fiscal interventions. Three rounds of stimulus, or Economic Impact Payments (EIP), provided cash benefits to households earning below specified income thresholds, with payments landing in April 2020, January 2021, and March 2021. Throughout this time, expanded unemployment insurance delivered payments to jobless workers, including gig workers and self-employed workers, with weekly supplements to typical benefits which were phased out in 2021. Finally, the American Rescue Plan increased the dollar amount of Child Tax Credit (CTC) payments and disbursed half of the credit via monthly advance payments from July through December 2021.
https://home.treasury.gov/policy-issues/coronavirus/assistance-for-american-families-and-workers/economic-impact-payments
https://tcf.org/content/report/7-5-million-workers-face-devastating-unemployment-benefits-cliff-labor-day/
https://home.treasury.gov/policy-issues/coronavirus/assistance-for-american-families-and-workers/child-tax-credit/
Our Household Finances Pulse data asset covers 4.7 million households that had active checking account users between January 2019 and May 2025 and had at least $12,000 in annual adjusted income—non-transfer inflows into the checking accounts, minus Economic Impact Payments (EIP) and Unemployment Insurance (UI)—deposited to their Chase checking accounts every year in 2019 through 2024.
This report utilizes our household unit of analysis. Data limitations prevent us from creating households that match the Census definition of “all the people who occupy a housing unit (such as a house or apartment) as their usual place of residence.” Instead, we group individuals into households based on shared account relationships. This means that our households do not include minor children or extended family members that live together but don’t share finances. When analyzing household finances, we consider all accounts associated with any individual in the household. See Figure A6 for additional information on how we group people into households.
To address inflation and an associated decrease in the purchasing power of households’ cash reserves, we report real cash balances rather than nominal cash balances. We compute real cash balances by deflating nominal cash balances by the Consumer Price Index (CPI), with January 2019 as our reference point. See Figure A5 for a comparison of nominal and real balances.
https://fred.stlouisfed.org/series/CPIAUCSL
We constructed a 2015 historical sample using the same filters as our main Pulse sample to ensure the households in the sample use their Chase accounts as primary vehicles for managing their finances (reference End Note 2). The historical comparison sample covers January 2015 through February 2020. Median bank balances in this sample have a 6.9 percent annual growth rate. To account for differences in sample composition, medians in the 2015 sample were weighted based on the joint distribution of income and age in the main Pulse sample.
We do not directly observe the balances in external investment and savings accounts, and our total cash reserve metric is a conservative approximation that represents the likely lower-bound of possible external cash reserves. Because investment balances are constructed by summing transfers out of the household’s checking and savings accounts, each household begins with $0 balances at the start of our sample in January 2019. We accumulate transfer cashflows and measure increases and decreases going forward. But some households would have had substantial starting balances that we are unable to capture, so our total cash reserve metric represents a lower-bound of possible unobserved balances, indicative of increasing trends in cash reserves held in investments, but not accurate to the levels of cash held in those accounts.
Treasury yield data: https://fred.stlouisfed.org/series/DGS10
S&P 500 return data: https://fred.stlouisfed.org/series/SP500
Note that we approximate S&P 500 returns only from capital gains and not dividends, which will slightly underestimate true returns.
Our income quartiles are based on adjusted income, which is all checking account inflows minus transfers, Economic Impact Payments (EIP), and Unemployment Insurance (UI). We remove these income sources since they do not represent long-term income. We then establish quartiles using adjusted income from all complete calendar years in our sample, 2019 through 2024: within each year, we determine a household’s relative income rank among all households in our sample, and then take the average of the household’s adjusted income rank across all years. This average rank is used to determine final income quartiles.

Chris Wheat
President, JPMorganChase Institute

Erica Deadman
Consumer Research Lead, JPMorganChase Institute

Daniel M. Sullivan
Consumer Research Director, JPMorganChase Institute