We celebrated the launch of the JPMorgan Nasdaq Hedged Equity Laddered Overlay ETF in April.

2025 ANNUAL REPORT
Asset & Wealth Management
Mary Callahan Erdoes, Letter to Shareholders
April 6, 2026
Latest news

An Ohio-based company is protecting first responders around the world
With support from JPMorganChase, Fire-Dex is providing protective equipment to firefighters in 100 countries and all 50 states.
Learn moreLatest news

Veteran’s Unconventional Path to Landing her Dream Job in Tech
U.S. Army Veteran Ashley Wigfall transitioned to a civilian role and charted her path to technologist through mentorship and skills training at the JPMorgan Chase tech hub in Plano, Texas.
Learn more
2025 ANNUAL REPORT
Mary Callahan Erdoes, Letter to Shareholders
April 6, 2026
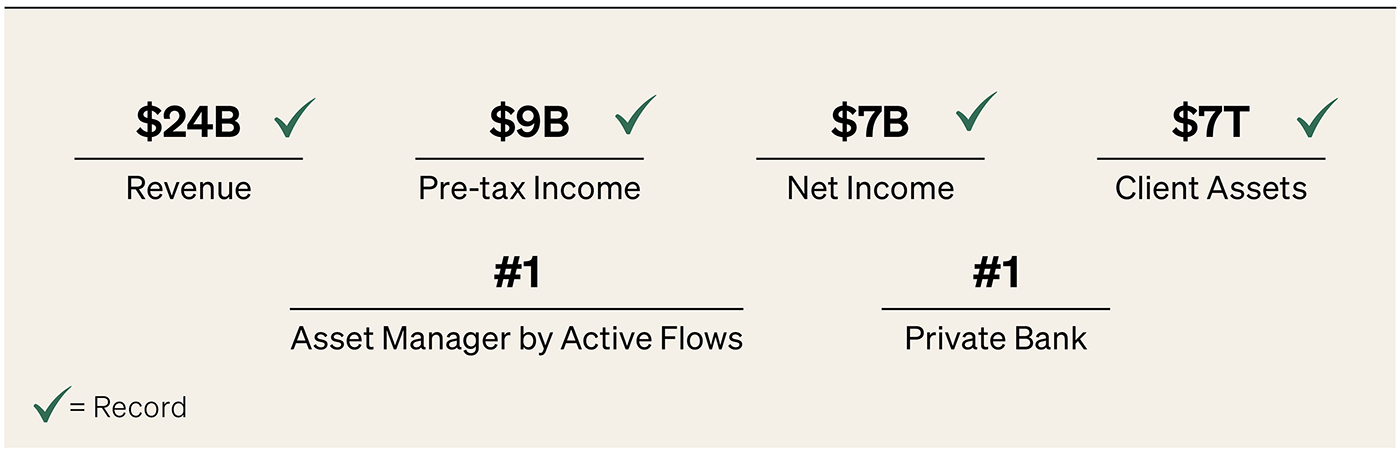
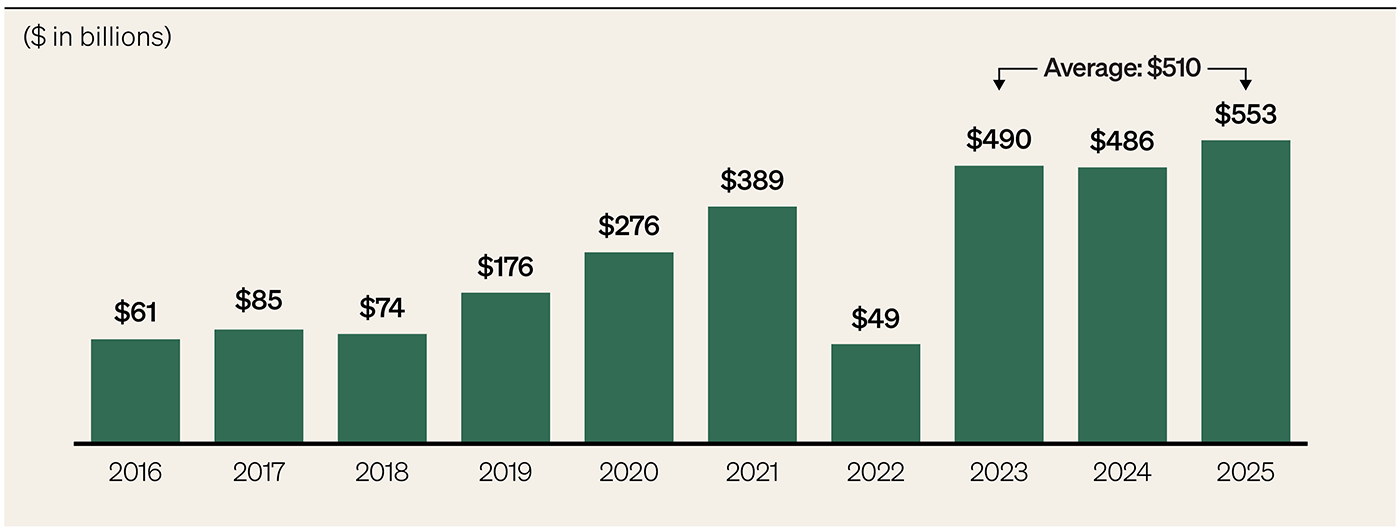
Our clients continue to vote with their flows, driving record total client asset flows of $553 billion — our 22nd consecutive year of positive net new inflows — record client assets of $7 trillion and record revenue for the ninth consecutive year at $24 billion. Total client asset flows exceeded $1 trillion over the last two years; that amount by itself would rank among the top 30 asset managers.
Over the 10-year period ending in 2025, the S&P 500 outperformed the MSCI All Country World Index by more than 6,000 basis points1. With results that are so lopsided, it is easy to lose sight of investment opportunities beyond American shores. At J.P. Morgan Asset & Wealth Management (AWM), we never lost our global perspective. For nearly two centuries, we have managed globally diversified portfolios and delivered insights for the world’s leading institutions and families.
In 2025, markets were jolted by surprise tariffs, a weaker dollar and surging gold prices. Debate intensified around central bank independence. An artificial intelligence (AI) arms race escalated among the world’s largest companies, even as real competition for strategic materials and technologies emerged among nation states. Through this volatility, our investors, advisors, technologists and support staff delivered exceptional results for clients and record outcomes for shareholders — while we continued to invest heavily in the franchise, particularly in technology and AI-driven productivity that sharpens research, strengthens advice and delivers efficiency.
Client Asset Flows
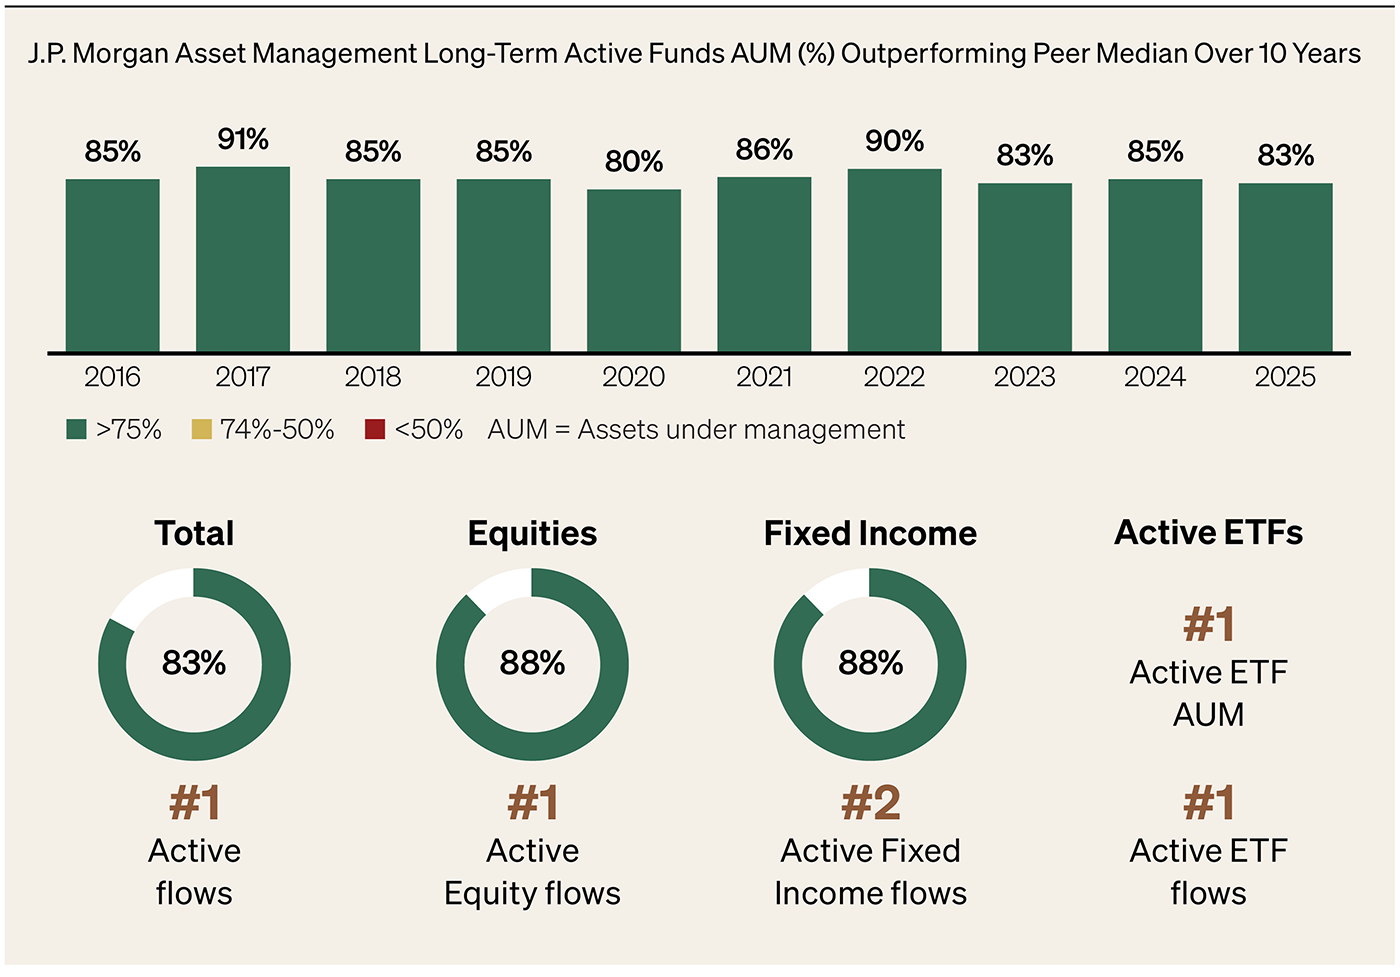
First and foremost, we are active managers. For the past decade, more than 80% of our long-term active funds assets under management (AUM) have been above peer median2, driven by on-the-ground research, robust risk management and disciplined portfolio construction. In 2025, our research analysts covered over 5,000 companies, held more than 15,000 meetings and analyzed more than 1 billion data points daily. We monitor roughly 7,600 strategies with cross-asset governance and invest over $500 million annually in research — scale and substance that fueled outcomes in 2025. Our platform includes:
Looking to the future, active exchange-traded funds (ETF) are a core growth engine. We moved early to launch innovative strategies; today, we are #1 in active ETF AUM ($250 billion in 2025)3 and #1 in active ETF flows ($65 billion in 2025)3, with momentum across the United States and international platforms. Three of the five largest active ETFs globally are ours3, and we executed the largest active ETF launch on record, the J.P. Morgan Active High Yield ETF (JPHY)4 — positioning us to capture a market that is projected to grow from approximately $2 trillion in 2025 to above $6 trillion by 20305, outpacing active mutual funds’ growth rate over that five-year period.
We celebrated the launch of the JPMorgan Nasdaq Hedged Equity Laddered Overlay ETF in April.
We do not believe that any fiduciary manager should dictate choice or preferences, which is why personalization and tax optimization at scale are differentiators of our active platform. Our separately managed account (SMA) infrastructure, combined with 55ip and OpenInvest, enables tax-smart transitions, systematic harvesting and preference-aligned portfolios. We are the #2 SMA provider6, with $434 billion managed on behalf of SMA investors and approximately double the number of accounts since 2021 — giving clients meaningfully better after-tax outcomes without compromising active conviction.
We continue to expand access to alternatives across real estate, private equity, infrastructure, credit and hedge funds through our direct investment capabilities and a broad third-party platform. By the end of 2025, alternatives assets under supervision reached $560 billion (up from $284 billion in 2020)7, and we are one of the industry’s largest distributors to wealth clients and institutions globally.
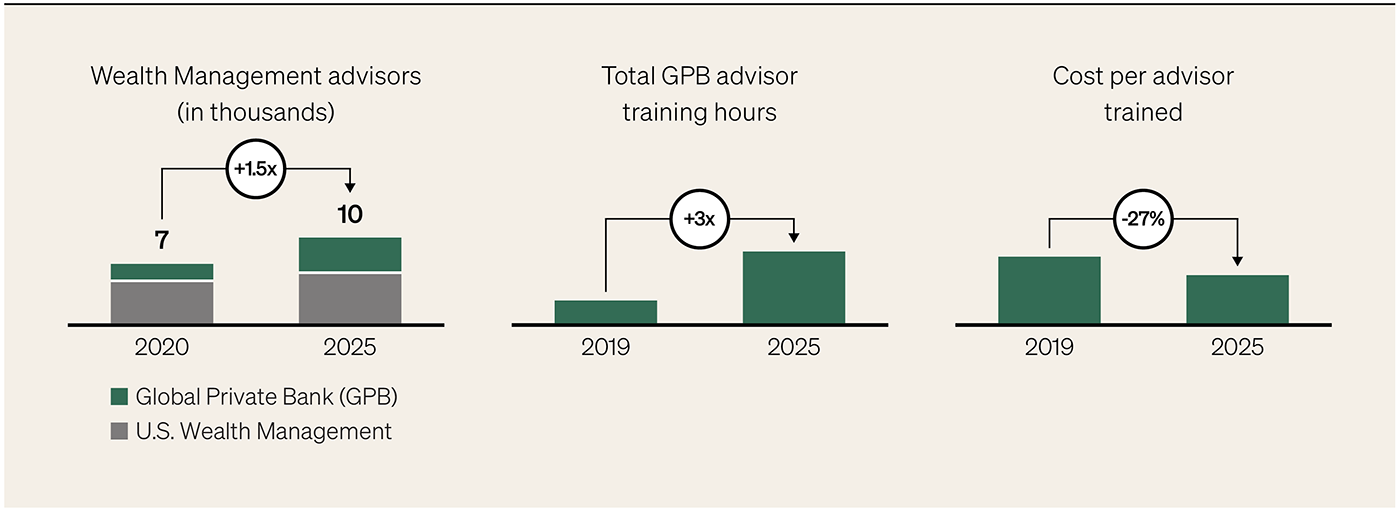
We believe we operate the only private bank in the industry with a uniform business model globally, enabling consistent advice, governance and product delivery worldwide, as recognized by Global Finance magazine, which named us the #1 Private Bank in the World8. We are the largest U.S. bank in the high-net-worth-plus segment internationally — growing at double-digit rates where we already lead and have substantial runway in markets where our current share is below 1%9 — and are supported by significant and sustained investment in talent and platform capabilities.
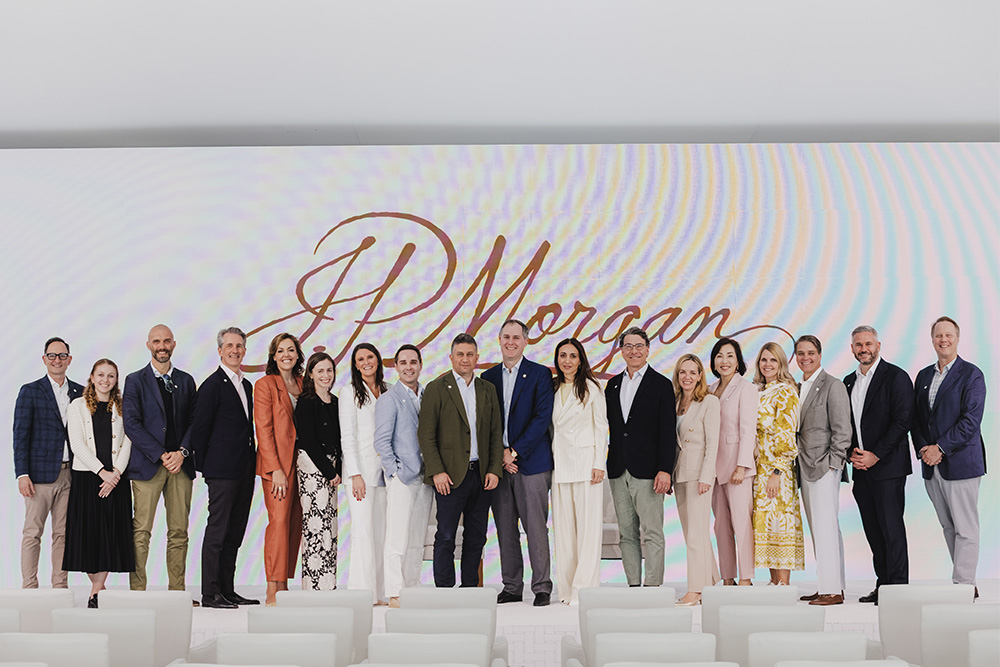
Our Steering Committee for the J.P. Morgan Advisors Exchange, an annual Global Private Bank event for our family office clients, is shown above.
This combination — world-class advisors, scaled training, fortress balance sheet and cross line-of-business connectivity — is why over 95% of our top 50 AWM clients also work with our other lines of business and why our ecosystem consistently deepens relationships and outcomes for clients.
Advisor Hiring
Workplace
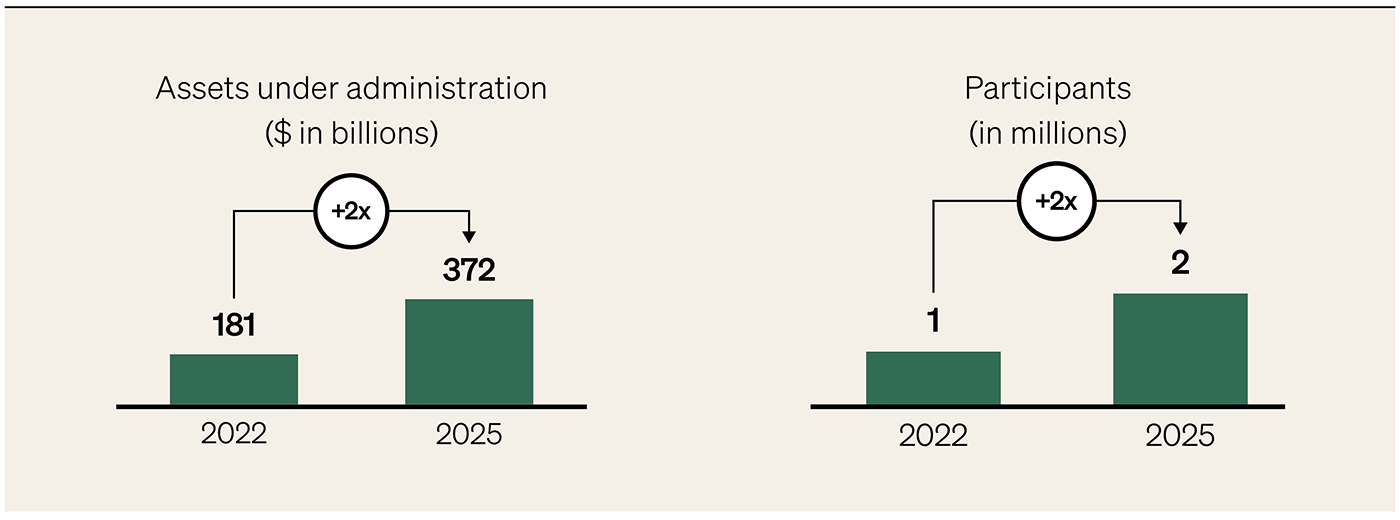
We invest through the cycle to improve performance, strengthen advice and achieve operational excellence — relentlessly driving out inefficiency so every dollar of investment translates into better outcomes for clients and shareholders. In 2025, we increased investment across active management, ETFs, alternatives, our Workplace platform, GPB advisors, personalization and AI — while maintaining discipline on overall headcount growth and efficiency.
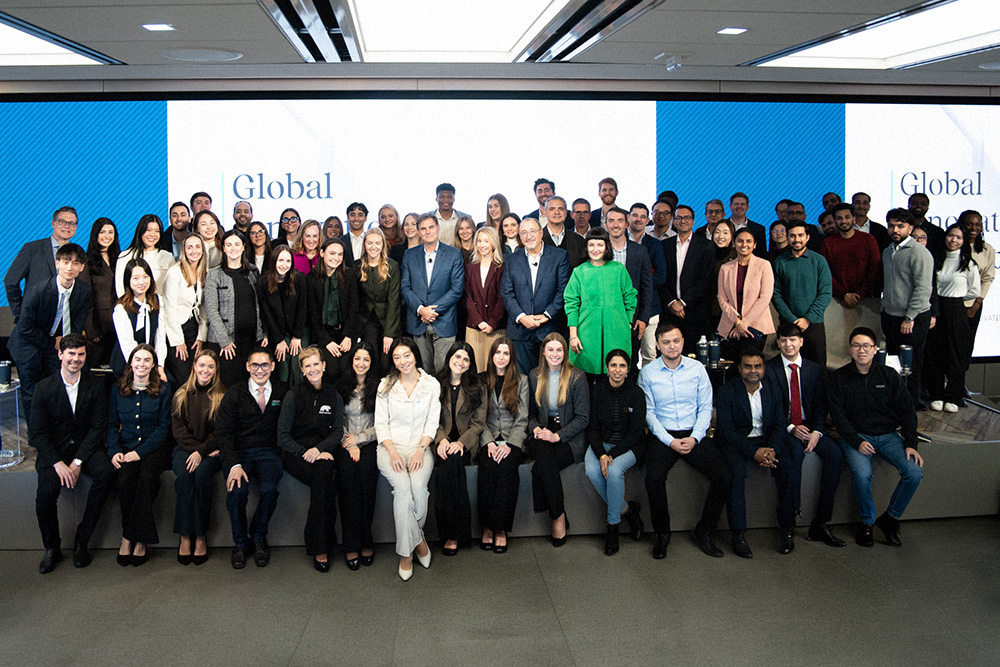
Our NextGen employee participants at our Global Innovation Summit presented technological solutions they created to improve the client and advisor experience.
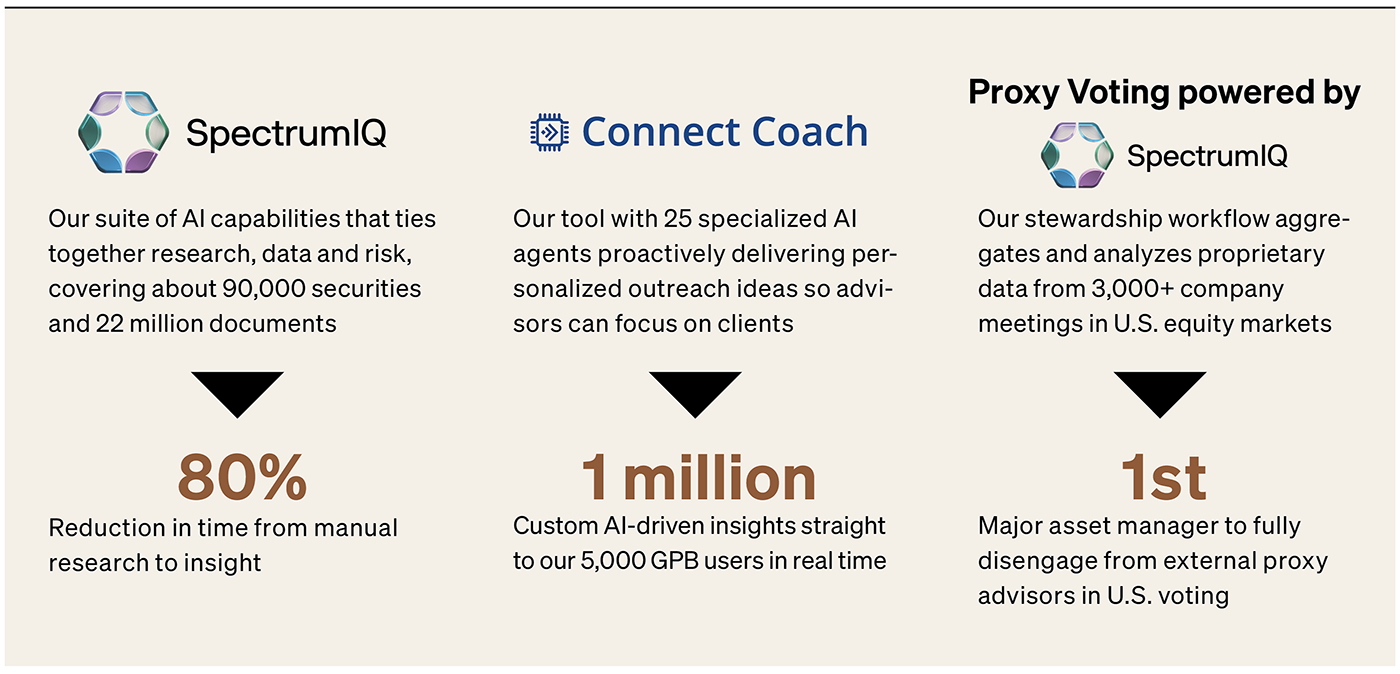
There are three AI investment examples I would like to highlight:
We have made significant investments in our tools and resources, many of which have been developed and enhanced by our employees. Their creativity and ingenuity have driven innovative solutions that directly benefit our clients. We have also heavily invested in our teams that provide seamless, around-the-clock support to clients, ensuring exceptional service and responsiveness at all times.
AI Use Case Examples
In 2025, we were recognized as the #1 Asset Manager by active flows13 and the #1 Private Bank in the World8, reflecting the strength of our investment engine and advice platform. Our clients continue to vote with their flows, driving record total client asset flows of $553 billion — our 22nd consecutive year of positive net new inflows — record client assets of $7 trillion and record revenue for the ninth consecutive year at $24 billion14. Total client asset flows exceeded $1 trillion over the last two years; that amount by itself would rank among the top 30 asset managers15. Culminating a year of strong execution, we delivered a 40% return on equity in the 2025 fiscal year (up from 34% in 2024), reflecting expense and capital discipline and highly selective headcount growth, with the latter primarily consisting of GPB advisors. These extraordinary results belong to our more than 29,000 AWM professionals across 48 countries who show up every day to earn our clients’ trust. I am especially grateful to my Operating Committee partners in AWM, whose leadership across our investment, advisory, technology and operations teams makes this performance possible — and whose unwavering ambition for what comes next continues to raise the bar.
Thank you for your trust in us. Our North Star has never changed: to be the best in the industry for our clients, not the biggest — and our fiduciary commitment to deliver investment performance remains the way we prove it every day. We will keep investing in our people, research and platforms; extend leadership in active management and active ETFs; expand our leading global private bank; broaden access to alternatives and personalization; and embed AI across the franchise to elevate advice and outcomes — leveraging the unparalleled strength of JPMorganChase for our clients and shareholders.
Bloomberg.
Percentage of long-term active mutual fund and active exchange-traded funds (“ETF”) assets under management (“AUM”) in funds ranked in the 1st or 2nd quartile: All quartile rankings, the assigned peer categories and the asset values used to derive these rankings are sourced from the fund rating providers. Quartile rankings are based on the net-of-fee absolute return of each fund. Where applicable, the fund rating providers redenominate asset values into U.S. dollars. The percentage of AUM is based on fund performance and associated peer rankings at the share class level for U.S.-domiciled funds, at a primary share class level to represent the quartile ranking for U.K., Luxembourg and Hong Kong SAR funds, and at the fund level for all other funds. The performance data may have been different if all share classes had been included. Past performance is not indicative of future results. “Primary share class” means the C share class for European funds and ACC share class for Hong Kong SAR and Taiwan funds. If these share classes are not available, the oldest share class is used as the primary share class. Due to a methodology change effective September 30, 2023, prior results include all long-term mutual fund assets and exclude active ETF assets.
Bloomberg and FactSet as of December 31, 2025.
J.P. Morgan Asset Management, Bloomberg and Morningstar. U.S. Active ETF launches. Does not include mutual fund conversions (as of May 31, 2025).
Morningstar, J.P. Morgan estimates.
Cerulli 2025 US Managed Accounts Report.
JPM alternative assets includes private equity, private credit, real assets, hedge funds, liquid alternatives and other nontraditional assets which may be presented using net asset value (NAV) of investments. In quarterly filings, assets are predominantly presented using NAV and certain of these assets are reflected in other asset classes or categories comprising total Client Assets.
Global Finance magazine 2025.
Company filings, J.P. Morgan estimates.
In the fourth quarter of 2020, the Firm realigned certain wealth management clients from Asset & Wealth Management to Consumer & Community Banking. Prior-period amounts have been revised to conform with the current presentation.
iMoneyNet.
Wall Street Journal.
Public filings, Morningstar, J.P. Morgan estimates.
In the fourth quarter of 2020, the Firm realigned certain Wealth Management clients from Asset & Wealth Management to Consumer & Community Banking. Prior-period amounts have been revised to conform with the current presentation. Historical revenue revised as a result of the adoption of the new accounting guidance for revenue recognition, effective January 1, 2018.
Company filings and websites, J.P. Morgan estimates.

Jamie Dimon
Chairman and Chief Executive Officer

Marianne Lake
CEO, Consumer & Community Banking

Troy Rohrbaugh and Douglas B. Petno
Co-CEOs, Commercial & Investment Bank
Mary Callahan Erdoes
CEO, Asset & Wealth Management

Tim Berry
Global Head, Corporate Responsibility

Jennifer Piepszak
Chief Operating Officer