

Figure 1: Spending growth online on general goods is stronger than offline spending, regardless of retailer type
Latest news

An Ohio-based company is protecting first responders around the world
With support from JPMorganChase, Fire-Dex is providing protective equipment to firefighters in 100 countries and all 50 states.
Learn moreLatest news

Veteran’s Unconventional Path to Landing her Dream Job in Tech
U.S. Army Veteran Ashley Wigfall transitioned to a civilian role and charted her path to technologist through mentorship and skills training at the JPMorgan Chase tech hub in Plano, Texas.
Learn more
Findings
Consumer retail activity changed drastically after the onset of the COVID-19 pandemic, in amounts of money spent, types of goods and services purchased (Wheat et al. 2021b), distances traveled (Farrell et al. 2020), use of online retail (Wheat et al. 2021a), or combinations of health risks and government restrictions faced (Wheat et al. 2021c). Less measured but of no less concern are potential shifts by consumers from smaller to larger retailers.[1]This may be important as either a cause or a consequence of how different types of retailers have fared since March 2020. Additionally, insights into consumer spending behavior can help inform how policymakers and business leaders think about the challenges facing different types of retailers in the near future.
We use the credit and debit card transactions of approximately 1.5 million people to describe consumer spending behavior across types of retailers (roughly corresponding to size) and purchasing channels (online and offline). We focus on purchases of general goods and groceries. While overall spending growth for these products is strong, we find that growth is not necessarily shared equally across different types of retailers. While the pandemic provoked a precipitous divergence in the share of spending captured by different types of retailers, spending shares across retailer type are returning to their pre-pandemic states. Importantly, we observe very different outcomes across product types, which suggests that firms, consumers, or neighborhoods may need supports tailored to specific sectors of the retail economy.
Our sample for this study is comprised of debit and credit card transactions from a sample of approximately 1.5 million Chase customers who lived in the New York-Newark, NY-NJ-CT-PA Core-Based Statistical Area between January 2019 and August 2021. In order for a person’s transactions to be included in our sample, the person must have:
Restricting our analysis to people who have regular activity during each month in our study period guards against presenting growth in Chase’s customer base as representative of the growth in spending of New Yorkers in general. While Chase customers cannot enter and exit the sample based on their activity, we allow for entry and exit based on location. Take, for example, someone who lived in the Manhattan ZIP code 10027 from January 2019 until February 2021, then moved outside of the city in March 2021 and did not return. From January 2019 until February 2021, their transactions would be included in the spending we measure. From March 2021 through August 2021 however, their transactions would not be included in our measures.
We focus on retailers selling two product types for this analysis: general goods and groceries. General goods retailers include department stores, discount stores, large online retailers selling a variety of goods, and other retailers like florists and bookstores that sell everyday goods. Grocery retailers include merchants who sell food to consume at home. This includes traditional grocery stores, bakeries, specialty food stores, and some online grocery delivery services.
The key distinction between retailers in this report is whether a retailer is categorized as a top retailer or not. Throughout this report, these two groups will be referred to as “top retailers” and “other retailers.” While there are many ways to measure firm size and market power, for the purposes of this report, we categorized firms based on rough measures of market share, establishment count, and geographic footprint.
We first identified the top 100 establishments by their share of the New York-Newark, NY-NJ-CT-PA Core-Based Statistical Area market for spending in a given year (2019, 2020, and 2021), through a given channel (online and offline), and for a given product (general goods and groceries). For example, in one iteration of this process, we identified the 100 establishments with the greatest market share for offline groceries in 2019. For each firm represented in this list, we then counted the number of establishments they list on their website and identified where these establishments are located. Last, we classified firms as top retailers or other retailers using the scheme in Table 1.[4] If a firm is not represented in the list of establishments with the highest market share, they are automatically classified as other retailers.
Combining our purchasing channel view with our view of retailer types allowed us to create four categories for New Yorkers’ spending: offline transactions occurring at top retailers (labeled Offline, Top Retailer in the figures below), offline transactions occurring at other retailers (Offline, Other Retailer), online transactions occurring at top retailers (Online, Top Retailer), and online transactions occurring at other retailers (Online, Other Retailer). These categories are the basis for this analysis.
Count of Establishments | Geographic | Retailer |
|---|---|---|
More than ten | Inside and outside the New York City CBSA | Top Retailer |
More than ten | Only inside the New York City CBSA | Top Retailer |
More than ten | Mix of establishments inside and outside the CBSA, with online services as well | Top Retailer |
Ten or fewer | Predominantly online, no locations except popups, offers service to areas inside and outside the CBSA | Top Retailer |
Ten or fewer | Only inside the New York City CBSA | Other Retailer |
Ten or fewer | Only inside the CBSA, though the firm may offer online services and shipping | Other Retailer |
Ten or fewer | Predominantly online, no locations except popups, only offers service to areas inside the CBSA | Other Retailer |
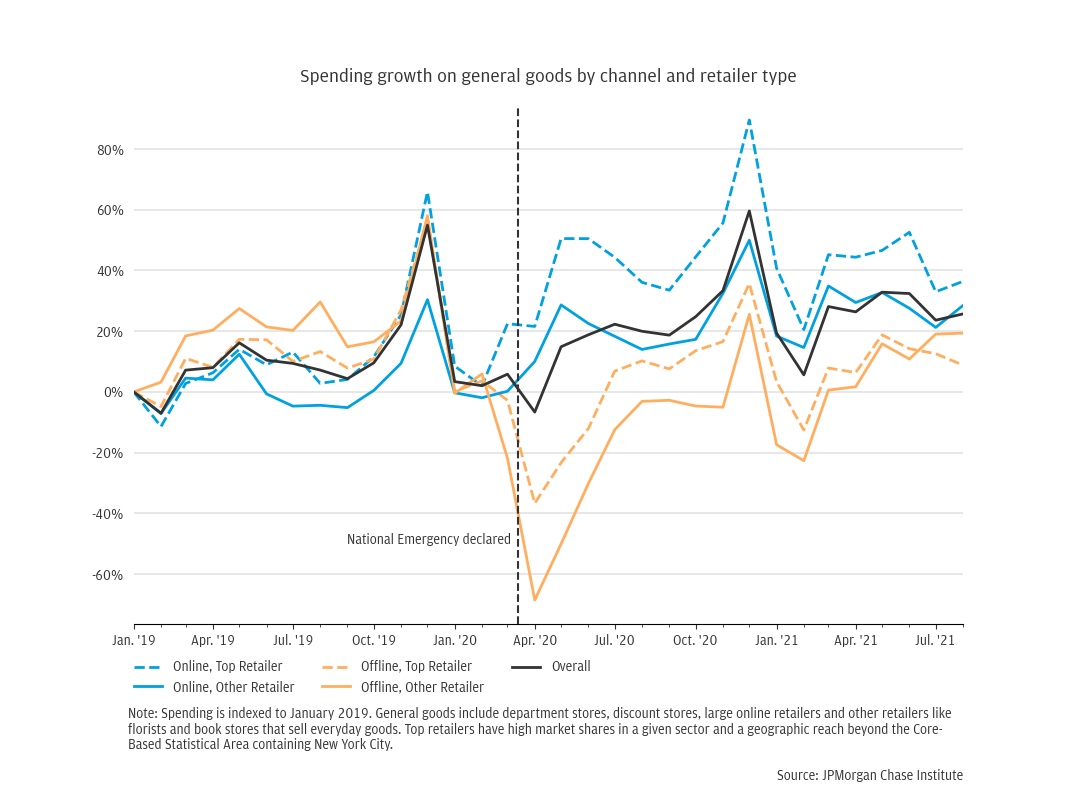
Overall spending growth remained positive throughout the pandemic, excepting the immediate shock in April 2020. Figure 1 shows spending levels from January 2019 through August 2021, indexed to spending levels in 2019. In April 2020, overall spending on general goods was 7 percent below what it was in January 2019. By August 2021 overall spending was 26 percent higher than it was in January 2019—a level of spending growth that was strong even relative to pre-pandemic levels. (Office of the New York State Comptroller 2022)
Figure 1: Spending growth online on general goods is stronger than offline spending, regardless of retailer type
While aggregate spending growth was generally strong over our observation period, spending varied substantially by product, retailer type, and channel. As our prior research demonstrates (Wheat et al. 2021a, 2021b, 2021c), spending growth on offline and online retail across a variety of products diverged in March 2020 and has settled into a new dynamic where online growth consistently outperforms offline growth. This pattern holds true for New Yorkers’ spending on general goods. Notably, this pattern holds across retailer types as well; online spending growth at other retailers is consistently higher than offline spending growth at top retailers.
An important nuance not presented in Figure 1 is that consumers can make both online and offline purchases from the same individual firm, [5] such that a firm could offset declining offline spending with online spending. Indeed, firms may even encourage this shift (the so-called “bricks and clicks” model). (Hortaçsu and Syverson 2015). This is important to remember because larger firms may have more resources to devote to developing and maintaining online services to complement their offline services. (Rodrigue 2020)
In addition to the growth of New Yorkers’ spending varying across our different categories, the relative amounts they spent in each category differed meaningfully throughout our study period. We find that New Yorkers shifted their spending towards online retailers and top retailers—and away from offline spending at other retailers—starting in March 2020. The starkest example of this is the drastic shift towards online spending at top retailers. However, these shifts reversed over the course of 2020 and 2021.
To measure how New Yorkers allocated their spending across our categories, we use a ratio of spending offline at other retailers to spending in each of the other three categories. This allows us to put a dollar value on the relative shares of each of these categories and roughly assess how consumers allocate spending, regardless of overall growth at a given time. For example, in Figure 2 we see that for every $1.00 New Yorkers spent offline at other retailers in January 2020, they spent $3.60 online at the top retailers. This figure rose to $12.76 for every $1.00 in April 2020 and fell to $3.77 for every $1.00 in August 2021. Alternatively, by August 2021 New Yorkers were spending relatively less offline at the top retailers than before the pandemic. New Yorkers spent $2.02 offline at top retailers for every $1.00 offline at other retailers in January 2020. This figure fell to $1.83 for every $1.00 by August 2021. This is interesting but should be interpreted with caution. As mentioned above, a limitation of this analysis is that online and offline spending done at the same retailer is presented in separate categories. Some of the decline in offline spending at the top retailers is being offset by online spending increases at those same retailers.
Figure 2: New Yorkers continue to allocate most of their spending to top retailers online
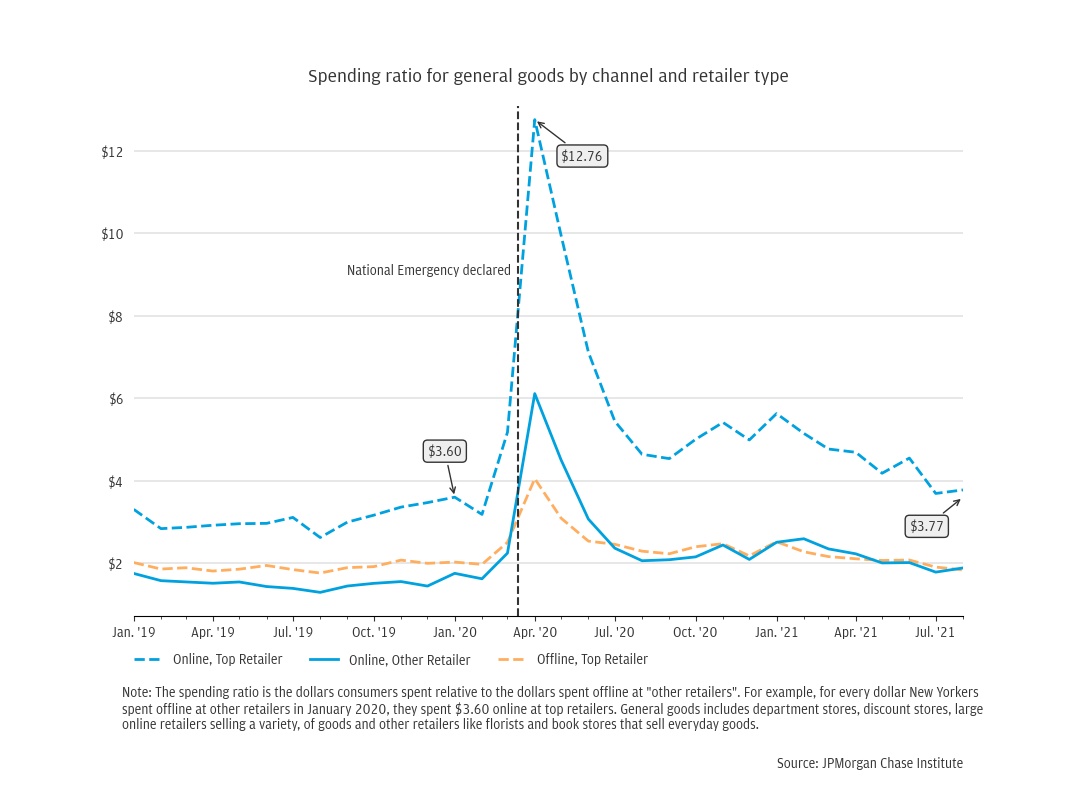
This may initially seem to contradict a common national narrative that the pandemic would provoke a drastic, durable shift in spending away from smaller, offline retailers. (Boyle 2021, D’Innocenzio 2020, Friedman 2020, Nassauer 2020) We do indeed observe a drastic shift, and only observe our series returning to pre-pandemic levels at the end of our study period. Moreover, a return to pre-pandemic patterns does not diminish the disruptions to revenues and expenses businesses faced during this time. It may also be the case that what may be a valid national narrative may not hold in the same ways in New York City, and what may be a valid narrative for the city is meaningfully different across neighborhoods. Further research at different levels of geographic granularity will help elucidate this.
A striking feature of Figure 2 is that for the entirety of our study period, the amounts New Yorkers spent offline at other retailers is always the lowest of the four categories. This is demonstrated by none of the other categories dipping below $1.00 (i.e. for every $1.00 New Yorkers spent offline at other retailers, they always spent at least $1.00 in each of the other categories). This is an empirical outcome about the structure of the market for this product in New York. As we demonstrate in Finding 3, offline spending at other retailers need not have the lowest share of spending. Finally, the drastic changes in spending patterns that occurred in the spring and early summer of 2020 may give the impression that smaller changes are not meaningful. However, small but durable changes in market share on the order of cents on the dollar, rather than multiples of dollars, may still be important in the long term for retailers with low margins.
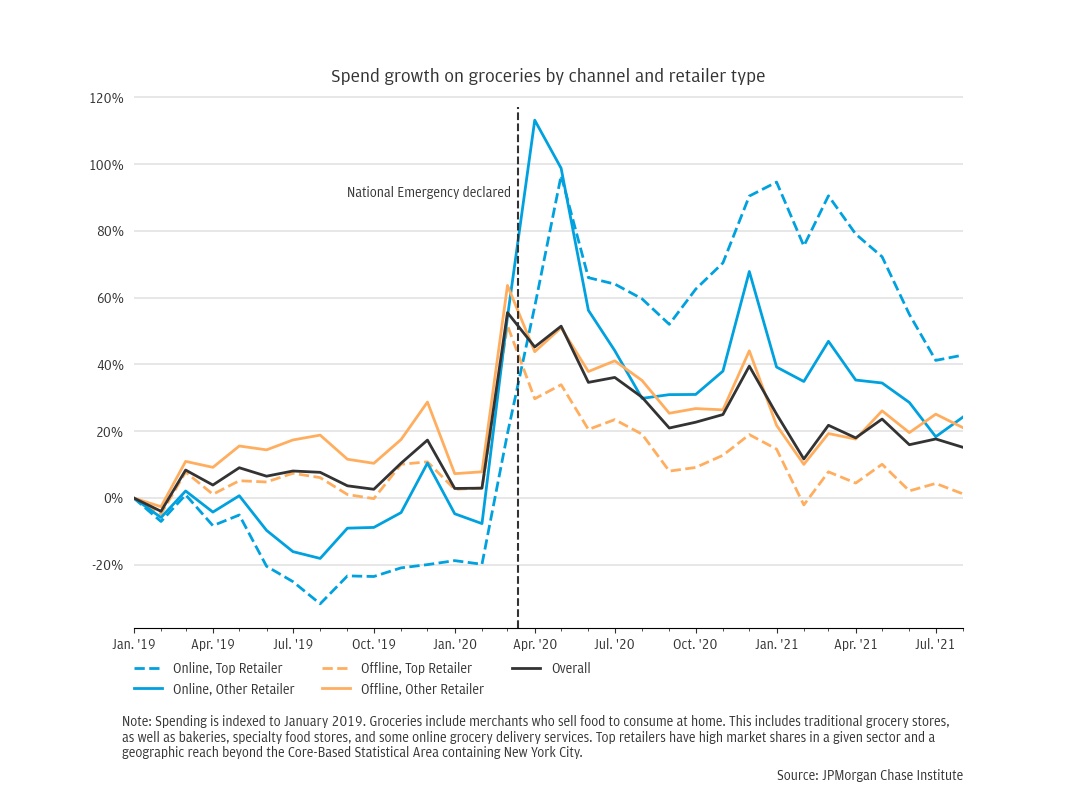
The patterns we observe in New Yorkers’ spending on general goods do not generalize to all product types. We find that New Yorkers’ spending on groceries across our categories is notably different during the study period. In contrast to general goods spending, both online and offline spending at grocery stores increased in March 2020, with offline spending remaining notably positive. Like general goods spending however, online spending grew slower than offline spending regardless of retailer type before the pandemic and this switched after the pandemic.
Figure 3: Online grocery spending grew faster than offline spending after the pandemic, regardless of retailer type
We observed noticeable differences in spending by New Yorkers on general goods and groceries by channel and retailer type. As Figure 4 demonstrates, for every $1.00 New Yorkers spent offline at other retailers, they spent less than $1.00 in each of the other categories. For example, the spending ratio for top retailers was $0.80 in January 2020, and steadily declined to $0.67 by August 2021. It is relevant to note again that New York City may prove different than the rest of the country in this regard. The way people spend on food to consume at home in New York City may be different to other cities in the country, let alone suburban and rural areas.[6]
Figure 4: New Yorkers continue to spend most of the grocery dollars offline at other retailers
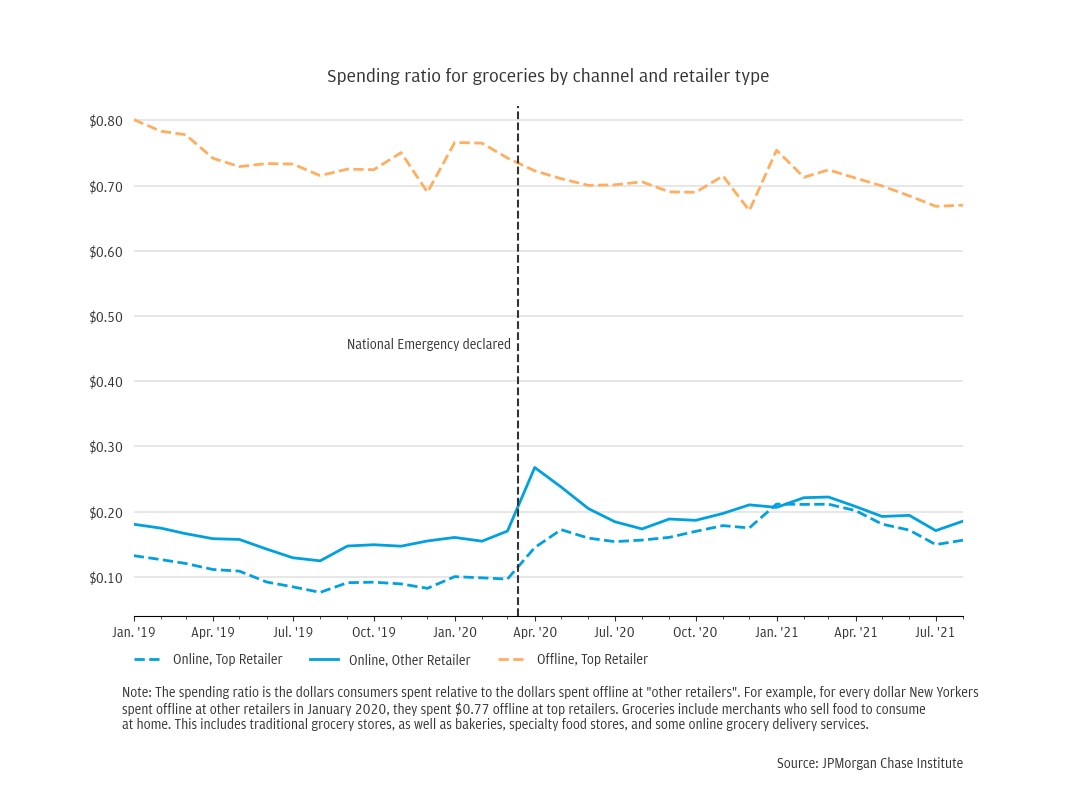
The relatively low spending ratios of online grocery spending at top and other retailers illustrates that they remain a small part of the overall market, despite their high growth rates shown in Figure 3. It is also notable that New Yorkers spent more online at other retailers than they did online at the top retailers. The spending ratio for other retailers online was on average $0.04 higher than top retailers online for the length of the study period. As different types of retailers seek to navigate the changes and challenges of the post-COVID economy, the example of New York City grocers may be an interesting case study.
There was understandable concern that the pandemic may have greatly increased the success of the top retailers at the expense of others. The variation we observe in spending growth across types of retailers and channel does illustrate that there are meaningful differences in how the top retailers are growing relative to others online and offline. We also observe that for general goods spending, there was a drastic shift towards the top retailers online in the first months of the pandemic. However, this changed over the course of the rest of the pandemic, and the allocation of New Yorkers’ spending on general goods returned close to pre-pandemic levels. Other sectors of retail may be experiencing the post-COVID economy differently, and a reversion to pre-pandemic trends does not diminish the real challenges smaller retailers have faced over the past two years.
Longer-term trends toward online spending at top retailers may challenge inclusive growth more than the short-term COVID spike. In more recent months, the top general goods retailers received a smaller share of spending than they did during the height of the pandemic. This said, spending online at the top retailers is growing faster than all other spending categories and had the highest share of spending throughout the entire study period by far. While consumers’ move toward top retailers online may be small relative to the shifts we observe at the height of the pandemic, such changes can be impactful if they continue over the medium- to long-terms, especially for retailers whose margins are tight. Policymakers might usefully attend to these longer-term structural changes when considering programs to support all businesses.
Policymakers can tailor post-COVID economy business support programs to industry-specific needs. Our results show substantial differences in how consumers spend on groceries and general goods. Top online retailers of general goods continue to capture the largest share of consumer spend in the post-COVID economy. In contrast, smaller grocers still capture materially larger shares of consumer spend than top retailers in New York City, though both offline and online spending shares at top grocers are increasing. These differences suggest that decision makers could benefit from making distinctions based on sector and retailer type when assessing business support programs in general, and specifically for programs intended to facilitate the adoption of online sales. For example, a goods retailer may need technical assistance to understand the costs and benefits associated with offering delivery or pickup, how to leverage payment or online customer service platforms, or how to manage shipping logistics. In contrast, a professional services firm may benefit from innovative financing for new audiovisual equipment or infrastructure investments in higher speed broadband to improve the quality of their online services.
Further research can help local policymakers better support businesses and communities in the post-COVID economy. Studying consumer spending at different levels of geographic granularity is beyond the scope of this report but is critical to better understanding the post-COVID economy. In this case, analyses of post-COVID spending behavior in other cities or regions could provide context that would aid the interpretation of our results for New York City. Likewise, more geographically granular analyses of these patterns at the sub-city level can inform more targeted conversations about the experiences of New Yorkers in each of its local communities. More local analysis is critical to informing public policy, as the effects of neighborhood-level differences can be more important than cross-city differences. (Farrell et al. 2019)
For examples, see the Mayor’s Office and Department of Small Business Services launch of the “Shop Your City” campaign (Office of the Mayor, 2021) or pieces from major press outlets (Friedman, 2020).
ZIP codes represent collections of postal routes and not areas. As a result, the U.S. Census created ZIP Code Tabulation Areas (ZCTAs) to represent the areal unit covered by a ZIP code.
We obtained the collection of ZCTAs that roughly matches the city boundaries here: https://www.baruch.cuny.edu/confluence/display/geoportal/NYC+Geographies.
It is important to note that because the “top retailers” group is relatively well-defined to contain what most people would recognize as the largest retailers in the country, the “other retailers” group is correspondingly large and contains a wide variety of businesses, from the smallest non-employer businesses to long-standing, successful businesses that have a few locations around the metro area.
As explained in the methodology section, we break out spending into categories that separate retailers’ online and offline services if they offer both.
One example of an important difference is the number of stores available to New Yorkers in a given part of the city. The 2019 County Business Patterns dataset reports that the median New York City ZIP code has 47 food and beverage stores. For comparison, the median Chicago ZIP code has 15 and the median Los Angeles ZIP code has 16. The national median is 8. These figures do not account for the smaller size of ZIP codes in dense areas, and so may even understate the difference in the geographic density of these stores.
Boyle, Matthew. “Pandemic Unleashes New Big-Box Era.” Bloomberg. Mar. 16, 2021.
D’Innocenzio, Anne. “Pandemic highlights big box stores’ ability to pivot.” Associated Press. May 21, 2020.
Farrell, Diana, Christopher Wheat, and Carlos Grandet. 2019. “Place Matters: Small Business Financial Health in Urban Communities” JPMorgan Chase Institute. https://www.jpmorganchase.com/content/dam/jpmc/jpmorgan-chase-and-co/institute/pdf/institute-place-matters.pdf
Farrell, Diana, Christopher Wheat, Marvin M. Ward Jr., Lindsay E. Relihan. 2020. “The Early Impact of COVID-19 on Local Commerce: Changes in Spend Across Neighborhoods and Online.” JPMorgan Chase Institute. https://www.jpmorganchase.com/insights/all-topics/community-development/report-early-impact-covid-19-local-commerce
Friedman, Gillian. “Big-Box Retailers’ Profits Surge as Pandemic Marches On.” New York Times. Aug. 19, 2020.
Hortaçsu, Ali and Chad Syverson. “The Ongoing Evolution of US Retail: A Format Tug-of-War.” Journal of Economic Perspectives 29, no. 4 (2015): 89-112.
Nassauer, Sarah and Jennifer Maloney. “Big-Box Stores, Worried About Amazon, Were Ready for Coronavirus.” The Wall Street Journal. Aug. 24, 2020.
Office of the Mayor. “New York City Launches ‘Shop Your City’ Challenge,” NYC. New York City Office of the Mayor, May 25, 2021.
Office of the New York State Comptroller. “Local Sales Tax Collections Up 19% in 2021.” Office of the New York State Comptroller. Office of the New York State Comptroller, February 9, 2022. https://www.osc.state.ny.us/press/releases/2022/02/local-sales-tax-collections-19-percent-2021
Rodrigue, Jean-Paul. “The distribution network of Amazon and the footprint of freight digitalization.” Journal of Transport Geography 88 (2020): 102825.
Wheat, Christopher, James Duguid, Lindsay E. Relihan, and Bryan Kim. 2021. “The COVID Shock to Online Retail: The persistence of new online shopping habits and implications for the future of cities.” JPMorgan Chase Institute. https://www.jpmorganchase.com/insights/all-topics/community-development/covid-shock-to-online-retail.
Wheat, Christopher, James Duguid, Bryan Kim, and Lindsay E. Relihan. 2021. “The Local Commerce Data Series.” JPMorgan Chase Institute. https://www.jpmorganchase.com/insights/all-topics/community-development/local-commerce-data-series
Wheat, Christopher, Chi Mac, and James Duguid. 2021. “Retail Spending Response to Local Conditions during COVID-19.” JPMorgan Chase Institute. https://www.jpmorganchase.com/insights/all-topics/community-development/retail-spending-response-to-local-conditions-during-covid-19
We thank Shawn Rickenbacker, Prabal De, Michael Grossberg, Susanna Schaller, Hector Tarrido-Picart, research faculty of The City College of New York and The J. Max Bond Center for Urban Futures, Bryan Kim, and Maya Sokoletsky for their contributions to the direction and execution of this research.
We would like to acknowledge Jamie Dimon, CEO of JPMorgan Chase & Co., for his vision and leadership in establishing the Institute and enabling the ongoing research agenda. We remain deeply grateful to Peter Scher, Vice Chairman, Demetrios Marantis, Head of Corporate Responsibility, Heather Higginbottom, Head of Research & Policy, and others across the firm for the resources and support to pioneer a new approach to contribute to global economic analysis and insight.
This material is a product of JPMorgan Chase Institute and is provided to you solely for general information purposes. Unless otherwise specifically stated, any views or opinions expressed herein are solely those of the authors listed and may differ from the views and opinions expressed by J.P. Morgan Securities LLC (JPMS) Research Department or other departments or divisions of JPMorgan Chase & Co. or its affiliates. This material is not a product of the Research Department of JPMS. Information has been obtained from sources believed to be reliable, but JPMorgan Chase & Co. or its affiliates and/or subsidiaries (collectively J.P. Morgan) do not warrant its completeness or accuracy. Opinions and estimates constitute our judgment as of the date of this material and are subject to change without notice. No representation or warranty should be made with regard to any computations, graphs, tables, diagrams or commentary in this material, which is provided for illustration/reference purposes only. The data relied on for this report are based on past transactions and may not be indicative of future results. J.P. Morgan assumes no duty to update any information in this material in the event that such information changes. The opinion herein should not be construed as an individual recommendation for any particular client and is not intended as advice or recommendations of particular securities, financial instruments, or strategies for a particular client. This material does not constitute a solicitation or offer in any jurisdiction where such a solicitation is unlawful.
Wheat, Chris and James Duguid, 2022. “Post-COVID Consumer Spending in New York City.” JPMorgan Chase Institute.
Authors

Chris Wheat
President, JPMorganChase Institute

James Duguid
Former Research Lead, JPMorganChase Institute