

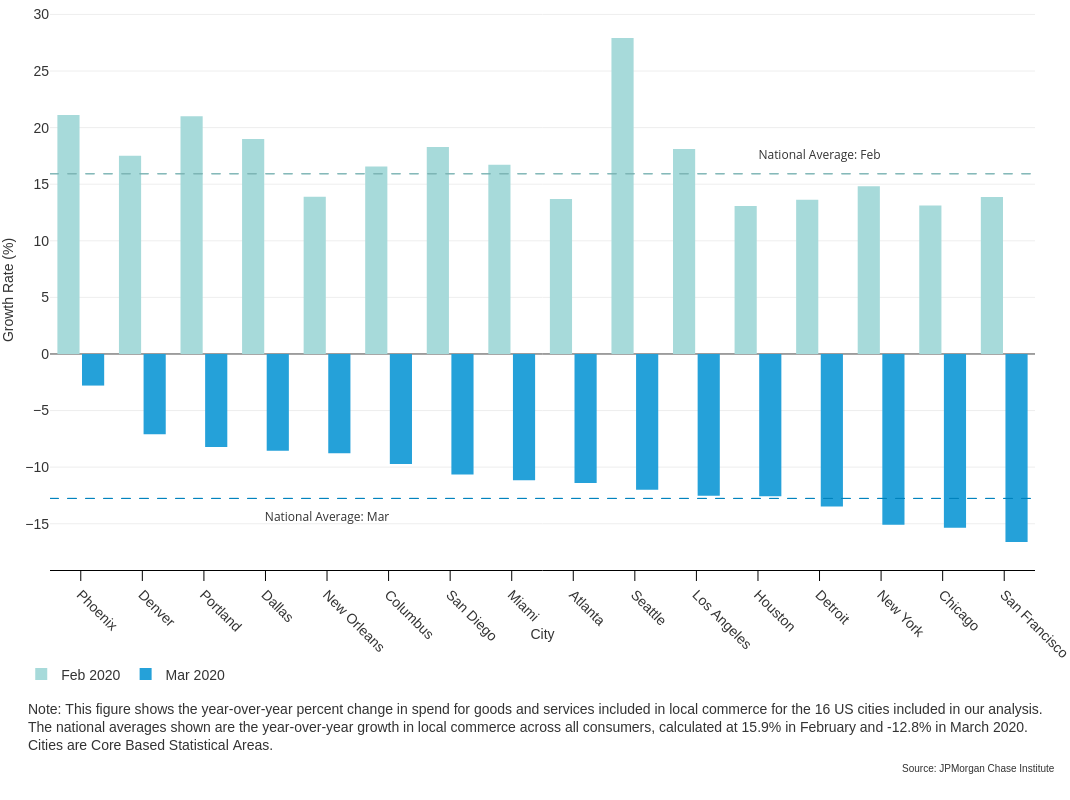
Year-over-year percent change in local commerce spend, by city
Latest news

An Ohio-based company is protecting first responders around the world
With support from JPMorganChase, Fire-Dex is providing protective equipment to firefighters in 100 countries and all 50 states.
Learn moreLatest news

Veteran’s Unconventional Path to Landing her Dream Job in Tech
U.S. Army Veteran Ashley Wigfall transitioned to a civilian role and charted her path to technologist through mentorship and skills training at the JPMorgan Chase tech hub in Plano, Texas.
Learn more
Findings
COVID-19 has rapidly transformed everyday life. While the scope of the pandemic is global, consumers experience the economic impacts locally. Understanding the strain of COVID-19 on the local economy requires a place-based view of the interplay between consumers and merchants within communities, which can inform ongoing efforts to aid the recovery of local economies.
This insight leverages a local commerce dataset of approximately 450 million monthly credit card transactions from a sample of 11 million de-identified Chase customers each month between October 2019 and March 2020. The local commerce view represents everyday goods and services transacted between local buyers and sellers and includes the channel by which the transaction was made (online/offline) and the zip code of both the consumer and the merchant, providing an understanding of the distance between a consumer’s residence and where they made a purchase.
The aim of this insight is to inform the impact of the pandemic on the supply and demand of local commerce across U.S. cities, including analyses of high-income versus low-income neighborhoods, access to food, shifts in the types of products and services purchased, and shifts from brick-and-mortar to online.
Year-over-year percent change in local commerce spend, by city
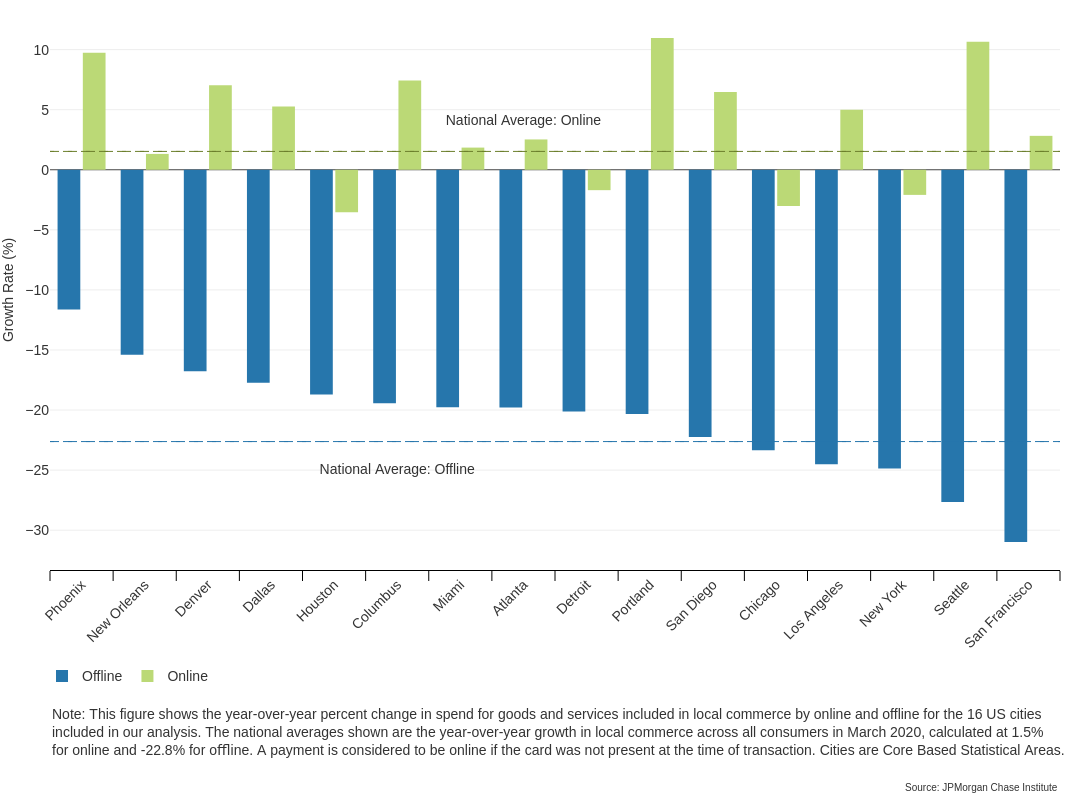
Year-over-year percent change in local commerce spend, by channel
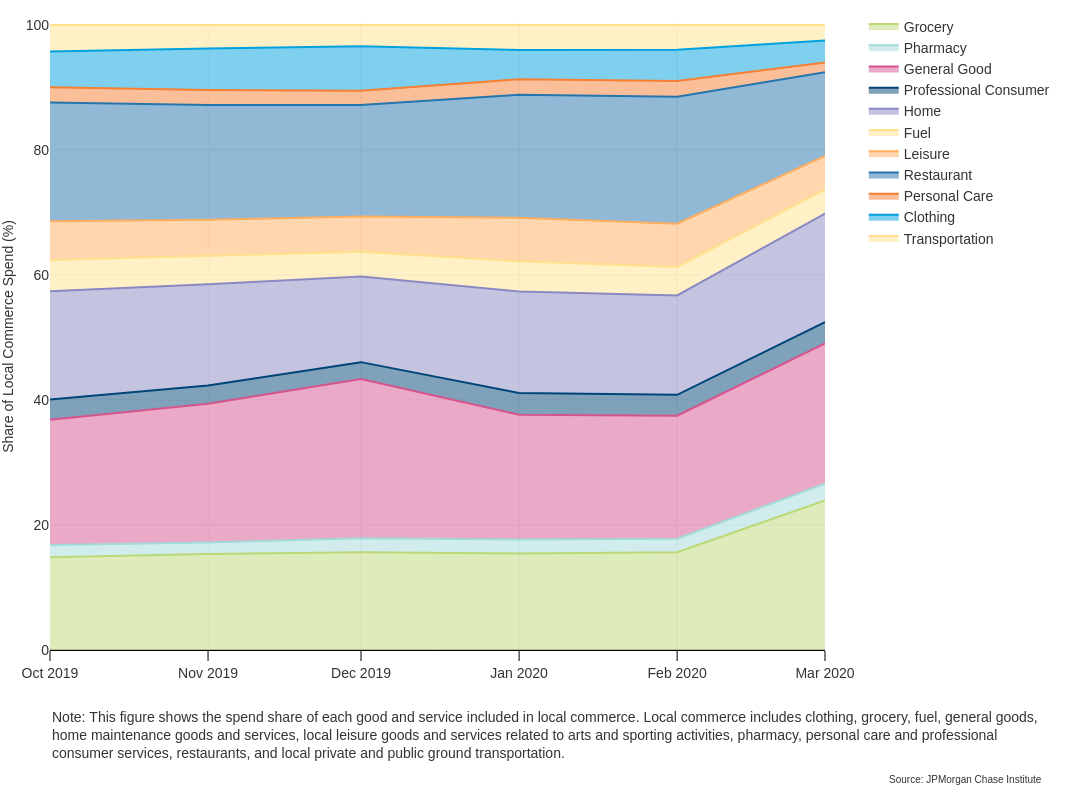
Year-over-year percent change in local commerce spend, by product category
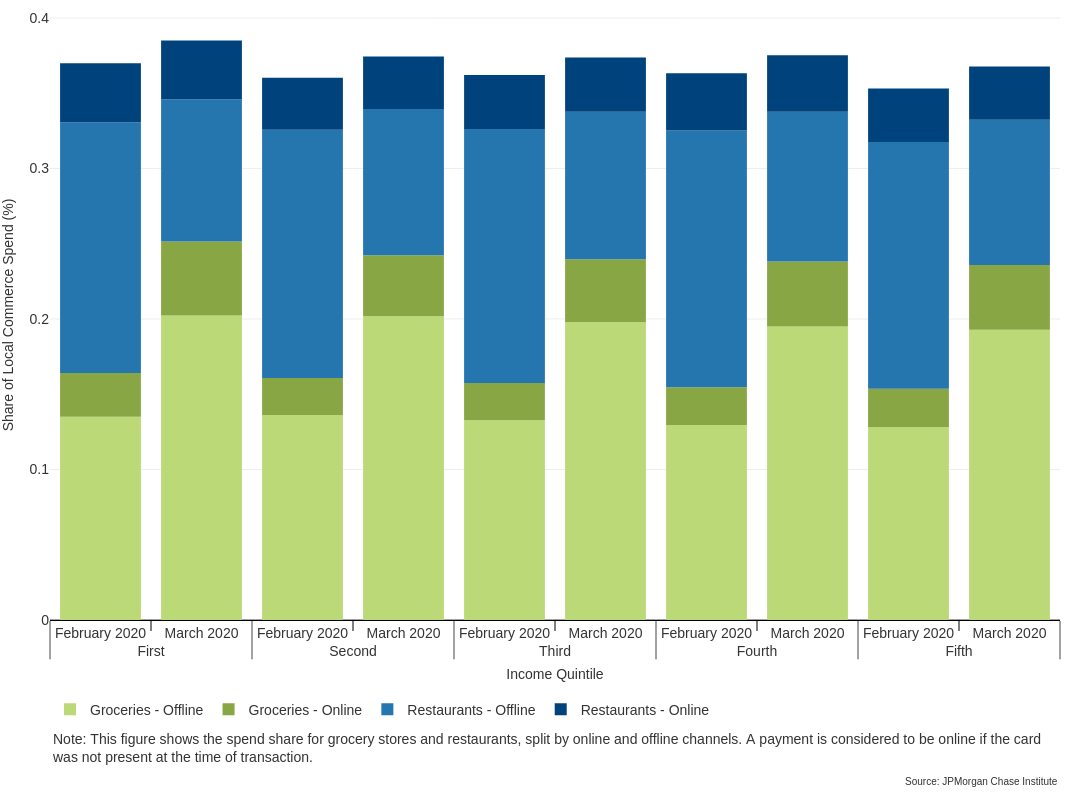
Spend share for grocery stores and restaurants, by online and offline channels
Authors

Chris Wheat
President, JPMorganChase Institute

Marvin Ward
Local Commerce Research Lead JPMorgan Chase Institute

Lindsay Relihan
JPMorgan Chase Institute Academic Fellow