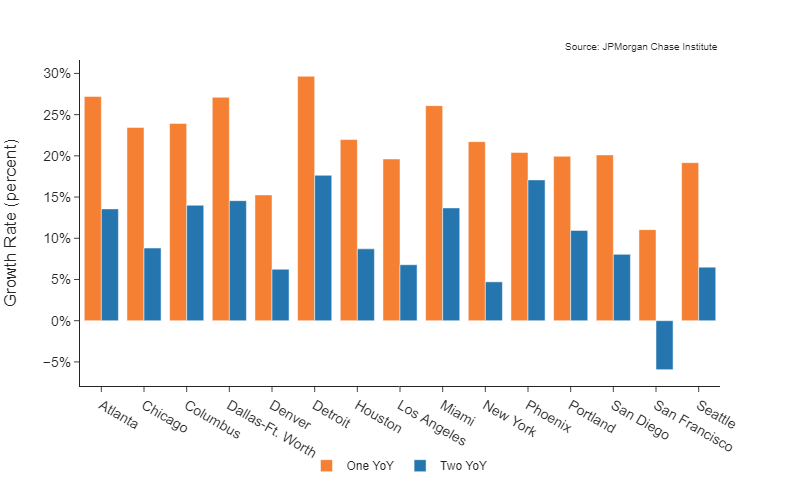
While all metro areas we track recorded growth relative to March 2020, San Francisco is the only metro area in which spending remains below what is was in March 2019.
Latest news

An Ohio-based company is protecting first responders around the world
With support from JPMorganChase, Fire-Dex is providing protective equipment to firefighters in 100 countries and all 50 states.
Learn moreLatest news

Veteran’s Unconventional Path to Landing her Dream Job in Tech
U.S. Army Veteran Ashley Wigfall transitioned to a civilian role and charted her path to technologist through mentorship and skills training at the JPMorgan Chase tech hub in Plano, Texas.
Learn more
The Local Commerce Data Series are a battery of measures which provide a place-based view of local spending. Based upon the credit and debit card transactions made by over 40 million de-identified credit and debit card users across 15 major U.S. metro areas, the series provides decision-makers a view into the local commerce activity happening in their cities.
The downloadable data and figures relate growth rates over one and two years and growth contributions for local commerce for 15 metro areas. The “national” view is constructed as the aggregate trend across these 15 areas. For all geographies, growth is broken out by consumer age*, product type (e.g. restaurants), and channel (i.e. online/offline) to help local stakeholders and decision-makers better understand how consumer spending contributes to the economic vibrancy in their cities.
As vaccination rates rise throughout the United States, people are anticipating a “return to normal” in their everyday lives. Until March 2021, the prior year provided a useful baseline for assessing differences to pre-pandemic economic activity. Starting in March 2021, a year-over-year growth measure does not address the question of how local spending compares to pre-pandemic levels. For this reason, we now calculate spending growth compared to both one and two years prior. Presenting growth relative to baselines before and during the COVID-19 pandemic allows us to better contextualize the economic activity we observe. For this reason, we will continue to publish both our year-over-year growth series and our comparison of the latest month to its pre-pandemic counterpart.
We hope that these data and figures can provide a better understanding of current local economic conditions and serve as useful input into decision making processes. Moreover, we hope that this series provides a view into the data that underlie our Cities & Local Communities research, and provide useful context around what forms of inquiries/research we are able to usefully inform. For an example of how our data can be leveraged for decision making, please see our insight "Retail spending response to local conditions during COVID-19" which explores how consumer spending behavior responded to local conditions during the COVID-19 pandemic. Please reach out with any questions, feedback, or inquiries by emailing institute@jpmchase.com.
For a list of frequently asked questions (and their answers), please visit this link.
* The age breakout is currently delayed due to scheduling issues, but will be updated in future releases.
While all metro areas we track recorded growth relative to March 2020, San Francisco is the only metro area in which spending remains below what is was in March 2019.
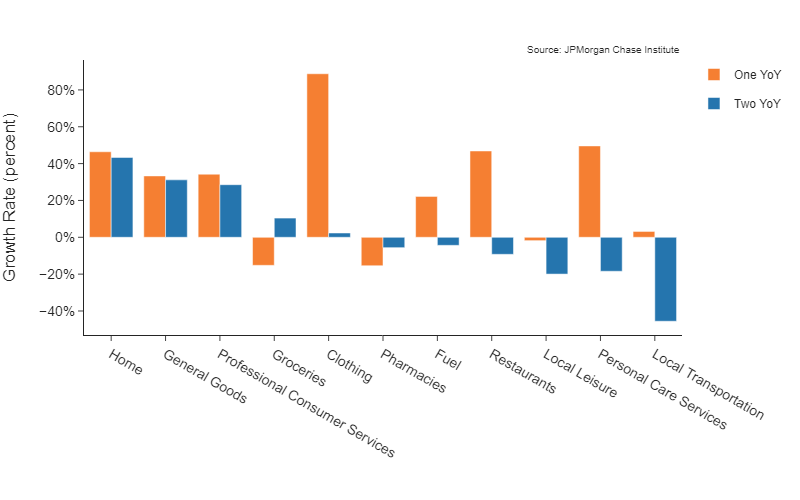
Spending at restaurants and on personal care services is up compared to March 2020 but remains below its 2019 levels. Spending on local leisure and transportation has not seen strong growth compared to last year and remains far below 2019 levels.
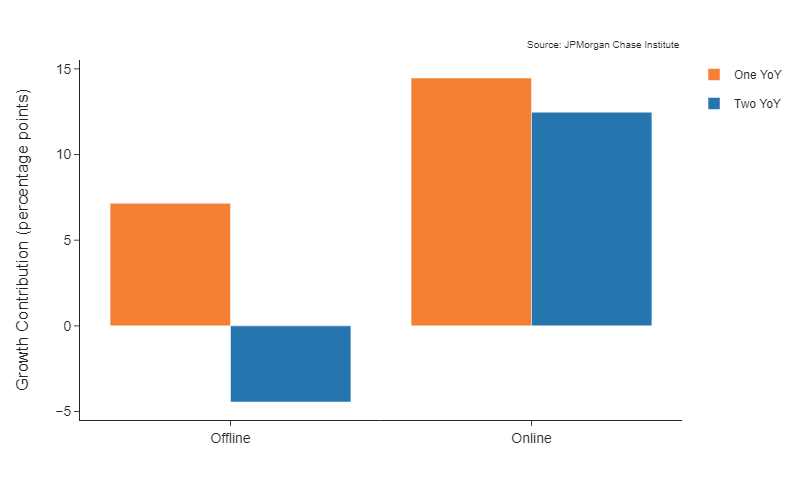
Online spending continues to drive spending growth, contributing positively to growth over both one and two years.