

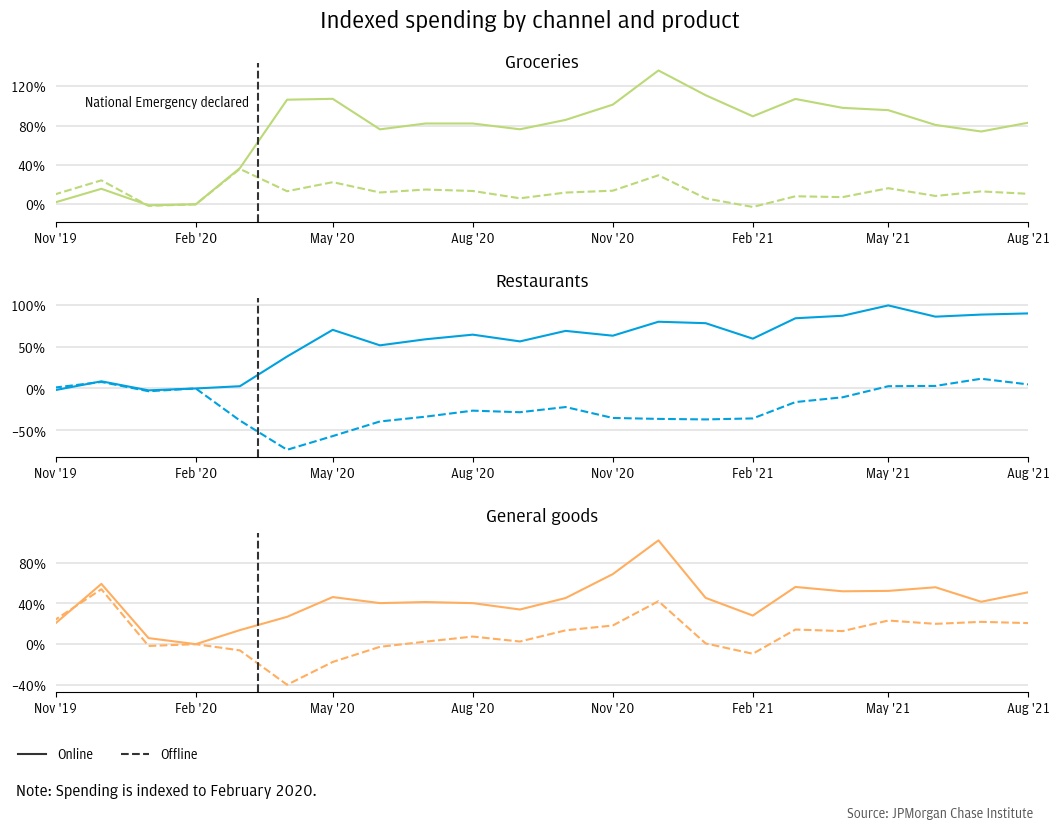
Figure 1: Online spending peaks at the start of the pandemic and has since remained high
Latest news

An Ohio-based company is protecting first responders around the world
With support from JPMorganChase, Fire-Dex is providing protective equipment to firefighters in 100 countries and all 50 states.
Learn moreLatest news

Veteran’s Unconventional Path to Landing her Dream Job in Tech
U.S. Army Veteran Ashley Wigfall transitioned to a civilian role and charted her path to technologist through mentorship and skills training at the JPMorgan Chase tech hub in Plano, Texas.
Learn more
Findings
During the initial months of the COVID-19 pandemic, total online consumer spending increased by 43.7 percent year-over-year (U.S. Census Bureau 2021).[i] This unprecedented increase resulted from the threat of infection and local restrictions that made it harder to shop in-person. Further contributing, many households maintained their incomes during the pandemic through a combination of savings, work-from-home, and stimulus payments.[ii] As acute pandemic conditions ease, it is an open question whether consumers will continue their new online shopping habits. If the increase in online retail is temporary, then short-term support for struggling brick-and-mortar businesses and city centers may be sufficient. However, if consumers maintain these new shopping habits, longer-term policies may be warranted to help cities adjust to a new equilibrium of where and how consumers shop.
The aim of this research is to measure the persistence of the COVID-19 shock to consumers’ online retail shopping habits through the pandemic. We focus on groceries, restaurants, and general goods – three products that account for half of consumer spending and grew rapidly online in the initial months of the pandemic.[iii] We find that:
There are many benefits to shopping online for most consumers, including time-savings, lower prices, and access to a wider variety of products (Bakos 1997, Forman, Ghose and Goldfarb 2009, Jin and Kato 2007, Jingting, et al. 2018, Jo, Matsumura and Weinstein 2019, Relihan 2021). However, to date, these gains have gone primarily to high-income and urban areas (Dolfen, et al. 2019). Furthermore, certain consumers and businesses may face harm in the face of a broad shift to online retail. Consumers who are unable to access online markets may be disadvantaged and face greater consumption inequality, as is common in new product markets (Jaravel 2019).[iv] Similarly, businesses that are unable to break into or maintain a successful online presence may be disadvantaged as more consumers shop online for their goods and services.[v]
We study the credit and debit card transactions of a panel of 13.1 million people from January 2019 through August 2021.[vi] A unique advantage of these card data is the fine-grained information about the purchase and merchant that allow us to study detailed behavior by payment channel and product. We classify a transaction as online if the card was not present at the time of purchase. We also classify transactions into products based on the associated merchant category code, merchant name, and merchant location information.
Merchants in these online product categories roughly correspond to their offline counterparts, but with the addition of certain online-only retailers. Online groceries primarily consists of online delivery platforms and grocery curbside pick-up services. Online restaurants consists of both online food delivery platforms and online orders at individual restaurants. Online general goods covers both large stand-alone online retailers and online sales among a wide variety of small- and medium-size general merchandise retailers.[vii]
Figure 1: Online spending peaks at the start of the pandemic and has since remained high
We find that online spending growth across all three products increased sharply at the start of the pandemic and remained at a similarly high level through August 2021. As illustrated in Figure 1, online spending growth on groceries peaked at 136 percent above its February 2020 baseline and is 83 percent above baseline in August 2021. Growing from a larger base, online spending growth on restaurants and general goods both peaked at around 100 percent over baseline and are 90 and 51 percent over baseline in August 2021, respectively. Over the same period, consumers spent more on offline groceries and less on offline restaurants and general goods. Offline spending for general goods returned to pre-pandemic levels earliest, in the summer of 2020. Offline spending on groceries and restaurants only returned to pre-pandemic levels in the summer of 2021.
The higher spending across both online and offline channels in the most recent data likely reflects both higher consumer spending on these products and higher consumer spending overall. The Census Monthly Retail Trade Survey shows that 2021-Q2 total consumer spending is 24 percent higher than two years ago, a 2-year growth rate well above typical pre-pandemic rates. As a result, this overall increase may be temporarily shielding offline retailers from the full effects of consumers’ new online shopping habits once consumer spending returns to a more modest level. Indeed, foot traffic data suggests that despite this growth in spending, mobility for retail goods and recreation remain depressed.[viii]
While overall increases in consumer spending likely contributed to online spending growth remaining near its early pandemic highs, it is notable that online spending has remained consistently elevated since the initial spike. This suggests the level shift in online spending is more than a transient adaptation, but rather, a potentially longer-term change in the way consumers purchase their goods.
We shed light on the permanence of increases in online spending by studying consumers separately based on their online behavior prior to the pandemic. Understanding how different consumers are changing their behavior has implications for long-run online spending growth. For example, people who only started buying groceries online during the pandemic may have stopped doing so once in-person shopping became less risky. Alternatively, wider availability of online groceries during the pandemic may imply a more permanent expansion of the online grocery customer base. Similarly, consumers with little prior experience purchasing a product online may return to their pre-pandemic baseline or more permanently increase their use of online products.
To do this, we first separate consumers into three groups based on their online spending volume on each product in 2019. If a consumer does not spend online at all on a product in 2019, they are categorized as having no prior use. For the remaining consumers who do spend online on a product in 2019, we separate them into low prior use and high prior use categories based on whether their online spending volume was less than or at least at the 75th percentile of individual spending for that product, respectively.
Figure 2: Many consumers did not shop online for groceries in 2019. However, most shopped online for restaurants and general goods
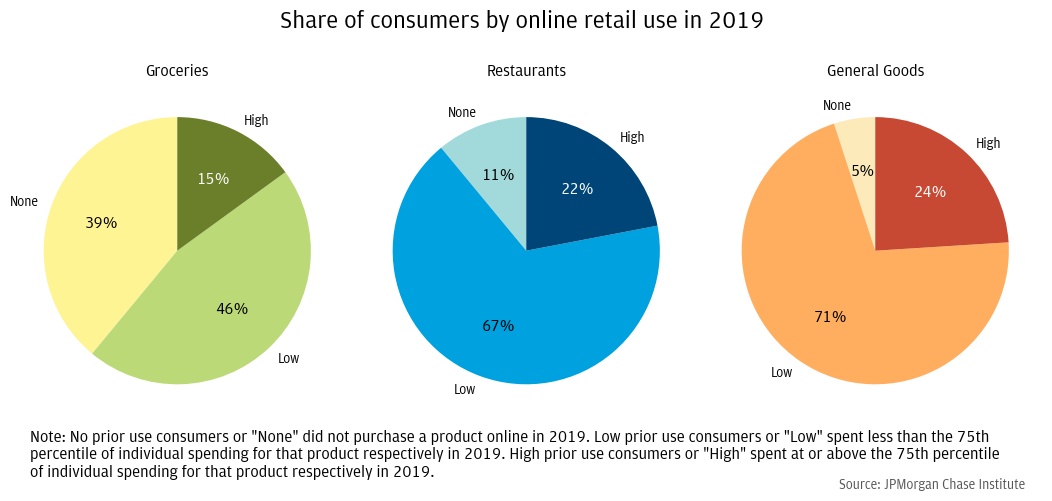
Figure 2 shows that in 2019, nearly 40% of the consumers in our panel did not shop online for groceries. For restaurants and general goods, most consumers shopped online for those products to some extent. This difference is driven by the fact that online grocery is a newer service, it requires a specialized delivery infrastructure, and there is more persistent consumer hesitancy to buy groceries online.[ix],[x] Therefore, at the start of the pandemic, there was more scope for online growth from existing customers in restaurants and general goods, while growth from new customers was also possible for groceries.
Figure 3: People with low or no prior online consumption continued shopping more online post-pandemic
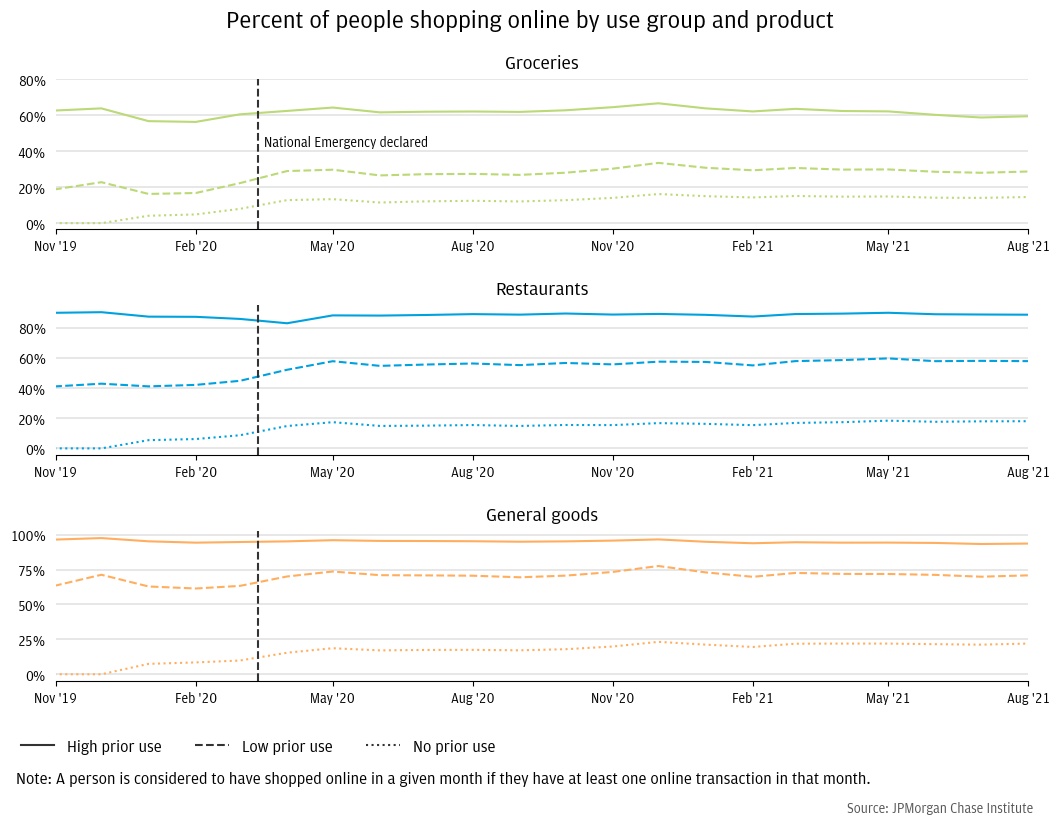
We find persistent increases in online shopping by consumers who did little to no online shopping in 2019 as measured by both the share who shop online in each month and changes in median spending. Figure 3 shows the share of people shopping online among shoppers with no prior use grew at the onset of the pandemic and remained at elevated levels between 15 to 22 percent across all three products as of August 2021. Similarly, the share shopping online among people with low prior use also grew, going from 18 to 29 percent for groceries, 42 to 58 percent for restaurants, and 61 to 71 percent for general goods between February 2020 and August 2021. Finally, among people with high prior use, the percent of people shopping online each month continued at similar rates through the pandemic across the three products we tracked. This is despite room for expansion – only 60 and 89 percent of previously high users shopped online every month after March 2020 for groceries and restaurants, respectively. This suggests a ceiling in each product market for the percent of customers who shop online each month.
Figure 4: Typical spending remains elevated for previously low users of restaurants and general goods
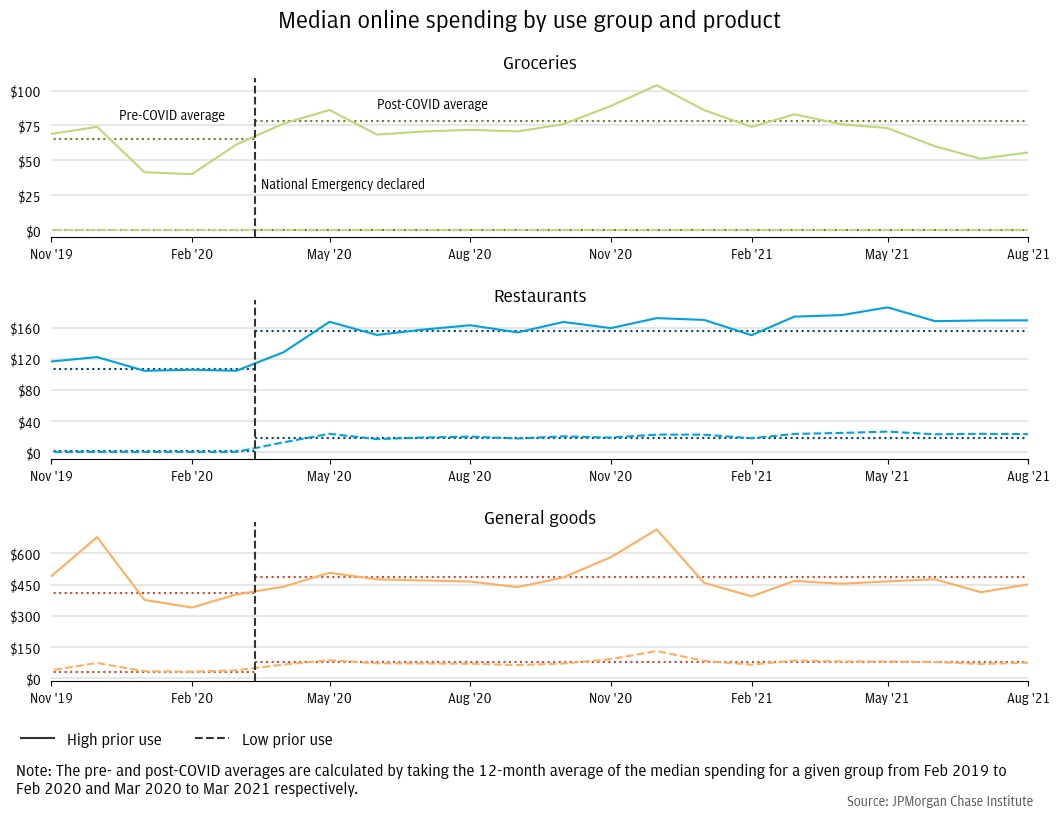
Figure 4 shows the median monthly spending on each product by consumers with high and low prior online spending. Among consumers who were already spending online before the pandemic, we find that median spending across the three products remained high at least one year after the onset of the pandemic.[xi] In recent months, typical spending on online restaurants and general goods remains elevated among people with low prior use of these online products. Notably, we find that typical spending by high prior users of online groceries has fallen below its pre-COVID average.
Together, these results show that consumers who did little to no online shopping pre-pandemic are now shopping and spending more online every month. This suggests that, among people with low or no prior use of online products, shopping online consistently may become a way of buying what they need over the long-term.
Figure 5: People with low or no prior online consumption have become important segments of online retail markets
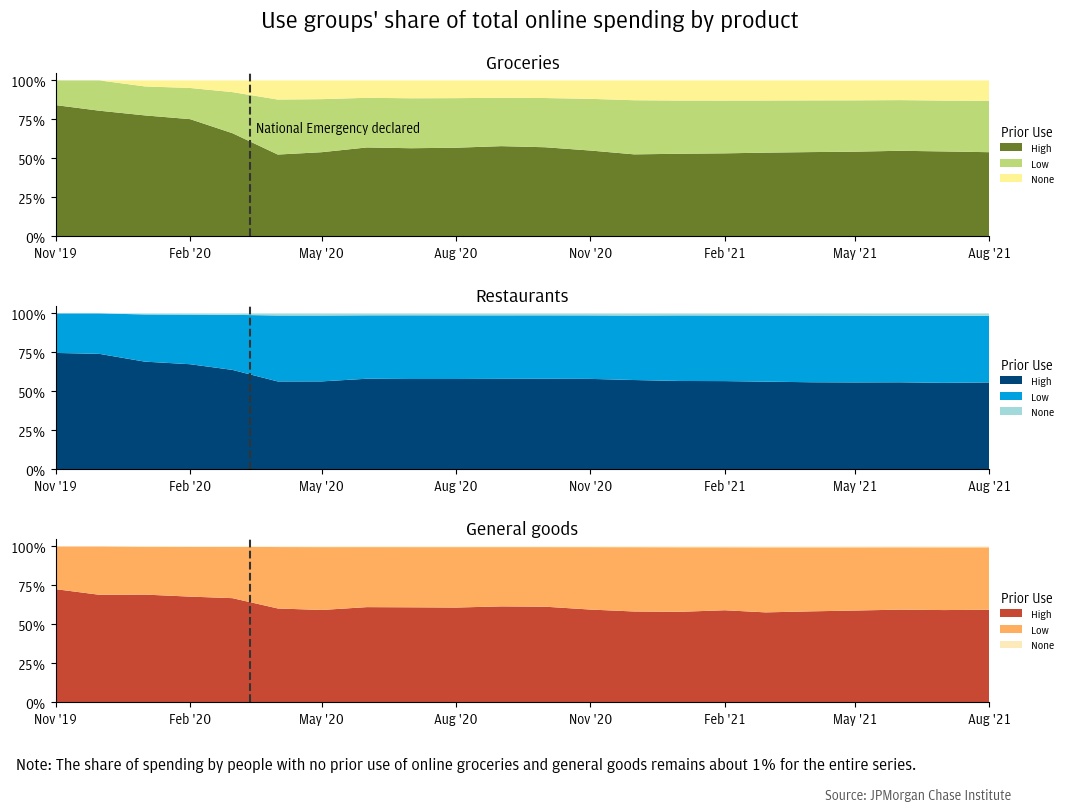
While people with high prior use continue to be an important share of each online market, people with low or no prior use account for around 40 percent of each online product market as of August 2021. Figure 5 shows the aggregate share of online spending by prior use group across the pandemic. Between February 2020 to August 2021, low prior use consumers in online restaurants and general goods grew their share of online spending from 32 percent to 43 and 40 percent, respectively. In addition to similar growth in low prior users in online groceries, customers who did not shop online prior to the pandemic increased their share of online spending to 13 percent by August 2021. For all three online products, these consumers have grown to become a persistently substantive share of online spending. The changing composition of who is shopping online has implications for the structure of online and offline retail going forward.
Figure 6: Some customers shop intensively online for multiple products, but a substantial percent do not
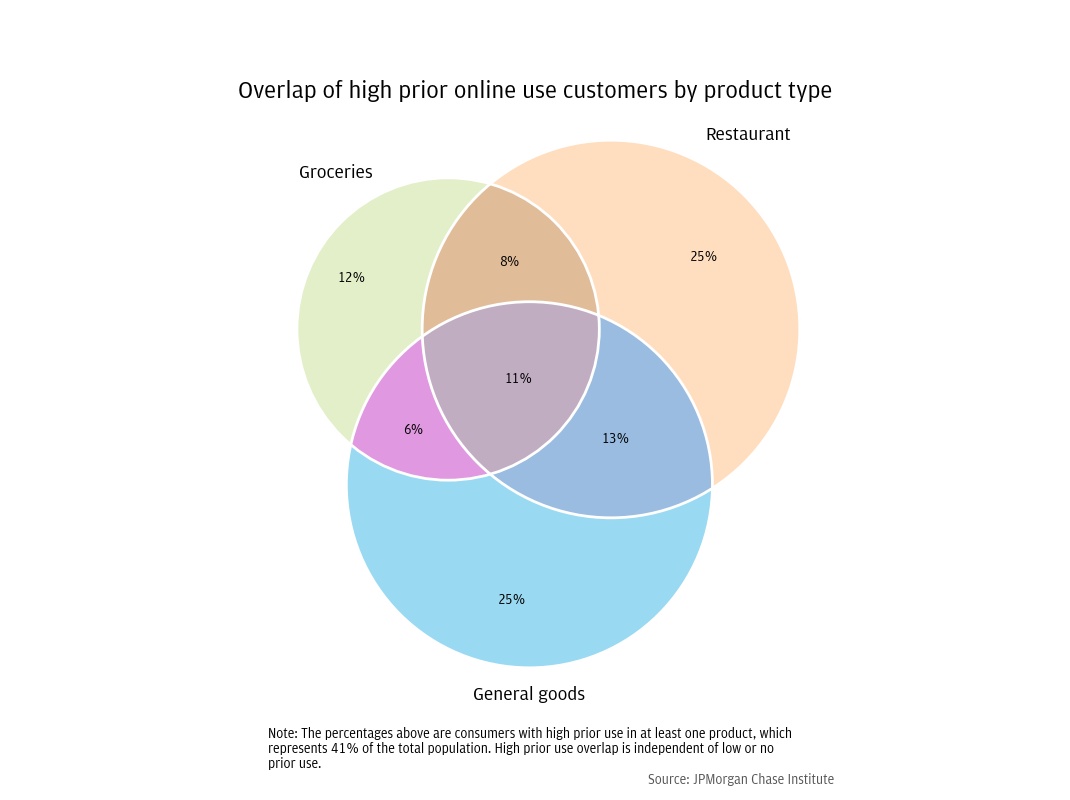
The extent to which prior use groups are overlapping or are distinct groups of people has implications for the degree to which increases in online spending in one product are likely to spill over into other products. Moreover, the degree of overlap illuminates the degree to which online spending growth is concentrated amongst a core group of users. Figure 6 shows that while there is meaningful overlap in the customers who shop intensively online for multiple products, the people with high prior use in each product market are more often different people. We find that just 11 percent of high prior users were high prior users in all three product markets, with a total of 38 percent classified as high prior users in more than one. Therefore, while spillovers in online shopping behaviors are relevant in understanding online markets, increasing use intensity during the pandemic in one market seems unlikely to drive consumers to switch to buying substantially more online across every product.[xii] We leave the extent of these spillover effects during the pandemic to future research.
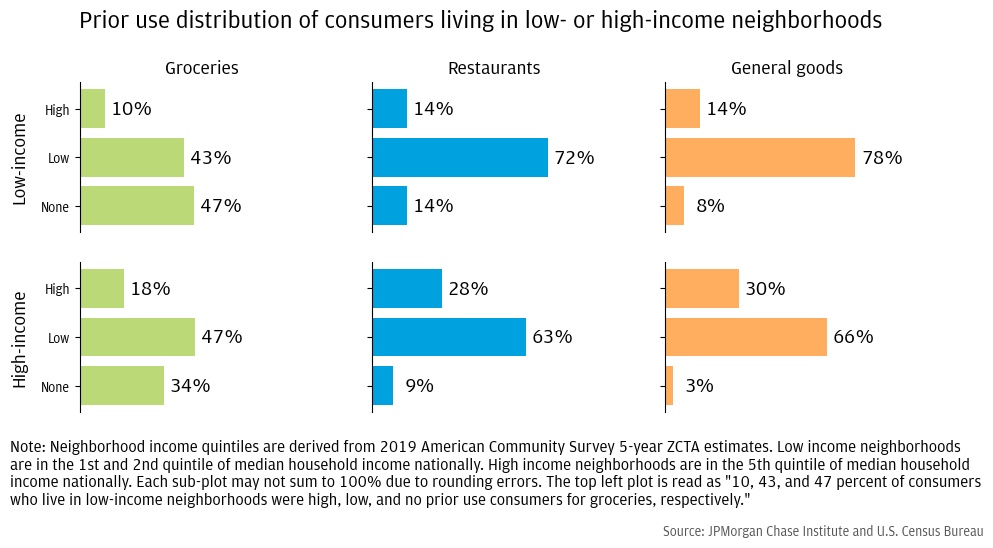
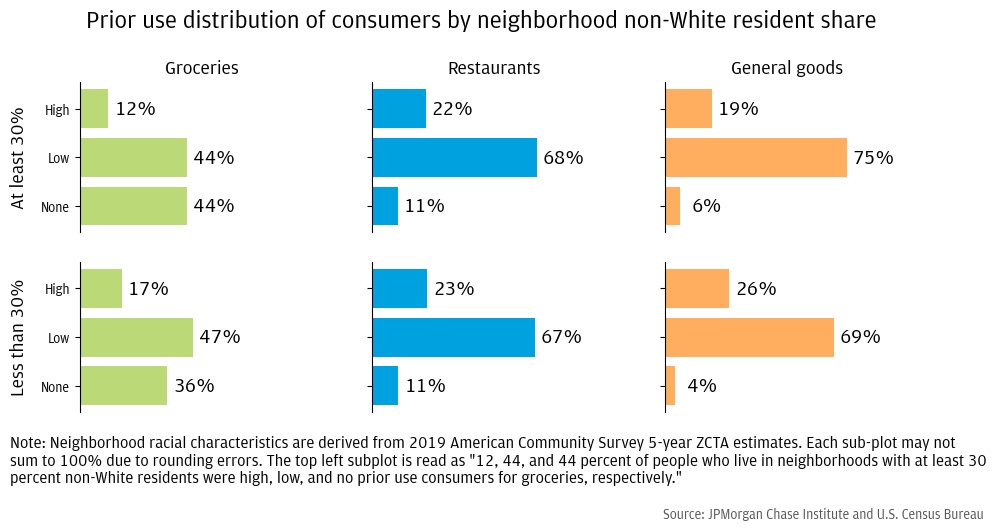
We study the features of consumers in each prior use group to better understand the distributional impacts of the persistence of new online shopping patterns across the socioeconomic spectrum. We include the median income of the consumer’s ZIP code, the percentage of non-White residents in the consumer’s ZIP code, and the consumer’s gender.[xiii] Figure 7 shows the results by ZIP code income and racial composition (results by gender can be found in the appendix). Across all three online products, consumers who live in low-income neighborhoods are about half as likely to be high prior users than those in high-income neighborhoods. A similar disparity exists among consumers who live in neighborhoods where more or less than 30 percent of the residents are non-White, though the differences are less stark. Finally, as shown in Figure 9 in the Appendix, the differences by gender are minimal though women in our sample shop more online for groceries than men.
Figure 7: Consumers who do not purchase the products we study online prior to the pandemic are more likely to live in low-income neighborhoods and neighborhoods with at least 30 percent non-White residents
Panel (a)
Panel (b)
Our previous results demonstrate that people who did little to no online shopping pre-pandemic increased their share of spending, their median spending, and the frequency of their spending. This, combined with the results in Figure 7, suggests access to online retail may have become more equitable during the pandemic. This is likely due to changes in both supply and demand in these neighborhoods. However, because our measures of income and racial composition describe neighborhoods not individuals, the degree of this equitability depends on the extent to which low-income and non-White residents in these neighborhoods increased their purchase of online products relative to higher-income and White residents. We leave these exercises to future research, but find that this is an important indicator that contrasts with the previous distributional impacts of online retail (Dolfen, et al. 2019, Relihan 2021).
Increases in online retail are often contrasted with struggles in the brick-and-mortar retail sector. While the initial shock of the pandemic did cause large drops in offline spending, the recent strength of overall consumer spending may give the impression that substitution from offline to online retail is unimportant in the current environment. To study substitution across channels more concretely, we examine how offline spending during the pandemic varies by the prior online use of consumers in the same product market.
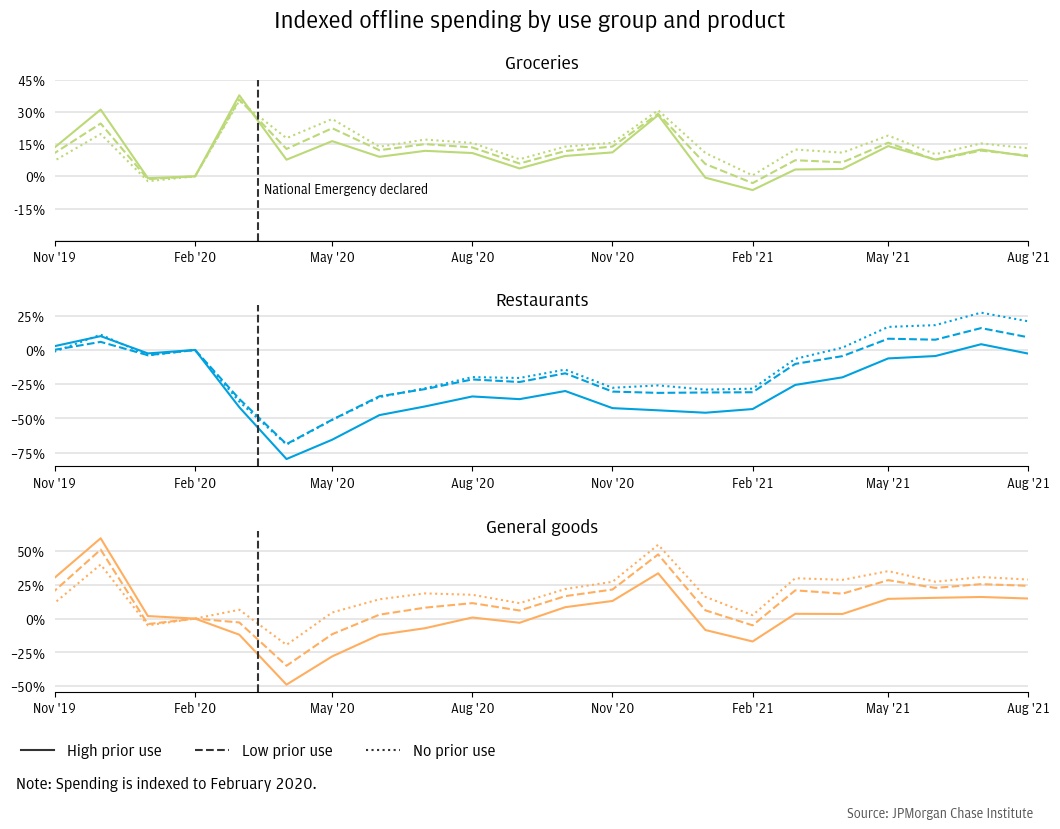
We find that offline spending growth since the start of the pandemic is slower for more intensive users of online retail. Figure 8 shows the negative correlation between prior online use and offline spending growth in each product market. This is in contrast to the pre-pandemic order, in which high prior users also spent the most on offline product counterparts.[xiv] This suggests that the rise in online retail is displacing a substantial share of offline retail, despite higher overall spending.[xv] Furthermore, if people with low and no prior use continue to spend more like high prior use consumers, offline spending may decline even further in the future.
Figure 8: Higher use intensity consumers decreased their offline spending by more than lower use intensity consumers.
Online retail is a sustaining and disruptive force in the retail sector. The positive demand shock to the online economy has broad effects on local retail economies, including what consumers buy, who they buy from, the location of stores and jobs, consumer welfare, and consumption inequality. We find that the current state of online retail does not just reflect an “acceleration” of pre-pandemic trends, but for some consumers and sectors, a level shift in the intensity and broadness of online retail that shows no signs of reversing.
Policymakers should consider whether they may need to adjust policies made prior to the pandemic, or implement new policies, given the new state of online retail. Relevant policy areas include:
Online retail was part of the story of overall economic growth years before the COVID pandemic and has become increasingly important since. Policymakers should understand how online retail is changing to better ensure equitable and inclusive opportunities for growth.
Figure 9: Online product use prior to the pandemic was similar for consumers who are male or female, though consumers who are female shop more for groceries online
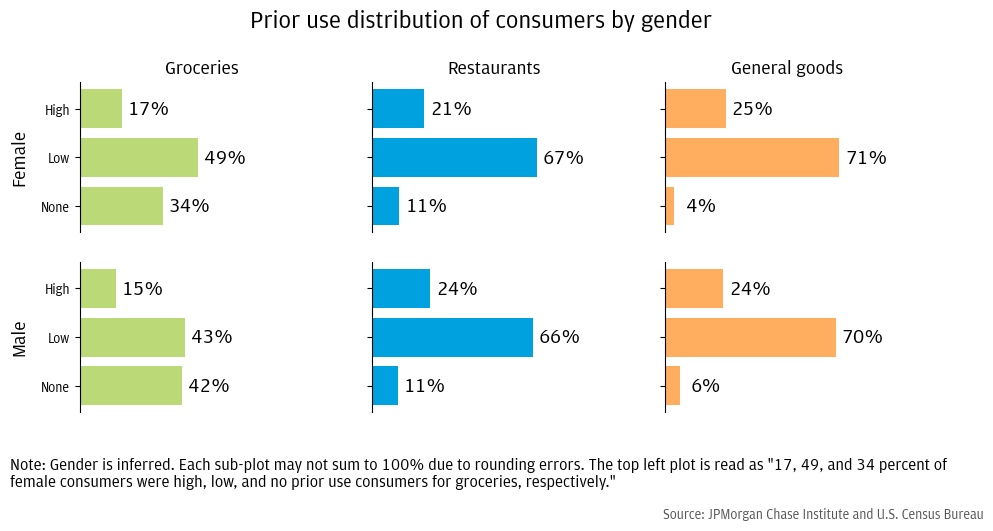
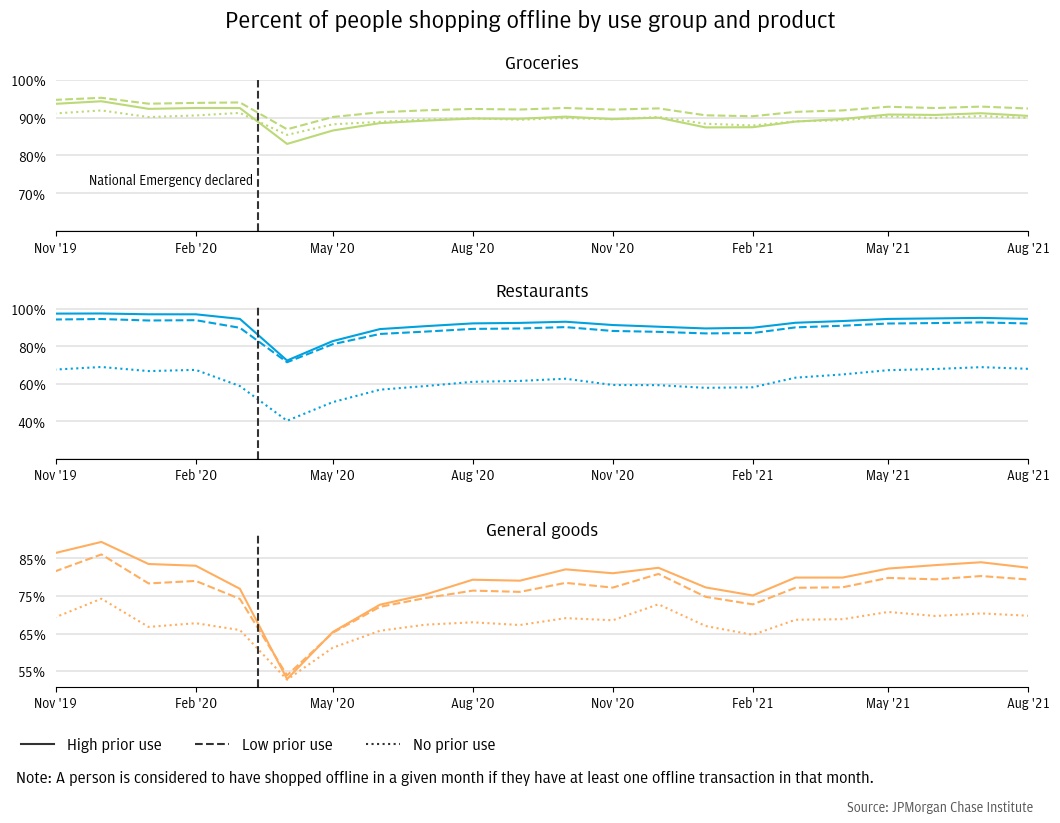
Figure 10: People who did more online shopping pre-pandemic were less likely to shop offline each month for the same goods post-pandemic
As calculated using unadjusted figures between Q2 2020 and Q2 2019.
In recent JPMorgan Chase Institute research, Household Finances Pulse: Cash Balances during COVID-19, household cash balances were 50% higher in July 2021 than July 2019 (Greig, Deadman and Sonthalia 2021).
In The Early Impact of COVID-19 on Local Commerce, groceries, restaurants, and general goods grew 108%, 12%, and 20% year-over-year in March 2020 (Farrell, et al. 2020).
People who do not benefit from larger online markets through consumption may do so through other channels, such as wage and job growth. A report from the Progressive Policy Institute makes this point (Mandel 2017).
These issues may be particularly salient for the restaurant industry, in which small businesses on thin project margins are prevalent, and pandemic-related fee restrictions on online platforms are set to expire. A recent New York Times article, “A Pandemic Lifeline for Restaurants, Delivery is ‘Here to Stay’” discusses these issues (Conger 2021).
Consumers included in the panel make at least 10 card transactions across their associated credit and debit cards in every month of the sample window.
Examples of small general goods merchants include book shops and florists. Larger merchants include wholesale club and department stores.
The most recent COVID-19 Community Mobility Report for the US shows that retail and recreation mobility is down 6 percent compared to the pre-pandemic baseline (Google 2021).
For example, in a 2019 industry survey from the Food Marketing Institute, consumers perceived perishable products, like produce, to be higher quality in-store than online (Markenson, Feit and Fikes 2019)
People with low pre-pandemic consumption of online groceries are an exception. The median amount spent a month for this group stays at zero for the duration of the series.
Studying a period prior to the pandemic, Relihan (Relihan 2021) shows that the adoption of online grocery platforms leads consumers to increase their spending on other online products.
Income and racial composition are derived from ZCTA level 2019 5-year ACS data. Gender is inferred.
This is most likely due to income effects, as previous results show that high prior use in each online product is concentrated in high-income neighborhoods.
We also observe the percent of people shopping offline for each product declining during the pandemic. Results in the appendix. The extent of the effect by prior use differs by product market. The high prior users in online groceries are the least likely to shop offline for groceries in the pandemic, while the opposite is true for restaurants and general goods. This points to some interesting variation in effects across how much people are spending online and how often. We leave untangling these further to future work.
Bakos, Yannis J. 1997. "Reducing Buyer Search Costs: Implications for Electronic Marketplaces." Management Science 43 (12): 1676-1692.
Barr, Alistair. 2014. "Delivery start-up Instacart follows rain to Philly." USA Today, February 18.
Conger, Kate. 2021. "A Pandemic Lifeline for Restaurants, Delivery Is ‘Here to Stay." New York Times, July 02.
Dolfen, Paul, Liran Einav, Peter J. Klenow, Benjamin Klopack, Jonathan D. Levin, Laurence Levin, and Wayne Best. 2019. "Accessing the Gains from E-Commerce." NBER Working Paper No. 25610.
Farrell, Diana, Chris O. Wheat, and Carlos Grandet. 2019. Place Matters: Small Business Financial health in Urban Communities. JPMorgan Chase Institute.
Farrell, Diana, Chris O. Wheat, and Chi Mac. 2020. A Cash Flow Perspective on the Small Business Sector. JPMorgan Chase Institute.
Farrell, Diana, Chris O. Wheat, Marvin M. Ward Jr, and Lindsay E. Relihan. 2020. The Early Impact of COVID-19 on Local Commerce. JPMorgan Chase Institute.
Forman, Chris, Anindya Ghose, and Avi Goldfarb. 2009. "Competition between local and electronic markets; How the benefit of buying online depends on where you live." Management Science 55 (1): 47-57.
Ganning, Joanna P., and Timothy Green. 2021. "The online marketplace: Zero-order city or new source of social inequality." Growth and Change 52 (3): 1251-1270.
Google. 2021. COVID-19 Community Mobility Report: United States November 4, 2021. Google.
Grant, Jill. 2002. "Mixed Use in Theory and Practice: Canadian Experience with Implementing a Planning Principle." Journal of the American Planning Association 68 (1): 71-84.
Greig, Fiona, Erica Deadman, and Tanya Sonthalia. 2021. Household Finances Pulse: Cash Balances during COVID-19. JPMorgan Chase Institute.
Jaravel, Xavier. 2019. "The Unequal Gains from Product Innovations: Evidence from the U.S. Retail Sector." Quarterly Journal of Economics 715-783.
Jin, Ginger Zhe, and Andrew Kato. 2007. "Dividing Offline and online: A Case Study." The Review of Economic Studies 74 (3): 981-1004.
Jingting, Fan, Lixin Tang, Weiming Zhu, and Ben Zou. 2018. "The Alibaba effect; Spatial consumption inequality and the welfare gains from e-commerce." Journal of International Economics 114: 203-220.
Jo, Yoon J, Misaki Matsumura, and Davie E Weinstein. 2019. "The Impact of E-Commerce on Relative Prices and Consumer Welfare." NBER Working Paper No. 26506.
Mandel, Michael. 2017. How Ecommerce Creates Jobs and Reduces Income Inequality. Progressive Policy Institute.
Markenson, Steve, David Emerson Feit, and David Fikes. 2019. U.S. Grocery Shopper Trends: A Look at Today's Grocery Shopper. Food Industry Association.
Relihan, Lindsay. 2021. "Is Online Retail Killing Coffee Shops? Estimation the Winners and Losers of Online Retail using Customer Transaction Microdata." Working Paper.
Rosenthal, Stuart S., William C. Strange, and Joaquin Al. Urrego. Forthcoming. "Are City Centers Losing Their Appeal? Commercial Real Estate, Urban Spatial Structure, and COVID-19." Journal of Urban Economics.
Sinai, Todd, and Joel Waldfogel. 2004. "Geography and the Internet: Is the Internet a Substitute or a Complement for Cities." Journal of Urban Economics 56 (1): 1-24.
Thomas, Quan W., and Kevin R. Williams. 2018. "Product variety, across-market demand heterogeneity, and the value of online retail." RAND Journal of Economics 49 (4): 877-913.
U.S. Census Bureau. 2021. Quarterly E-Commerce Report. https://www.census.gov/retail/ecommerce/historic_releases.html.
We thank Maya Sokoletsky for her substantive contributions to the execution and direction of this research. Additionally, we thank Emily Rapp, Robert Caldwell, and Anthony Rivera for their support in the production and outreach for this research.
We would like to acknowledge Jamie Dimon, CEO of JPMorgan Chase & Co., for his vision and leadership in establishing the Institute and enabling the ongoing research agenda. We remain deeply grateful to Peter Scher, Vice Chairman, Demetrios Marantis, Head of Corporate Responsibility, Heather Higginbottom, Head of Research & Policy, and others across the firm for the resources and support to pioneer a new approach to contribute to global economic analysis and insight.
This material is a product of JPMorgan Chase Institute and is provided to you solely for general information purposes. Unless otherwise specifically stated, any views or opinions expressed herein are solely those of the authors listed and may differ from the views and opinions expressed by J.P. Morgan Securities LLC (JPMS) Research Department or other departments or divisions of JPMorgan Chase & Co. or its affiliates. This material is not a product of the Research Department of JPMS. Information has been obtained from sources believed to be reliable, but JPMorgan Chase & Co. or its affiliates and/or subsidiaries (collectively J.P. Morgan) do not warrant its completeness or accuracy. Opinions and estimates constitute our judgment as of the date of this material and are subject to change without notice. The data relied on for this report are based on past transactions and may not be indicative of future results. The opinion herein should not be construed as an individual recommendation for any particular client and is not intended as recommendations of particular securities, financial instruments, or strategies for a particular client. This material does not constitute a solicitation or offer in any jurisdiction where such a solicitation is unlawful.
Wheat, Chris, James Duguid, Lindsay E. Relihan, and Bryan Kim 2021. “The COVID Shock to Online Retail: The persistence of new online shopping habits and implications for the future of cities.” JPMorgan Chase Institute. https://www.jpmorganchase.com/insights/community-development/covid-shock-to-online-retail
Authors

Chris Wheat
President, JPMorganChase Institute

James Duguid
Former Research Lead, JPMorganChase Institute

Lindsay Relihan
JPMorgan Chase Institute Academic Fellow

Bryan Kim
Research Engineer, JPMorgan Chase Institute