
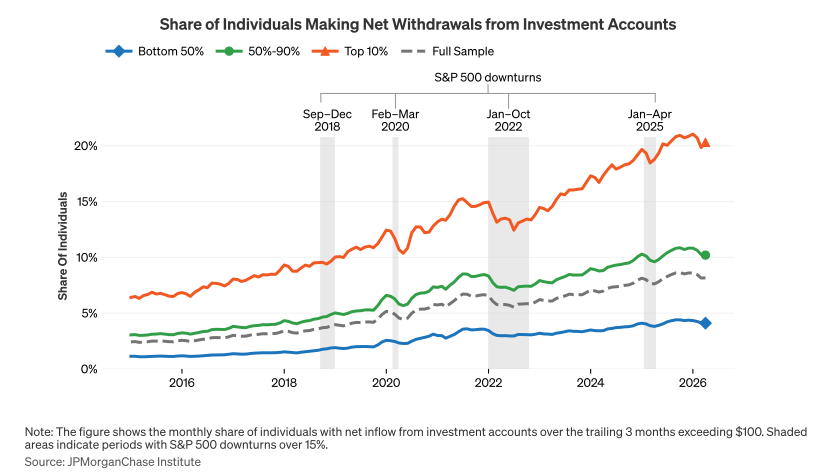
Figure 1: Share of individuals tapping investment accounts rises across income groups.

Creating thriving communities together
See how our clients and partners—from small business owners to workforce training leaders—work with JPMorganChase to drive meaningful impact and economic growth where they live and work.
Learn moreLatest news

Veteran’s Unconventional Path to Landing her Dream Job in Tech
U.S. Army Veteran Ashley Wigfall transitioned to a civilian role and charted her path to technologist through mentorship and skills training at the JPMorgan Chase tech hub in Plano, Texas.
Learn more
Research
September 17, 2026
People appear to be spending more as their stock market wealth grows, but it’s hard to tell from public data exactly who is spending more and by how much. To get a clearer picture, this report looks at money people move from investment accounts into checking accounts, where it can be spent. We find that the share of people making net withdrawals from their investment accounts has doubled since 2019. These withdrawals grew from the equivalent of 3.5% of total spending in April 2019 to 6.8% in April 2026. Higher-income people aged 65 and older are leading the rise, but withdrawals have increased across all age and income groups.
The analysis provides indicators consistent with a significant increase in the role of investment wealth in funding consumer spending. Links between financial markets and the real economy may be stronger than in the past, and asset prices may play a larger role in both retirement security and inequality. This evolving landscape suggests that policy efforts to expand access to tax-advantaged investment programs—such as Trump Accounts and Trump IRAs—are joining a trend that has significant momentum.
U.S. households’ stock market holdings have risen to all-time highs, making up nearly one-third of total household assets as of the first quarter of 2026, roughly double their share at the start of the 2010s.1 Much of the recent growth in household financial wealth has been driven by strong stock market gains. This may help explain why macroeconomic measures of consumer spending remain elevated relative to incomes, as implied by indicators like the savings rate or the consumption-income ratio.2
Federal Reserve policymakers have pointed to rising asset values as a reason for optimism about the resilience of consumer spending, although questions remain around the timing and extent of pass through from markets to spending.3 Media attention has emphasized wealth inequality and an economy increasingly driven by the spending of high-income households—the so-called “K-shape” pattern—though views differ on how consumer segments are faring.4 Both debates rest on public data that can only go so far: They can tell us how much wealth households hold in the stock market, but inference on how cash flows moving out of those assets support spending and for whom requires additional assumptions.5 Our data help close this gap by answering a concrete question focused on cash flow: How much are different groups of people drawing down investments to fund spending?
This report addresses this question using de-identified data covering checking accounts of over 20 million Chase customers from 2015 to 2026.6 The recent share of individuals moving money from investment accounts to checking accounts is double the level seen in 2019 and triple that of 2015. A larger portion of aggregate spending relies on these flows, increasing from 2.3 percent in 2015 to 3.5 in 2019 and reaching 6.8 percent in 2026. High-income and older individuals made up a disproportionate share of this trend.
Notably, this increase in withdrawals from investment accounts by some mirrors an increase in transfers to investment accounts by others over the same timeframe.7 Gross flows to and from investment accounts have risen. By netting flows at the individual level, we draw a distinction between those accumulating financial assets and a separate population making net withdrawals from investment accounts. Older individuals are much more likely to spend out of their wealth on a net basis, consistent with intuitive life-cycle patterns. While it is not new for older cohorts to sell financial assets that younger cohorts acquire, the rise in two-way flows suggests that investment accounts are becoming a more active and relevant part of people's financial lives across the lifecycle.
Policymakers can use these findings to better understand evolving drivers of consumer spending, particularly with respect to the decline in the personal savings rate in recent years.8 The analysis provides indicators consistent with a significant increase in the role of investment wealth in funding consumer spending, suggesting that the link between financial markets and the real economy may be stronger than in the past. Additionally, asset prices may play a larger role in both retirement security and inequality. Higher stock market prices can boost the wealth of those selling assets today, such as retirees who own a lot of them, but do little for people with few assets, often younger generations accumulating assets at increasing valuations.9
Figure 1 shows how the share of the population withdrawing from investments evolved from January 2015 to April 2026. It plots the number of individuals with net flows from investment accounts to deposit accounts over trailing 3-month periods divided by the number of active account users in the sample. By this measure, 8.2 percent of people withdrew money from investments, on net, over February-April 2026, up from 4.0 percent over the same period of 2019 and 2.4 percent in 2015. High-income individuals are much more likely to use investments to support spending.10 For example, the share from the top income segment rose from 6.6 percent over February-April 2015 to 20.3 percent over February-April 2026, compared with a rise from 1.1 percent to 4.1 percent among those below the median. The upward trend experiences three noticeable interruptions that correspond to periods of stock market declines: February–March 2020, January–October 2022, and January–April 2025. However, the series were relatively stable during an earlier downturn, September–December 2018, suggesting that stock market declines do not always interrupt withdrawal decisions.11
Traditional economic theory predicts a “wealth effect”: When investment wealth rises, households tend to increase spending relative to current income.12 In our data, most spending ultimately shows up as outflows from checking accounts (card payments, bill pay, cash withdrawals, and other payment debits). That creates a basic accounting implication: If a household’s checking outflows rise faster than non-investment inflows (e.g., take-home pay), the difference must be covered either by drawing down existing checking balances or by bringing in funds from elsewhere—notably, transfers from investment accounts. When we refer to “funding spending with investment wealth,” we mean a rising share of spending through the latter mechanism: Spending in excess of non-investment income that is financed by transfers from investment accounts into checking. Checking balances are small relative to spending (cash covers about 2–3 weeks of outflows for the median individual) and remain close to their pre-pandemic trend, suggesting that the sustained rise in investment inflows is being used to support ongoing spending outflows rather than building liquid buffers.13
Figure 2 plots, by income segment, the share of consumer spending funded by investment flows from January 2015 through April 2026. We measure investment flows by netting transfers between investment and checking at the individual level and counting only net flows to checking accounts (inflows are set to zero for those with net outflows). All spending, including those of non-investors, appears in the denominator. The proxy for spending is checking account outflows excluding transfers between an individual’s accounts. This construction isolates the gross amount of spending supported by investment assets, rather than capturing overall net saving through investing (see Appendix for details).
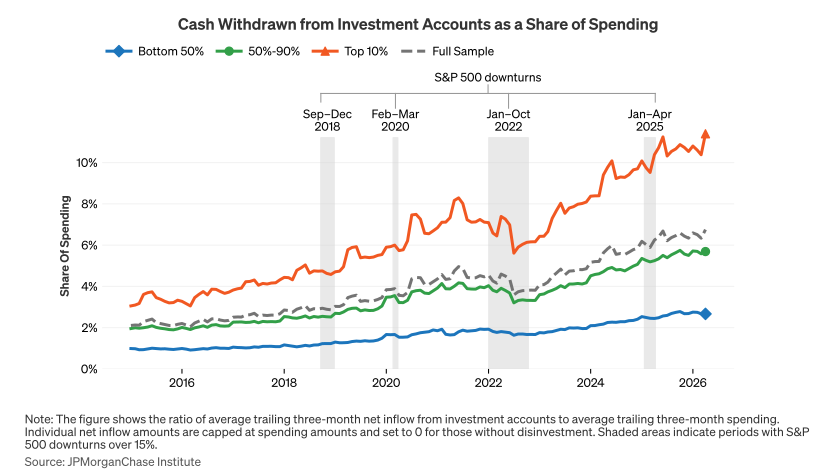
Paralleling the view in Figure 1, investment flows increased relative to spending both before and since the pandemic. Transfers into checking accounts as a share of spending rose from 2.3 percent in April 2015 to 3.5 percent in April 2019. The measure extended its rise in recent years, reaching 6.8 percent in April 2026. Among higher-income individuals, the share exceeded 10 percent every month in 2026, up from an average of under 4 percent in 2015. The most significant interruption in the broad increasing trend appears alongside the 2022 stock market decline across all income groups.
Households on average tend to accumulate financial assets during their working years and draw them down in retirement to smooth consumption over time.14 This framework suggests wealth decumulation should be most pronounced among older individuals, especially those with higher lifetime earnings and greater accumulated wealth. The ongoing shift from defined-benefit pensions to defined-contribution plans shifts the source of retirement income to investment assets, potentially contributing to growth in these flows among retirees.15
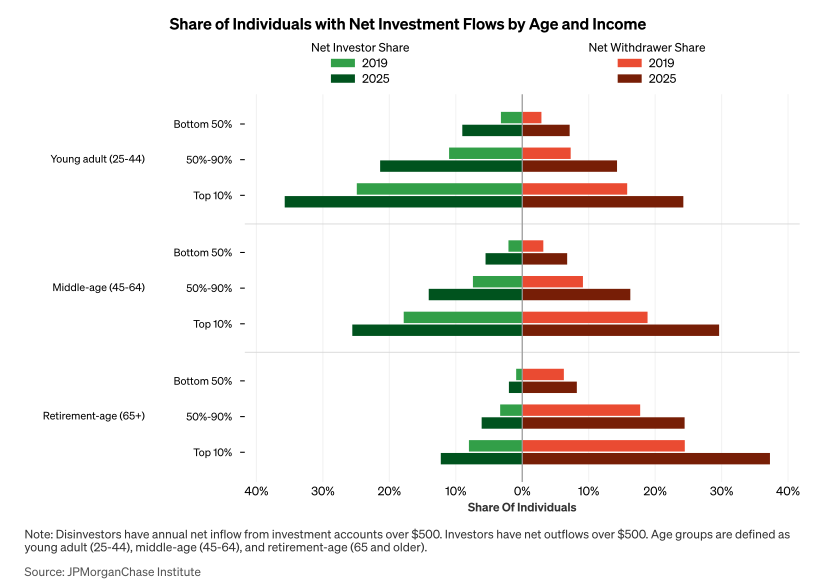
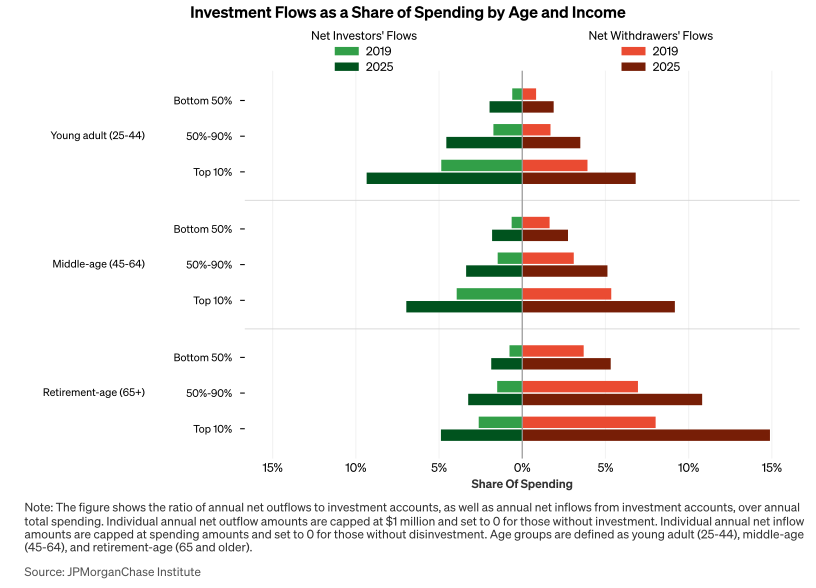
The two panels of Figure 3 show the extent of tapping investments across age and income groups, as a share of the population (Panel A) and scaled to total spending (Panel B). The largest increases in percentage point terms were among older and higher-income individuals. For retirees (65 and over), the share of top earners with net inflows rose 13 percentage points to 37 percent, and the share of spending for the group rose 7 percentage points to 15 percent. The percentage point increases were lower in lower-income and younger age groups, but there were substantial increases in other groups. For example, the share of 25-44-year-olds with below-median incomes moving money from investments to support spending doubled, albeit from a low base, to 7 percent.
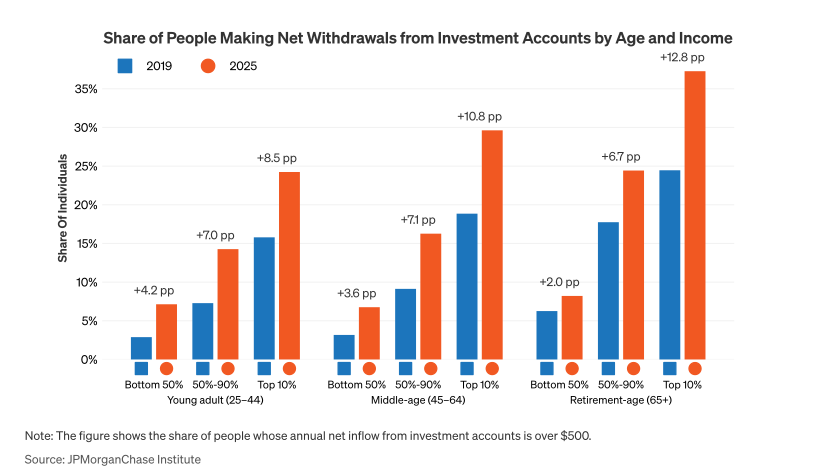
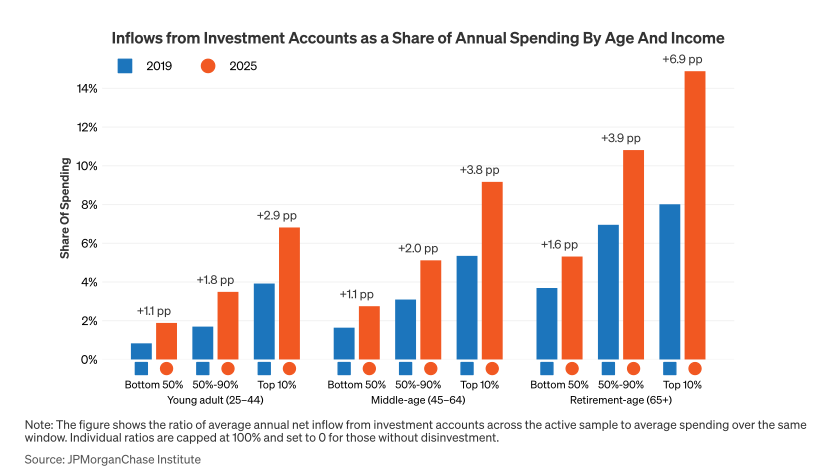
While older generations have driven much of the aggregate increase in using investment assets to support spending, the share of younger individuals pulling in money is also notable. Among the top-earners, almost one in four individuals aged 25-44 did so in 2025, and those flows accounted for almost 7 percent of the group’s spending.
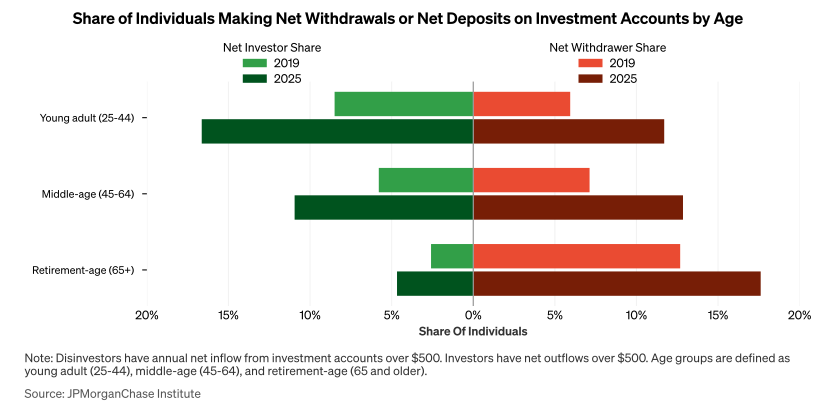
In Figure 4, the view above is extended by including people adding money to investment accounts on net on the left, while the right side shows people withdrawing money from investment accounts on net. The prevalence of net investors rose alongside a rise in the share of those net withdrawing, in each age and income group. The balance shifts with age: Young individuals are more likely to add money to investments on net, while retirees are more likely to decumulate assets.16 This directionally aligns with the life cycle pattern described in the prior finding, although it doesn’t capture all forms of investing. Appendix Figures A1 and A2 provide more detailed breakouts by age and income groups and scales investment flows to spending.
The share of people who are decumulating investment wealth to support spending has been rising for a decade, and the trend has deepened significantly since 2023. Those with high incomes and older individuals have contributed most to the rise. The deepening two-way cash flows—with younger individuals leading growth in investing and older individuals in tapping those assets—suggests a broadening population using financial assets throughout their savings and wealth accumulation cycle. Beneath this average pattern by age, a growing portion of younger individuals are also using investment wealth to fund spending.
The rise in investing flows suggests a deeper link between investment wealth and consumer spending. The interruption of the upward trend in flows alongside stock market declines, such as in 2022, suggests a sensitivity to market conditions. The state of financial markets may matter more for consumer spending than they did in the past.
These findings can also support a broader understanding of the drivers of the low level of the aggregate savings rate. While we focus on gross measures, the increase in withdrawing money from investments to spend more is consistent with downward pressure on savings, as the flows support spending beyond other income sources. The demographic breakdown—higher inflows among high-income and older individuals—aligns with intuition about the segments of the population that have benefited the most from years of stock market gains. Increases in intergenerational wealth transfers, stock-based compensation, or the use of investments to finance more expensive home purchases or smooth consumption may be contributing to growth in individuals’ use of investment assets long before retirement.
Finally, the rise in retail investing and decline in defined-benefit retirement plans mean that individuals increasingly control their own wealth accumulation and decumulation throughout their working years and in retirement. As a result, a larger share of spending and retirement security is a function of market performance and financial discipline.
For each segment and 3-month window, we first compute net flows between investment accounts and checking at the individual level (inflows from investment accounts minus outflows to investment accounts). We then apply a floor at zero. Because individuals with net outflows are assigned a net investment inflow of zero, the measure captures only the extent to which investment accounts are a source of funds for spending in that period and does not subtract out the funds other individuals are moving into investments. Individual-level netting helps remove a potential source of upward bias that could occur, for example, in cases in which a person is using their checking account to move money across two different investment accounts (investment inflows would coincide with investment outflows, with no net funding to the checking account). We aggregate these nonnegative net inflows and divide by total checking-account outflows to produce the ratio shown in Figure 2.
Importantly, the measure should be interpreted as a gross flow estimate that uses individual-level netting to remove churn that doesn’t ultimately contribute to spending power. Outflows to investment accounts have also increased substantially (shown in Figure A1 and A2 and discussed in Wheat and Eckerd, 2025). Additional investments may occur directly out of gross pay (e.g., via employer-sponsored retirement contributions or employee stock purchase plans), which are not fully observable without strong assumptions. For that reason, we do not directly compute net-flow estimates in this report.
Ando, Albert, and Franco Modigliani. 1963. “The ‘Life Cycle’ Hypothesis of Saving: Aggregate Implications and Tests.” American Economic Review 53 (1): 55–84.
Beach, Samara, William Gamber, and Patrick Moran2025. "Wealth Heterogeneity and Consumer Spending," FEDS Notes. Washington: Board of Governors of the Federal Reserve System, August 05, 2025, https://doi.org/10.17016/2380-7172.3838
Crawley, Edmund, and William Gamber. 2023. "Winners and losers from recent asset price changes," FEDS Notes. Washington: Board of Governors of the Federal Reserve System, May 12, 2023, https://doi.org/10.17016/2380-7172.3287
Deaton, Angus. 2005. “Franco Modigliani and the Life Cycle Theory of Consumption.” Princeton University. https://www.princeton.edu/~deaton/downloads/romelecture.pdf
Guvenen, Fatih, Greg Kaplan, Jae Song, and Justin Weidner. 2022. "Lifetime Earnings in the United States over Six Decades." American Economic Journal: Applied Economics 14 (4): 446–79.
Friedman, M. 1957. A Theory of the Consumption Function. Princeton University Press.Modigliani, Franco, and Richard Brumberg. 1954. “Utility Analysis and the Consumption Function: An Interpretation of Cross-Section Data.” In Post-Keynesian Economics, edited by Kenneth K. Kurihara, 388–436. New Brunswick, NJ: Rutgers University Press.
Poterba, J. M. 2000. “Stock Market Wealth and Consumption.” Journal of Economic Perspectives, 14 (2), 99–118.
Wheat, Chris, George Eckerd. 2023. “Household Cash Buffer Management from the Great Recession through COVID-19.” JPMorgan Chase Institute. https://www.jpmorganchase.com/insights/all-topics/financial-health-wealth-creation/household-cash-buffer-management-from-the-great-recession-through-covid-19
Wheat, Chris, George Eckerd, Daniel M. Sullivan, and Erica Deadman. 2025. “Real income sustains weak trend, while cash liquidity remains stable.” JPMorganChase Institute. https://www.jpmorganchase.com/institute/all-topics/financial-health-wealth-creation/real-income-sustains-weak-trend-cash-liquidity-remains-stable
Wheat, Chris, and George Eckerd. 2025. “A decade in the market: How retail investing behavior has shifted since 2015.” JPMorganChase Institute. https://www.jpmorganchase.com/institute/all-topics/financial-health-wealth-creation/a-decade-in-the-market-how-retail-investing-behavior-has-shifted-since-2015
We are thankful to the many people who made essential contributions to this research. We are indebted to our internal partners and colleagues who support delivery of our agenda in a myriad of ways, and we acknowledge their contributions to all of our work.
This material is a product of JPMorganChase Institute and is provided to you solely for general information purposes. Unless otherwise specifically stated, any views or opinions expressed herein are solely those of the authors listed and may differ from the views and opinions expressed by J.P. Morgan Securities LLC (JPMS) Research Department or other departments or divisions of JPMorgan Chase & Co. or its affiliates. This material is not a product of the Research Department of JPMS. Information has been obtained from sources believed to be reliable, but JPMorgan Chase & Co. or its affiliates and/or subsidiaries (collectively J.P. Morgan) do not warrant its completeness or accuracy. Opinions and estimates constitute our judgment as of the date of this material and are subject to change without notice. No representation or warranty should be made with regard to any computations, graphs, tables, diagrams or commentary in this material, which is provided for illustration/reference purposes only. The data relied on for this report are based on past transactions and may not be indicative of future results. J.P. Morgan assumes no duty to update any information in this material in the event that such information changes. The opinion herein should not be construed as an individual recommendation for any particular client and is not intended as advice or recommendations of particular securities, financial instruments, or strategies for a particular client. This material does not constitute a solicitation or offer in any jurisdiction where such a solicitation is unlawful.
Federal Reserve, Z.1 Financial Accounts of the United States.
Beach, Gamber, and Moran (2025) discuss the connection between wealth and the consumption-to-income ratio. The savings rate as of July 2026 was 3.0 percent (estimated in the July release). Over 2019 it averaged over 7 percent. (FRED ticker: PSAVERT)
See discussion by President Goolsbee and Governor Waller referenced in Barron’s, “Fed’s Goolsbee Warns AI Could Produce Stagflation” (May 9, 2026). Former Fed Chair Powell in the October 2025 FOMC press conference referenced stock market wealth as a factor contributing to spending but noted factors that may dampen the effect.
For example, see press reports: Axios, “Economists are questioning the K-shaped narrative” (February 2026) and Wall Street Journal, “The U.S. Economy Depends More Than Ever on Rich People” (February 2025).
The Federal Reserve’s Financial Accounts (the Z.1 release) tracks both financial wealth and flows—but not the destination of the funds—at the economy-wide level. The Distributional Financial Accounts add breakdowns by wealth, income, and age—but only for asset holdings, requiring assumptions to infer how much may reach households' spendable balances.
In addition to spending, the flows to checking accounts might be used to increase checking account balances or pay down debt, as opposed to spending. However, median cash balances were largely stable as of 2025 after having declined from their pandemic peak. Meanwhile, credit balances have continued to rise in recent years, according to the New York Fed’s Household Debt and Credit Report (May 2026).
Wheat and Eckerd (2025).
The aggregate personal savings rate in the U.S. declined to 3.0 percent as of May 2026, near multi-decade lows. (FRED ticker: PSAVERT)
Crawley and Gamber (2023) discuss how asset price changes can affect the population unevenly. Note, valuation metrics vary depending on the fundamentals used to normalize price: e.g., trailing or future expected earnings, etc. For example, the frequently cited Cyclically Adjusted Price to Earnings Ratio produced by economist Robert Shiller—which normalizes price to a long-term trailing average of corporate profits—is elevated relative to historical norms, but investors expecting future profits to grow more quickly than in the past may discount such a metric.
We group individuals by income according to their average age-adjusted income rank over time—a window of at least four years. By ranking individuals relative to others of the same age, income groups have approximately the same average age, as opposed to a static nominal income cutoff in which early-career individuals would tend to be ranked as lower income. Our method seeks to approximate individuals’ lifetime income, as discussed in Guvenen et al. (2022). For example, among 40- to 49-year-olds in 2025, annual incomes are roughly $67,300 at the median and $194,100 at 90th percentile; among 25-to-34-year-olds, the figures are $54,600 and $133,000, respectively.
See Wheat and Eckerd (2024) for statistical analysis of the correlation between stock market price action and flows to investment accounts.
This topic has a large and long-standing literature on the relationship between wealth and household consumption. Friedman (1957) provides the overarching framework linking consumption to total lifetime financial resources, while Poterba (2000) and subsequent work apply both theory and empirical analysis to quantify stock market wealth effects on consumer spending.
Wheat et al. (2025) and Wheat and Eckerd (2023) cover the dynamics of cash liquidity over this period.
See Deaton (2005) for an overview of the life-cycle theory literature, beginning with Modigliani’s contributions (Modigliani and Brumberg 1954; Ando and Modigliani 1963).
Access to defined benefit pension plans among private sector employees fell from 30.1% in 1984 to 11.1% in 2023, while access to defined contribution plans rose from 12.0% to 47.7% over the same period (Congressional Research Service, “Trends in Access to Defined Benefit and Defined Contribution Pension Plans,” IF12007, May 2023, https://www.congress.gov/crs-product/IF12007).
The data used in this analysis relies on checking account transactions—we do not see funds invested through payroll withholdings, such as through employer-sponsored retirement plans.

Chris Wheat
President, JPMorganChase Institute

George Eckerd
Wealth and Markets Research Director, JPMorganChase Institute

Melissa O’Brien
Research Vice President for Wealth and Markets, JPMorganChase Institute
Media Contact
Shelby Wagenseller,
Shelby.Wagenseller@jpmchase.com