

Figure 1: Resilience to unexpected disaster expenses is strongly correlated with income
Latest news

An Ohio-based company is protecting first responders around the world
With support from JPMorganChase, Fire-Dex is providing protective equipment to firefighters in 100 countries and all 50 states.
Learn moreLatest news

Veteran’s Unconventional Path to Landing her Dream Job in Tech
U.S. Army Veteran Ashley Wigfall transitioned to a civilian role and charted her path to technologist through mentorship and skills training at the JPMorgan Chase tech hub in Plano, Texas.
Learn more
Research
May 20, 2026
Natural disasters disrupt the finances of millions of Americans every year, and many people do not have enough savings to weather disaster-related expenses. Various government programs, including cash payments given directly to households, help relieve some of the financial strain. Most relief is funded by the federal government, and policymakers have debated moving more responsibilities to the states to incentivize preventative action to mitigate disaster costs and thus reduce total spending in the long run. However, many states would struggle to take on even part of the fiscal responsibility of these programs without somehow reducing the short-term costs. Reducing a program’s budget without leaving households financially vulnerable requires understanding how relief payments affect different groups in the days immediately after a disaster—detail that annual surveys of county- or state-level statistics can’t capture well.
To help solve this problem, we track households’ savings, spending, and income in the weeks before and after Hurricane Ida struck Louisiana in 2021 and measure the effectiveness of the Critical Needs Assistance program, which provided cash relief payments directly to households after the storm. We find that:
These findings suggest that relief payments significantly help low-income households after a disaster, but payments are less impactful for high-income households. An income cap for such payments could greatly reduce total government expenditures without significantly increasing households’ financial hardship. However, because the speed of relief is also important, new eligibility requirements will be most effective if they do not delay the delivery of relief to the households who need them most.
In 2024, natural disasters affected the finances of 8 percent of adults in the United States in a moderate or substantial way.1 Natural disasters can disrupt people’s incomes and create unexpected expenses that drain people’s savings.
While federal and state governments maintain several programs to provide disaster stricken areas with relief,2 most funding comes from the federal government,3 which spent more than $50 billion on disaster recovery between 2021 and 2025.4 Policymakers have long debated whether more of the fiscal burden of these programs should be shifted to state and local governments: when states and localities bear the fiscal cost of rebuilding, disaster preparation and mitigation efforts are more effective, which reduces the long-run costs of disaster relief.5 Projected shortfalls in federal disaster funding, caused in part by inflation and increased disaster expenses, have added urgency to that debate.6
One of the main points of debate is whether states can fit these relief programs into their budgets.7 This is a particular problem for smaller states that have limited budgets while also facing regular large disasters like hurricanes. In the long run, states can reduce disaster relief costs in several ways, including changes to building regulations and ongoing investments in disaster mitigation. In the short run, they can reduce relief costs directly by targeting relief more effectively to those who need it most.
To reduce disaster relief costs without leaving households financially vulnerable, policymakers must understand exactly how disaster relief helps different groups. However, annual data like that collected by the Census Bureau cannot measure what happened in the days and weeks around a disaster, just as county- or state-level data can’t reveal how different neighborhoods in a city responded differently.8
To solve this problem, we use de-identified, administrative banking data from Chase to measure the financial lives of 250,000 households in Louisiana in the aftermath of Hurricane Ida, tracking savings, spending, and income in the weeks before and after the storm.9 We can also identify which households lived in more severely affected neighborhoods and whether households received a Critical Needs Assistance (CNA) payment of $500. CNA is a fixed cash benefit within the Individual Assistance program and is meant for immediate recovery needs, such as evacuation costs and the essential goods like food and medicine.10 These payments were the primary grant payments made directly to approximately 500,000 households immediately after the hurricane and incurred an estimated cost of $250 million.11
We find that:
These findings have several important implications. First, direct relief payments are critical for low-income households, who are less likely to have substantial emergency savings and are more likely to have their incomes disrupted. Second, the speed of delivery of relief payments is also very important, as many low-income households appear to be liquidity constrained and depend on relief payments to afford essentials. Third, direct relief payments do not appear to be critically important for high-income households. Finally, because high-income households are not heavily dependent on relief payments, adding an income limit to relief payments may significantly reduce the overall program budget. However, because speed of delivery is key, additional red tape required in the immediate aftermath of a disaster could be costly, and how eligibility is assessed is also important. For example, a state administering a direct payment program may opt not to verify income during the initial application and instead recover payments made to ineligible households through the state income tax filing process.
First, we measure household financial resiliency prior to the storm and how it varies by income and different disaster severity scenarios; specifically, we measure how many households could handle unexpected expenses of $500 or $1,500 at the time of the storm, and we re-assess these figures after adding the $500 CNA payment.
A $500 emergency fund is often cited as the minimum amount of savings to have prior to a disaster, consistent with survey-based findings of average household spending on evacuations (Jiang et al. 2023; Mozumder et al. 2015; Lindell et al. 2011; Winters 2025). As such, we use $500 as a baseline for financial preparedness—how many households in Hurricane Ida’s disaster area could have covered $500 in unexpected expenses at the time of the storm?
However, the magnitude of costs can vary considerably, especially if a household evacuates, and evacuation costs vary by lodging needs, household size, length of evacuation, and whether the evacuation order was voluntary or mandatory (Lamadrid et al. 2025; Mozumder et al. 2015). While studies have shown most households stay with friends and family members, hotel costs can add several hundred dollars a night in addition to other travel, food, and medical expenses (Lindell et al. 2011). To capture this variability, we also consider a scenario where households face $1,500 in unexpected expenses, which is based on estimates of households’ willingness to pay for evacuation (Jiang et al. 2023).
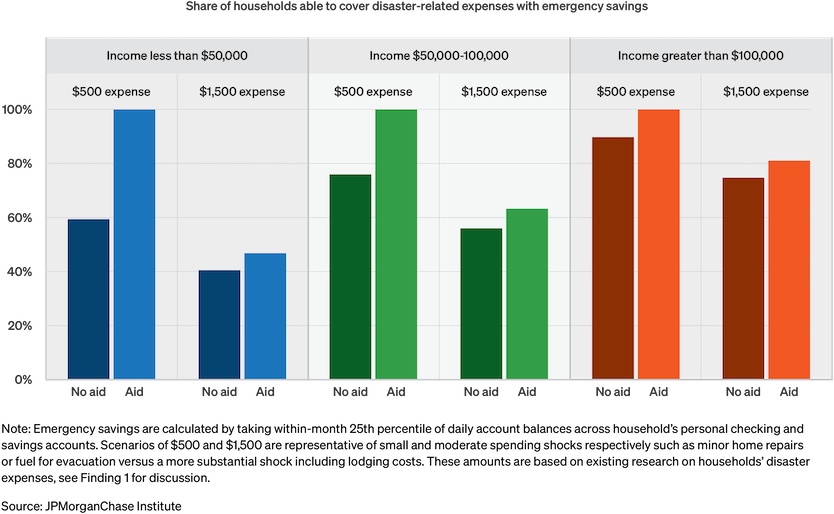
Figure 1 shows what share of households had at least $500 or $1,500 in emergency savings before Hurricane Ida.12 In normal, non-disaster scenarios, households faced with an emergency expense can draw on their emergency savings, their discretionary income, and their available credit (Wheat, Sullivan, and Deadman 2025). However, after a disaster, workers might have their income disrupted, especially hourly workers. Local businesses may not be able to pay their employees on time due to damage from the storm, or they might not be able to give their workers their usual number of hours. Similarly, if a worker evacuated or physically cannot get to work, they won’t get paid. For these reasons, Figure 1 below only considers emergency savings.
Figure 1: Resilience to unexpected disaster expenses is strongly correlated with income
Figure 1 shows that resilience to all types of shocks increases with income. Fifty-nine percent of low-income households have at least $500 in emergency savings, compared to 90 percent among high-income households. Fewer households have $1,500 in emergency savings: 40 percent of low-income households and 75 percent of high-income households. To assess how much CNA relief payments add to resiliency, we simply add $500 to each household’s emergency savings since CNA payments that are quickly disbursed act the same as emergency savings. Because CNA payments for Hurricane Ida were $500, the same as our small shock, all households can cover a $500 hypothetical expense. The CNA payment moderately increases households’ resilience to a $1,500 shock: 46 percent of low-income households are now resilient to this larger shock, a 15 percent increase, while 81 percent of high-income households are now resilient, a 7 percent increase.
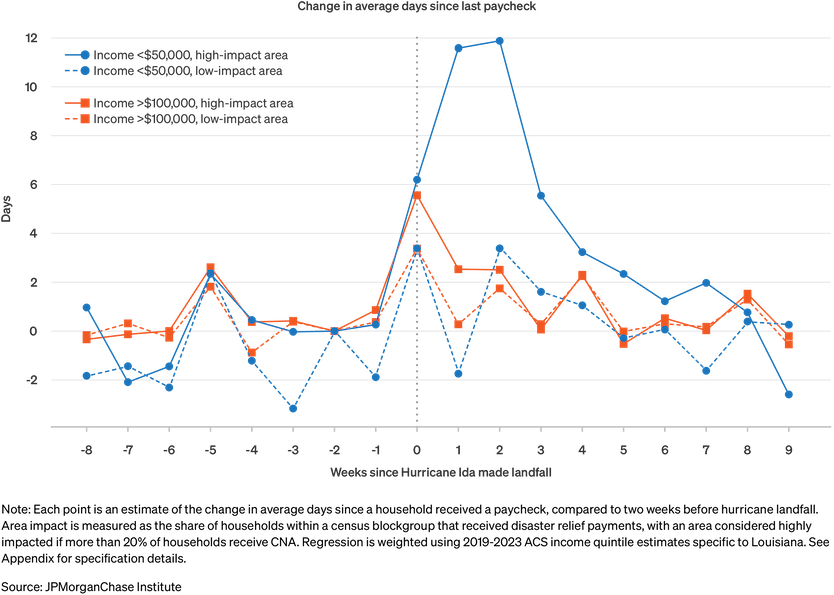
Next, we measure how Hurricane Ida disrupted household incomes by looking at delays in the direct deposit of paychecks.13 If the hurricane caused business closures, infrastructure damage, or household displacement that prevented people from working or prevented business from sending paychecks out on time, we will see those effects in households’ checking account direct deposits. We focus on the region of Louisiana that was officially declared a disaster area and thus qualified for direct relief payments through CNA.14 Because households must submit evidence that the storm physically affected them to receive CNA, we split households into “high-impact” neighborhoods and “low-impact” neighborhoods based on what share of households in the neighborhood received CNA. Specifically, we call Census tracts with a high rate (20% or greater) of CNA recipiency in our data as high impact, while areas with lower rates of recipiency we call low impact.
Figure 2 shows that that lower-income households in high-impact areas faced significant income disruptions for several weeks after Hurricane Ida. Each dot in Figure 2 represents the average number of days since households received their last paycheck, relative to two weeks before Hurricane Ida. For example, a value of 5 would mean that, in the given week, the average household had been without a paycheck 5 days longer than they were two weeks before Hurricane Ida. In the three weeks after landfall, lower-income workers in high-impact areas saw significant increases in the time since their last paycheck, peaking at about 12 days, which did not return to normal for almost two months after landfall. Low-income households in low-impact areas also saw some income disruption, though with a more gradual onset and a return to normalcy within five weeks after landfall. In contrast, high income households in high-impact areas saw much smaller disruptions, which also returned to normal relatively quickly, while those in low-impact areas saw almost no disruptions at all.
Figure 2: Lower-income households in hurricane-impacted areas face the largest and longest income disruptions.
Many households rely on their discretionary income to supplement their emergency savings funds to cover unexpected expenses, and significant income disruptions further weaken households’ ability to cover disaster expenses (Wheat, Sullivan, and Deadman 2025). These income disruptions may also make households more hesitant to use their available credit, including credit cards, for emergency expenses. If someone is not sure their next paycheck will come for several weeks or even months, they may avoid putting accruing credit card balances until they know how quickly they can pay those balances down. Thus, liquidity may be so constrained for low-income households that they delay making essential purchases. The following section evaluates whether households wait for aid to purchase needed items.
To assess whether households are waiting for CNA payments to fund emergency spending, we measure household spending on essential goods (groceries, medicine and healthcare, fuel, and home repairs) in the weeks before and after the hurricane and note the week each household receives its $500 CNA payment. Figure 4 shows weekly spending on essentials, relative to average pre-hurricane spending, separately by the week in which households received aid.15 Households that received their CNA payment in the week after landfall are the “Week 1” group, those that received payment the next week are the “Week 2” group, and so on.
Figure 3: Lower income households are more likely to wait for the week of aid receipt to purchase critical-needs items, including food, home improvement, health, and fuel.
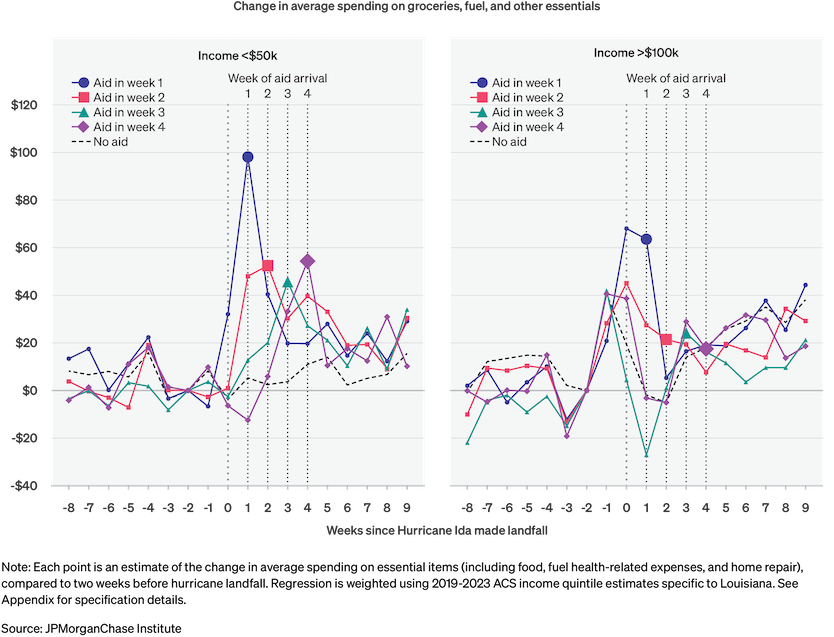
For low-income households, spending spikes in the same week they received their relief payment, suggesting that these households were more likely to wait for aid to arrive to spend money on critical items.16 Low-income households who receive CNA in week after the hurricane have a surge in their spending on critical goods in that same week; those that received CNA two weeks after the hurricane have a surge in spending in the same week, etc.
By contrast, all high-income households increase their spending on essential goods right before Ida made landfall and during the week of landfall itself. This kind of preparatory spending response similar to findings in previous studies (Alandagady 2016; Farrel 2018). Moreover, households with delayed aid receipt have a spending response indistinguishable from the spending of households who did not receive CNA payments. All together, this suggests that CNA acted as a reimbursement for these households rather than alleviating an immediate need.
If high-income households can make essential purchases without the aid of CNA, then policymakers may be able to reduce the overall budget of direct payment programs by reducing payments to these households without increasing financial insecurity among households.
For state governments to shoulder more of the fiscal burden of disaster relief, the budget of some programs may need to be reduced in order to fit in state budgets. Policymakers have long discussed increasing the responsibility of state and local governments to better align the incentives of local decisionmakers. When a state or local government is shielded from the full cost of disaster recovery in its jurisdiction, it has less financial incentive to invest in risk mitigation strategies like disaster-specific infrastructure and zoning reforms (Kousky et al. 2023). This increases the long-run cost of disasters due to under-investment in risk mitigation and preparation.
However, state budgets are small relative to recent disaster-related expenditures, and states are unequally prepared to assume disaster relief obligations. Gulf states in particular could face difficulties in absorbing federal funding into their budgets given they receive significant federal disaster relief allocations.17 For one, states vary in emergency and disaster relief funding appropriations: while most states have a disaster-specific account, annual appropriations vary widely across the country.18 Louisiana’s State Emergency Response Fund is allocated approximately $1 million annually.19 At the same time, California appropriates more than a billion dollars annually to its Special Fund for Economic Uncertainties.20 States also have unequal ability to absorb federal funding: Louisiana would have to increase sales tax revenue by 33%, compared to California who would only have to increase revenue by 2% (see Table 1). While smaller than other disaster relief expenditures, Individual Assistance and in turn CNA costs increase with exposure (i.e., with housing and population density). Hurricane Ida was such a case: by hitting urban areas such as New Orleans and Baton Rouge, IA expenditures were higher relative to other disaster relief programs during other hurricanes. CNA alone had an estimated cost of $250 million, exceeding the state’s average emergency fund appropriations.21
Reducing the budget of certain programs would in turn reduce the difficulty of fitting disaster relief into state budgets. It should also be noted that programs need not be completely shifted to states to increase incentive alignment—cost sharing and other arrangements would also align incentives, but even these changes would stress state budgets.
| Average annual disaster relief funding (2015-2024) | Average funding as share of state spending | Required increase in sales tax revenue to replace federal funding | Disaster funding comparison to other budget items |
|---|---|---|---|---|
Louisiana | $1.4 billion | 6.3% | 33% | Higher education: |
Florida | $2.1 billion | 2.8% | 5% | Florida College System: Agency for Persons with Disability: |
Texas | $1.4 billion | 1.8% | 3% | School safety: Higher education financial aid: |
Mississippi | $67.5 million | 0.5% | 2% | Health department: Rehabilitation services: |
California | $639 million | 0.23% | <1.9% | Department of Veterans Affairs (State Operations and Local Assistance): $588 million |
If disaster relief were fully shifted to states to better align incentives, states could partially offset the added budget pressure by reducing other program spending (e.g., CNA), making state-administered disaster relief more feasible. For programs like CNA that make relief payments directly to households, there are only two ways to directly reduce the overall budget:23 reduce the size of payments or reduce the number of people receiving payments. Both options might significantly reduce households’ financial resilience, depending on the initial size of payments and the initial set of recipients.
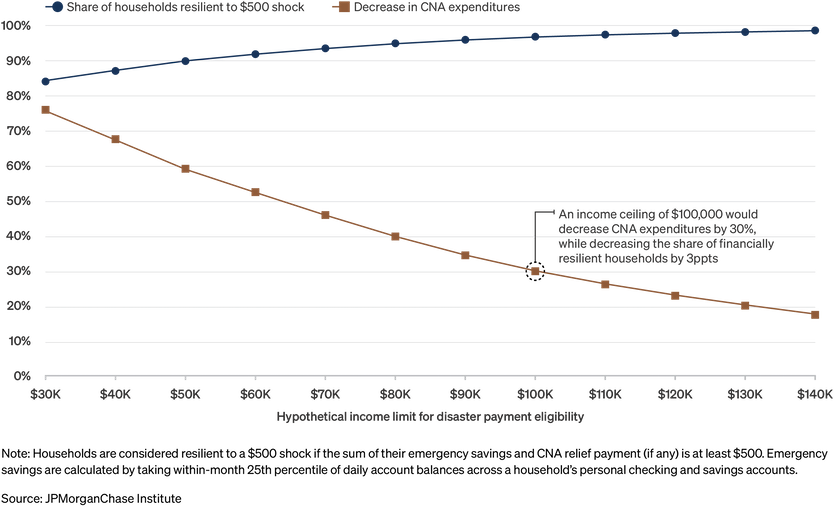
Our findings above suggest that introducing an income limit to CNA payments could potentially reduce the overall budget of the program without significantly increasing financial hardship. CNA was created to address immediate post-disaster needs with minimal administrative friction, helping fund unexpected expenses while households wait for other aid such as payments from private insurance payouts and other disaster relief programs. Our findings above show that CNA leads to significant increases in the financial resiliency of low-income households. As such, reducing the size of CNA payments is likely to reduce financial security. By contrast, higher-income households are more likely to see CNA as a reimbursement of spending they would have done anyway, as they can fund disaster-recovery spending independent of aid receipt.
In Figure 4, we show how hypothetical income limits would have reduced total CNA expenditures and the number of financially secure households. For example, an income ceiling of $100,000 would be decrease CNA program expenditures by 30%, while also decreasing the share of households that have access to $500 immediately after the storm from 100 percent to 97 percent. More aggressive income limits further reduce the budget and the number of resilient households. With a limit of $50,000, the budget is cut by 60 percent and 10 percent of households may not be able to cover $500 in expenses.
Figure 4: Reductions in CNA expenditures also reduce the number of financially secure households.
However, verifying a household’s income when it applies for relief could delay the delivery of payments or keep eligible households from receiving payment at all. This is especially true for households who are displaced from their homes and may not have the paperwork to verify their income. As Finding 3 above shows, quick delivery of relief payments is important.24 To reduce program eligibility without reducing delivery speed, states would need to develop fast procedures to assess eligibility ex ante or find a way to assess eligibility ex post and recover funds from ineligible households.
Disasters incur infrequent and variable costs. Nearly half of hurricanes that hit Louisiana since 2004 exceeded $1 billion in damages.25 In general, states have been facing higher losses from flooding, hurricanes, wildfires, and other natural disasters in recent years. Immediate relief from such natural disasters would benefit from policies for household financial stabilization and asset recovery. Results of this report and existing research26 suggest that disaster relief payments designed for these needs, when disbursed quickly, are effective for lower-income household recovery.
We create a sample of approximately 250,000 households in the state of Louisiana from January 2019 to December 2023 using de-identified account- and transaction-level administrative data of Chase account holders. To ensure we are studying customers for whom we observe most of their financial activity, we require a minimum activity level of 5 transactions per month, along with a minimum take-home income of $12,000 in every year in the sample.
We identify disaster relief disbursements using administrative data fields including transaction amount and transaction descriptions. We differentiate different aid types using transaction amounts: $500 disaster relief payments are tagged as CNA payments, and all other grants are tagged as ‘Other.’ To differentiate CNA disbursements during Hurricane Ida (rather than a different storm), households are required to reside in disaster-declared counties and have received aid between August 29, 2021 and December 31, 2021.27 The final sample includes county-level disaster declaration status for Hurricane Ida and was weighted to match 2019–2023 ACS income quintiles reported in Louisiana.
Additional filters were applied based on the analysis. The sample is restricted to households who lived in a disaster-declared county for all analyses in this paper, resulting in approximately 120,000 households. To assess the post-hurricane spending response (finding 3), households were further filtered census tracts where more than 20% of households received CNA.28 This is a more precise geographic filter to consider households that lived in highly impacted areas. These households were also required to have less than 10% of observed card spending off-us. Households in this sample were assigned the week in which they received CNA.
No aid | Week 1 | Week 2 | Week 3 | Week 4 | ||
|---|---|---|---|---|---|---|
Annual Income (2023) | mean | $92k | $94k | $88k | $100k | $94k |
10% | $20k | $21k | $21k | $22k | $21k | |
20% | $28k | $32k | $29k | $35k | $32k | |
30% | $38k | $43k | $39k | $44k | $42k | |
40% | $47k | $56k | $49k | $59k | $54k | |
50% | $62k | $71k | $64k | $73k | $69k | |
60% | $77k | $86k | $79k | $89k | $84k | |
70% | $97k | $104k | $96k | $110k | $105k | |
80% | $125k | $133k | $122k | $140k | $132k | |
90% | $181k | $185k | $172k | $195k | $185k | |
Average daily balances | mean | $11,000 | $8,000 | $9,000 | $9,000 | $9,000 |
10% | $150 | $140 | $130 | $160 | $150 | |
20% | $340 | $320 | $300 | $320 | $340 | |
30% | $620 | $550 | $520 | $610 | $580 | |
40% | $1,090 | $860 | $860 | $1,030 | $960 | |
50% | $1,930 | $1,420 | $1,440 | $1,690 | $1,600 | |
60% | $3,420 | $2,330 | $2,590 | $3,000 | $2,760 | |
70% | $6,330 | $4,270 | $4,720 | $5,340 | $5,180 | |
80% | $12,580 | $8,880 | $9,590 | $9,940 | $9,830 | |
90% | $28,910 | $20,000 | $22,370 | $23,400 | $23,190 | |
Age | mean | 46 | 45 | 45 | 44 | 46 |
10% | 25 | 27 | 27 | 26 | 27 | |
20% | 30 | 31 | 30 | 30 | 31 | |
30% | 34 | 35 | 34 | 34 | 36 | |
40% | 39 | 39 | 38 | 38 | 40 | |
50% | 45 | 43 | 43 | 43 | 45 | |
60% | 51 | 48 | 48 | 48 | 50 | |
70% | 57 | 53 | 55 | 53 | 56 | |
80% | 63 | 59 | 60 | 58 | 62 | |
90% | 69 | 65 | 67 | 64 | 68 |
We assess post-hurricane changes in income stability by regressing the number of days since a household received payroll income on hurricane impact level, binned annual income, and their interactions to control for housing characteristics and effectively comparing cashflow disruptions across income levels from June 2021 to November 2021:
Yh,w = α0+∑i αi1 Ih,iincome +∑wβw1 Iwweek +∑wβw2 (Iwweek⋅Ihhigh impact)+ ∑w∑iβw,i3 (Iwweek⋅Ih,iincome)+∑w∑iβw,i4 (Iwweek⋅Ih,iincome ⋅Ihhigh impact)+ϵh,w
The sample is limited to households who received payroll income between August 2019 and August 2020 residing in the disaster-declared area. We assign an income group i to each household based on 2023 annual gross income (0 = less than $50k, 1 = between $50k and $100k, and 2 = greater than $100k). We also assign households to the degree of hurricane impact Ih(high impact) , which equals 1 if a household lives in a census tract where more than 20% of households received CNA, and zero otherwise. We use high-income households in less-impacted areas as the reference group. The constant term α0 represents the average share of payroll-disrupted households in the reference group. We allow the share of income-disrupted households to differ by income group (αi1). We also control for time-varying factors that impact all households within a given week (βw1), and allow time fixed effects to vary by income (βw,i3) and whether or not a county was highly impacted (βw2). The coefficient of interest is βw,i4 , which captures that additional change in payroll disruptions in week w for highly impacted households in income group i, relative to households in a less-impacted area at the reference income level. The total effects of interest are: the low-impact low-income group is α0+αi1+βw1+βw,i3, low-impact high-income group is α0+βw1 , the high-impact low-income group is α0+αi1+βw1+βw2+βw,i3+βw,i4 and high-impact high-income group is α0+βw1+βw2. The marginal affects shown in the main text are: βw1+βw,i3 for the low-impact low-income group , βw1 for the low-impact high-income group i, βw1+βw2+βw,i3+βw,i4 for the high-impact low-income group, and βw1+βw2 for the high-impact high-income group.
The sample is further subset to highly impacted areas (i.e. census tracts where more than a fifth of households received critical needs payments). By applying this filter, we consider households with comparable disaster impacts to help isolate aid arrival as the driver of the spend response. We regress household spending on aid arrival time, binned annual income, and their interactions to control for housing characteristics and compare disaster spending between lower- and higher-income households from June 2021 to November 2021:
Yh,w=∑wβw1 Iwweek +∑w∑rβw,r2 (Iwweek⋅Ih,raid)+∑w∑iβw,i3 (Iwweek⋅Ih,iincome)+∑w∑r∑iβw,r,i4 (Iwweek⋅Ih,iincome ⋅Ih,raid)+νh+ϵh,w
We define the total amount of spending by household h in calendar week w as (Yh,w). We assign an income group i to each household similarly to the previous section (0 = less than $50k, 1 = between $50k and $100k, and 2 = greater than $100k). We assign an aid arrival time r for each household based on the week a CNA payment is observed in the account. (0 = aid arrived in first 7 days after Ida made landfall, 1 = aid arrived 7 to 14 days, 2 = aid arrived 14 to 21 days, 3 = aid arrived 21-28 days, and “no_aid” = the household never received a CNA payment). We use low-income households that did not receive CNA as the reference group. Similar to the previous specification, we control for time-varying factors that impact all households within a given week (βw1), and allow time fixed effects to vary by income (βw,i3) and aid recipiency time (βw,r2). The coefficient of interest is βw,r,i4 , which captures that additional change in payroll disruptions in week w for households in income group i that received aid in week r, relative to households at the reference income level who did not receive aid. A different specification is used to the one to study income disruptions because income losses and unemployment are rare events; including household-fixed effects was not a suitable specification given it absorbs all cross-household variation and leads to noisy estimates. Therefore the effects of interest are: the no-aid low-income group is βw1, no-aid high-income group is βw1 +β24 , the aid-receiving low-income group is βw1+βw,r2, and aid-receiving high-income group is is βw1+βw,r2+βw,i3+βw,r,i4
Aladangady, Aditya, Shifrah Aron-Dine, Wendy Dunn, Laura Feiveson, Paul Lengermann, and Claudia Sahm. 2016. “The effect of Hurricane Matthew on consumer spending (FEDS Notes No. 2016-12-02).” Board of Governors of the Federal Reserve System. https://doi.org/10.17016/2380-7172.1888
Attary, Navid, Harvey Cutler, Martin Shields, and John W. van de Lindt. 2020. “The Economic Effects of Financial Relief Delays Following a Natural Disaster.” Economic Systems Research 32 (3): 351–77. doi:10.1080/09535314.2020.1713729.
Bacharier, Galen. 2025. “Few were insured against Helene’s floods. Those that were faced delays, frustrating hurdles.” NC Newsline. https://ncnewsline.com/2025/04/22/few-were-insured-against-helenes-floods-those-that-were-faced-long-claims-frustrating-hurdles/
Board of Governors of the Federal Reserve System. 2025. “Economic well-being of U.S. households in 2024: Executive summary.” https://www.federalreserve.gov/publications/2025-economic-well-being-of-us-households-in-2024-housing.htm
Carnegie Endowment for International Peace. 2024. Disaster dollar database [Data set]. https://carnegieendowment.org/features/disaster-dollar-database
Del Valle, Alejandro, Therese Scharlemann, and Stephen Shore. 2022. “Household Financial Decision-Making After Natural Disasters: Evidence from Hurricane Harvey,” Finance and Economics Discussion Series 2022-015, Board of Governors of the Federal Reserve System. https://doi.org/10.17016/FEDS.2022.015.
Drakes, Oronde, Eric Tate, Jayton Rainey, and Samuel Brody. 2021 “Social vulnerability and short-term disaster assistance in the United States. International Journal of Disaster Risk Reduction, 53, 102010. https://doi.org/10.1016/j.ijdrr.2020.102010
Emrich, Christopher T. , Sanam K. Aksha, and Yao Zhou. 2022. “Assessing distributive inequities in FEMA's Disaster recovery assistance fund allocation.” International Journal of Disaster Risk Reduction, 74. https://doi.org/10.1016/j.ijdrr.2022.102855.
Farrell, Diana and Fiona Greig. 2018. "Weathering the Storm: The Financial Impacts of Hurricanes Harvey and Irma on One Million Households" JPMorgan Chase Institute.
Federal Emergency Management Agency. 2021. “Designated areas: Disaster 4611—Louisiana Hurricane Ida (4611-DR-LA).” U.S. Department of Homeland Security. https://www.fema.gov/disaster/4611/designated-areas
Federal Emergency Management Agency. 2025. “FAQ: What assistance does FEMA provide?” U.S. Department of Homeland Security. https://www.fema.gov/node/what-assistance-does-fema-provide
Fitzpatrick, Alex, Shafaq Patel, and Madalyn Mendoza. 2025. “What Texas could lose if Trump cuts FEMA.” Axios. https://www.axios.com/local/san-antonio/2025/03/25/texas-fema-trump-cuts
Florida Senate, Appropriations Committee. 2024. “Budget Summary – SBP: 2500: Fiscal year 2024-2025.” https://www.flsenate.gov/PublishedContent/Offices/2022-2024/President/Documents/Budget_Summary_-_SPB_2500_FY_24-25.pdf
Foard, Colin. 2020. “How states can manage the challenges of paying for natural disasters.” Pew Charitable Trusts. https://www.pew.org/en/research-and-analysis/issue-briefs/2020/09/how-states-can-manage-the-challenges-of-paying-for-natural-disasters
Gallagher, Justin, and Daniel Hartley. 2017. "Household Finance after a Natural Disaster: The Case of Hurricane Katrina." American Economic Journal: Economic Policy 9 (3): 199–228.
Gallagher, Justin. 2023. “Weathering an unexpected financial shock.” Journal of Political Economy, 131(6), 1715–1757. https://doi.org/10.1086/721654
Ganong, Peter, Pascal J. Noel, Christina Patterson, Joseph S. Vavra, and Alexander Weinberg. 2025. "Earnings Instability," NBER Working Paper 34227. https://doi.org/10.3386/w34227.
Jiang, Fan, Sisi Meng, Mohammad Khan, Nafisa Halim, and Pallab Mozumder. 2023. “Estimating willingness to pay and costs associated with hurricane evacuation.” Transportation Research Part D: Transport and Environment, 121. https://doi.org/10.1016/j.trd.2023.103826.
Jonathan Schroeder, David Van Riper, Steven Manson, Katherine Knowles, Tracy Kugler, Finn Roberts, and Steven Ruggles. IPUMS National Historical Geographic Information System: Version 20.0 American Community Survey 5-Year Data (2019-2023). Minneapolis, MN: IPUMS. 2025. http://doi.org/10.18128/D050.V20.0.
Kousky, Carolyn. 2013. "Facts about FEMA Household Disaster Aid: Examining the 2008 Floods and Tornadoes in Missouri", Weather, Climate, and Society 5, 4: 332-344, doi: https://doi.org/10.1175/WCAS-D-12-00059.1
Kousky, Carolyn, Karina French, Carlos Martín, and Manann Donoghoe. 2023. “As disasters become more costly, the US needs a better way to distribute the burden.” Brookings Institute. https://www.brookings.edu/articles/as-disasters-become-more-costly-the-us-needs-a-better-way-to-distribute-the-burden/
Lamadrid, Alberto.J., Monica Escaleras, Diana Mitsova, Ann-Margaret Esnard, and Alka Sapat. 2025. “Household evacuation decisions and relationship to infrastructure disruption using evidence from Hurricane Irma.” Environment Systems and Decisions, 45:32. https://doi.org/10.1007/s10669-025-10019-0.
Lindell, Michael K., Jung Eun Kang, and Carla S. Prater. 2014 . “The Logistics of Household Hurricane Evacuations.” Nat Hazards 58, 1093–1109 (2011). https://doi.org/10.1007/s11069-011-9715-x
Louisiana Division of Administration (DOA). 2025. “State of Louisiana State Budget: Fiscal Year 2024-2025.” State of Louisiana. https://www.doa.la.gov/media/j02pbrkk/state_budget_fy25.pdf
McTarnaghan, Sara, Lucy Dadayan, and Andrew Rumbach 2025. “The Trump Administration Wants to Shrink the Federal Government’s Role in Disaster Management. Do States Have the Fiscal Capacity to Weather the Storm?” Urban Institute. https://www.urban.org/urban-wire/trump-administration-wants-shrink-federal-governments-role-disaster-management-do-states
Mississippi Legislative Budget Office. 2024. “2024 Legislative session budget summary.” https://www.lbo.ms.gov/pdfs/2024_leg_sesn_sum_v1.pdf
Mozumder, Pallab and William Vásquez. 2015. "An empirical analysis of hurricane evacuation expenditures," Natural Hazards: Journal of the International Society for the Prevention and Mitigation of Natural Hazards, 79(1): 81-92.
National Hurricane Center (2022). “National Hurricane Center Tropical Cycle Report: Hurricane Ida”. National Oceanic and Atmospheric Administration, National Weather Service. https://www.nhc.noaa.gov/data/tcr/AL092021_Ida.pdf National Oceanic and Atmospheric Administration National Centers for Environmental Information. 2024. “U.S. billion dollar weather and climate disasters.”
Painter, William L. 2025. “Disaster Relief Fund State of Play: In Brief.” Congressional Research Service. https://www.congress.gov/crs-product/R47676
State of California. 2024. California State Budget 2024-25: Summary Schedules. https://ebudget.ca.gov/2024-25/pdf/BudgetSummary/SummarySchedules.pdf
Texas Legislature. 2023a. General appropriations act (H.B.1), https://capitol.texas.gov/tlodocs/88R/billtext/pdf/HB00001F.pdf
Texas Legislature. 2023b. Supplemental appropriations and reductions in appropriations (S. B. 30), 88th Legislature, regular session. https://capitol.texas.gov/tlodocs/88R/billtext/pdf/HB00001F.pdf
U.S. House of Representatives, Committee on Oversight and Reform. 2021. Hurricane Ida and beyond: Readiness, recovery, and resilience (Questions for the record; HHRG-117-GO00-20211005-QFR005). U.S. Government Publishing Office. https://docs.house.gov/meetings/GO/GO00/20211005/114103/HHRG-117-GO00-20211005-QFR005.pdf
Wheat, Chris, Daniel M. Sullivan, and Erica Deadman. 2025. “Building financial security and resilience to unexpected expenses: The importance of cash savings.” JPMorganChase Institute. https://www.jpmorganchase.com/institute/all-topics/financial-health-wealth-creation/building-financial-security-and-resilience
Winters, Mike. 2025. “How much cash to keep in your home right now, according to money experts.” CNBC. https://www.cnbc.com/2025/04/15/how-much-emergency-cash-to-have-on-hand
We are thankful to the many people who made essential contributions to this research. We are indebted to our internal partners and colleagues, who support delivery of our agenda in a myriad of ways and acknowledge their contributions to each and all releases.
Wheat, Christopher, Daniel M. Sullivan, and Alexandra Lefevre. 2026. " Targeting disaster relief: Who needs aid to weather the storm?” JPMorgan Chase Institute. https://www.jpmorganchase.com/institute/all-topics/financial-health-wealth-creation/targeting-disaster-relief-who-needs-aid-to-weather-the-storm
Footnotes
Board of Governors of the Federal Reserve System (2025)
The main categories of recovery assistance are Individual Assistance (IA) and Public Assistance (PA). IA provides aid directly to households while PA provides local governments with funding and direct recovery activities. These programs are funded through the Disaster Relief Fund (DRF), which was created by the Stafford Act. In recent years, the DRF has been allocated $20 billion per year on average and receives supplemental appropriations from Congress (Painter 2025).
Kousky et al. (2023)
Carnegie Endowment for International Peace (2025)
Kousky et al. (2023), for example, discuss the incentive alignment problems that are created when state and local governments rely mostly on unconditional federal funding Foard (2020) discusses some history of the debate over federal vs state fiscal responsibility.
Painter (2025) discusses the recent pressures on disaster relief funding, including lingering COVID-19 Public Assistance obligations.
See, e.g., Foard (2020).
Studies have been done on disasters’ impacts on household debt and credit use (Gallagher 2017; Del Valle 2022), and spending response (Alandagady 2016). Previous studies have evaluated federal assistance in the context of credit outcomes (Gallagher 2023) or estimating losses using differing scenarios of aid availability (Attary 2020). Others focused on which households receive aid along with eligibility and administrative hurdles across different demographics (Emrich et. al. 2022; Kousky 2013). To our knowledge this is the first paper to look at household balance sheet outcomes in the immediate weeks of a disaster and account for federal aid recipiency.
Hurricane Ida was a Category 4 hurricane that made landfall in Louisiana on August 29, 2021, and incurred more $50 billion in estimated losses in the state (National Hurricane Center 2022).
When approved with a disaster declaration from the President, CNA is provided as a one-time fixed payment and complements other support programs. In 2024, Critical Needs Assistance was replaced by Serious Needs Assistance (FEMA, 2025), and the amount is adjusted each fiscal year.
Based on figures from U.S. House of Representatives, Committee on Oversight and Reform (2021)
We measure “emergency savings” by taking a households’ total checking and savings account balances in every day of month and calculating the 25th percentile across days. That is, in a 30-day month, we take the 7th lowest day of balances. We do this because a significant portion of households’ bank balances are earmarked for future essential spending: if my rent of $1,000 is due on the first of each month, and I get paid $1,000 every month on the 15th, my average daily balances for the month will be $500 but my emergency savings—the money I have available for unexpected expenses—is $0. We also avoid using the minimum balance or a lower percentile because those measures can be dominated by brief, idiosyncratic dips that are not economically meaningful (e.g., cross-account transfers) and would anchor the metric to unusually low balances that are not representative of actual liquidity available during the month. See Wheat, Sullivan, and Deadman (2025) for more discussion.
This analysis is done on households within the disaster declaration zone by regressing the number of days since the last paycheck on indicators for neighborhood storm impact level, household characteristics, and time fixed effects. See the ‘Sample construction’ and ‘Payroll shock analysis’ appendix sections for additional details.
The disaster-declared area receiving Individual Assistance included 23 parishes, covering the majority of southeastern Louisiana. A full list of impacted parishes can be found here at FEMA (2021).
We can observe when households receive their CNA payment based on transaction descriptions and amounts, and we assign each household the week relative to hurricane landfall in which a household received this payment. See Appendix Section ‘Spend analysis’
Because we don’t know when households requested aid, we don’t know whether households in the Week 4 group had their applications processed more slowly than the Week 1 group, or if they applied later. If households waited to apply for aid until they had a pressing need, e.g., until their emergency savings ran out and they needed support to by food, that is still consistent with households being liquidity constrained.
Fitzpatrick (2025).
Foard (2020)
Louisiana DOA (2025)
State of California (2024)
Foard (2020)
Federal funding estimates are taken from Carnegie Endowment for International Peace (2025). State budget estimates were taken from 2024-2025 fiscal year budgets (Louisiana Division of Administration (2025), Florida Senate (2024), Texas Legislature (2023a, 2023b), Mississippi Legislative Budget Office (2024), and State of California (2024).
The budget of direct relief programs can also be reduced indirectly by preventative measures, such as infrastructure investments that reduce how many households are impacted by disasters.
Bacharier (2025) also discusses the adverse impact of aid delays after Hurricane Milton.
11 hurricanes have resulted in more than $1 billion in damages in Louisiana since 2004 (NOAA 2024).
Application deadline for urgent needs programs (including CNA) was September 12, 2021. Other Individual Assistance programs had an application deadline of November 28, 2021 (see the following link for additional details: https://ready.nola.gov/incident/hurricane-ida/assistance/residents/fema-assistance/fema-disaster-assistance/) . A larger window in the analysis is considered to account for disbursement delays.
A 20% cutoff approximates the median share of households receiving aid within a census tract.
Authors

Chris Wheat
President, JPMorganChase Institute

Daniel M. Sullivan
Consumer Research Director, JPMorganChase Institute

Alexandra Lefevre
Consumer Research Vice President, JPMorganChase Institute
Media contact: Shelby Wagenseller, Shelby.Wagenseller@jpmchase.com