
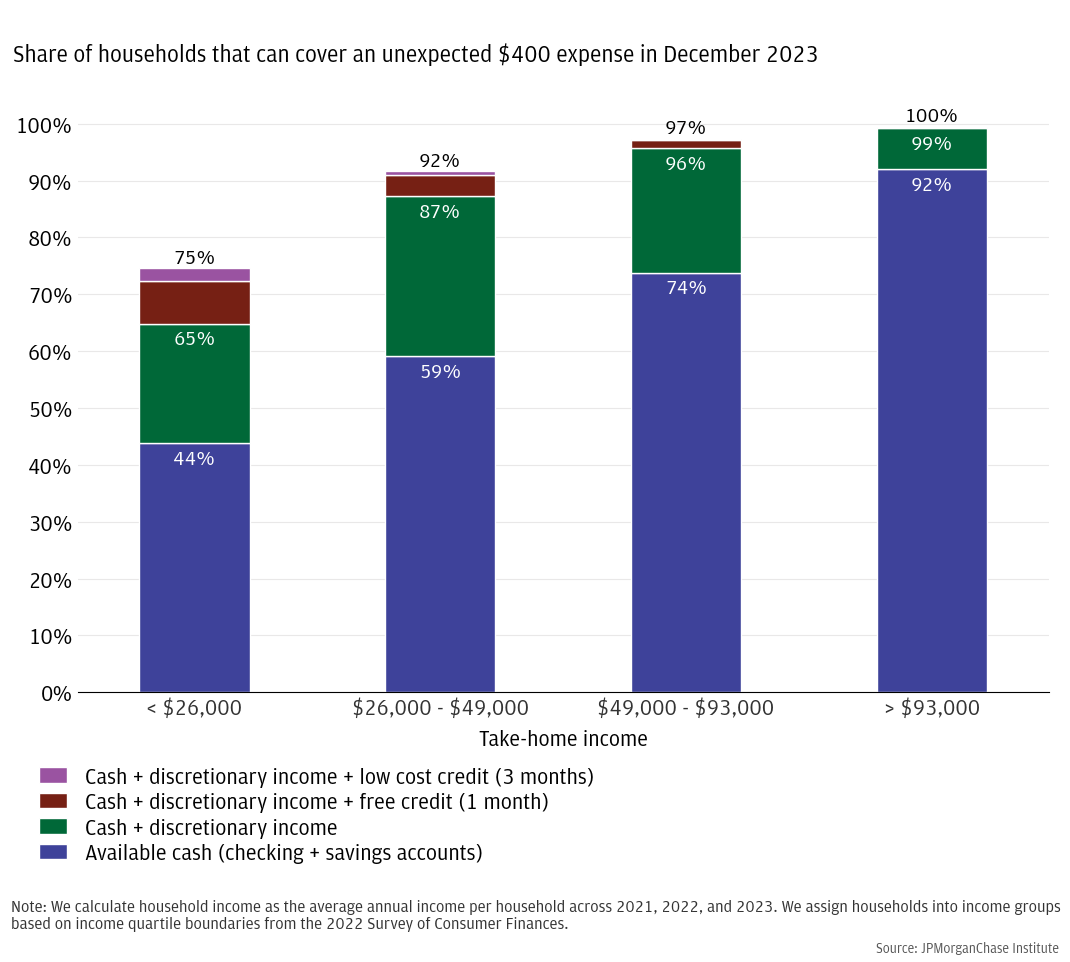
Figure 1: Most households can cover an unexpected $400 expense, although lower income households rely more on diverting discretionary spending than high-income households.

Creating thriving communities together
See how our clients and partners—from small business owners to workforce training leaders—work with JPMorganChase to drive meaningful impact and economic growth where they live and work.
Learn moreLatest news

Veteran’s Unconventional Path to Landing her Dream Job in Tech
U.S. Army Veteran Ashley Wigfall transitioned to a civilian role and charted her path to technologist through mentorship and skills training at the JPMorgan Chase tech hub in Plano, Texas.
Learn more
Research
September 18, 2025
The ability to cover unexpected expenses is a critical component of a household’s financial security. If a household doesn't have the funds to cover an unexpected expense, its financial security and overall welfare could be seriously harmed. Is it possible for households to quickly increase their ability to cover expenses without significant life changes? This depends on two factors: First, how much security does an emergency savings fund provide to a household that already has enough discretionary income to cover most expenses? Second, do households have enough discretionary income to build up an emergency savings fund quickly? In answer to these questions, we find that:
Our findings suggest that policies that shift households’ savings targets, such as financial literacy programs, may be particularly effective at improving financial security.
Key findings
A critical component of a household’s financial security is its ability to cover unexpected expenses. One of a household’s most important decisions in securing its day-to-day finances is how much cash to keep in an emergency savings fund. Households with a lot of discretionary income (income left over after paying for essential expenses) might feel comfortable keeping a smaller emergency fund, since they can use that discretionary income to cover an emergency if one arises. In contrast, households that spend most of their income on essentials like housing and food may want to keep a larger emergency fund, as might households whose income stream is less predictable. An unexpected expense that exceeds a household’s emergency fund and remaining discretionary income can be calamitous—the household may have to resort to high-interest payday loans, selling possessions, or going without some other essential good.
As much as being unprepared for an emergency is costly, preparing for one is difficult. Demand for financial advice is enormous, and households respond readily to new information about how they “should” or “shouldn’t” manage their finances.1 It is hard to determine the “right” amount for an emergency fund, because it depends on numerous personal circumstances and preferences. A household can always become more secure with additional savings, but building too large an emergency fund is also costly—there are diminishing returns to increasing savings, as each additional dollar saved requires a greater sacrifice in spending and yields a smaller increase in security. A steady stream of discretionary income might provide as much financial security as an emergency savings fund, and data suggests that many households rely on their expected income instead of keeping a large emergency fund.2
But having a steady stream of discretionary income could give a household a false sense of financial security. Moreover, some households have no discretionary income—they live paycheck-to-paycheck—and thus cannot easily increase their emergency savings. These facts raise several important questions for policies designed to increase households’ financial security, since households that are unable to save require different kinds of help than households that can save but trust their discretionary income to keep them secure.
This report explores how easily households can increase their financial security through saving by answering two questions: how much more financial security does an emergency fund provide than discretionary income, and how much discretionary income can households feasibly use to build up their cash savings?
Analyzing deidentified financial data of over six million households that bank with Chase, we find that cash savings provide significantly more financial protection than relying on discretionary income alone, even when total dollar amounts are similar. Controlling for available liquidity during an average month, households that have more cash savings have fewer missed payments than those with less cash savings but substantial discretionary income. We also find that many households could significantly increase their cash savings in a relatively short amount of time. By temporarily reducing leisure spending (a subset of discretionary spending comprised of restaurants, travel, entertainment, and non-clothing retail shopping), the typical household with about $30,000 in take-home income and $500 in cash savings could double their savings in 48 days, greatly reducing their vulnerability to unexpected expenses. However, we also find that many lower-income households do not have enough discretionary income to easily build up savings. While they may benefit from the same policies that help higher-income households save more, they may need additional support.
These two findings suggest that policies may be particularly effective at increasing financial security if they convince households that larger emergency funds are worth the cost. For example, research using randomized controlled trials has found that financial education programs significantly increase emergency saving and decrease debt defaults and other bad financial outcomes.3 Moreover, these financial education programs are highly cost-effective, with long lasting effects. Such programs would likely pair well with existing direct support programs, which are effective at mitigating short-run shocks like unemployment.4 Conversely, policies that induce households to save more without convincing them of the benefits are unlikely to be effective in the long run. Finally, financial education may be beneficial but insufficient for households with little discretionary income and thus fewer options to change their saving behavior.
Our sample covers 6.3 million households for whom we have financial data via deposit and credit card accounts.5 We re-weight our sample by income to match the income distribution from the 2022 Survey of Consumer Finances (SCF).6 We consider several sources of liquidity, listed in order from the most accessible to the least:
Cash savings: Total cash the household has in their checking and savings accounts that is available for unexpected expenses. Not all the money in a household’s accounts is free to be used for unexpected expenses. A significant portion of cash balances is already earmarked for non-discretionary expenses such as rent and loan payments. To avoid overestimating how much unearmarked savings a household has, we use the 25th percentile of daily balances within a month to approximate the household’s emergency savings fund.
Discretionary income: Income net of non-discretionary expenditures like debt payments, housing, utility bills, and groceries. Households typically use this portion of their income for savings and discretionary spending, but they can instead use some of these funds to cover an unexpected expense if one arises.7
Free use of credit: Amount the household can put on their open and current credit cards and pay back within one month using their discretionary income.8,9
Low-cost use of credit: Amount the household can put on their open and current credit cards and pay back within three months using their discretionary income, less two months of interest charges.10,11
Households with larger emergency funds but little discretionary income are much more financially secure than those with lots of discretionary income but small emergency funds.
Households can draw from several sources of liquidity when faced with an unexpected expense, including cash savings and income they would typically use for discretionary spending, which they can divert to cover the expense. If they have access to credit, households can also divert the next month’s discretionary spending to help cover an unexpected expense during the current month. Figure 1 shows that most households can cover an unexpected $400 expense, though how they do so differs by income group. Almost all (92 percent) of the highest-earning households can cover the expense using cash savings alone, and only 8 percent need to redirect some discretionary spending as well. In contrast, only 44 percent of the lowest-earning households can cover a $400 expense using cash savings alone, while 21 percent can cover the expense using a combination of cash savings and redirecting discretionary spending.12
However, redirecting planned discretionary spending may be less reliable than having cash savings on hand—an unexpected expense may occur after all discretionary income has already been spent. Many hourly workers, who have disproportionately lower incomes, experience large month-to-month changes in their income due to employer-driven changes in their work schedules, with 1 in 4 months seeing changes of at least 21 percent (Ganong et al. 2024). If a worker is scheduled to fewer hours than expected right before an emergency expense arises, they may not have enough discretionary income to divert to cover the expense. If they also lack cash savings, they may not be able to pay all their expenses.
Figure 1: Most households can cover an unexpected $400 expense, although lower income households rely more on diverting discretionary spending than high-income households.
How much more reliable are cash savings than redirecting planned spending? To answer this question, we focus on low-income households (annual take-home income less than $49,000), for whom liquidity can be the most uncertain. We also limit our analysis to prime-aged households (30−45 years old) to exclude both retirees, who have low incomes but significant assets, and young adults, who have not fully joined the workforce.
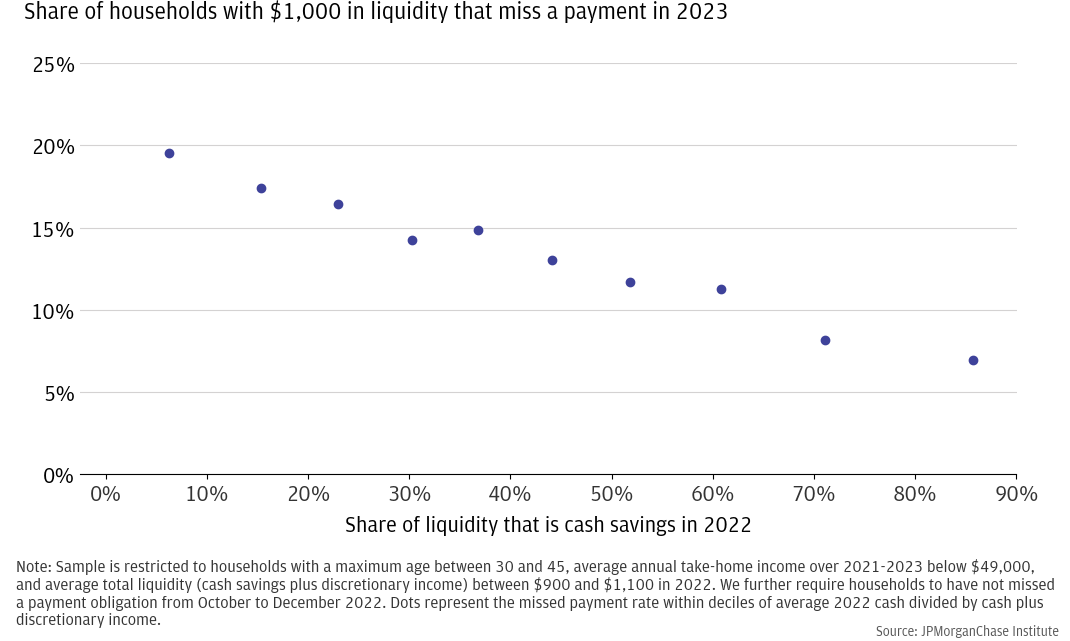
When comparing households with similar total liquidity (cash savings plus discretionary income), we see higher indications of financial distress in households that keep smaller emergency savings funds, despite all these households, in theory, having the same ability to cover unexpected expenses. To compare the relative usefulness of cash savings and discretionary income as sources of emergency funds, we take a sample of households with similar total liquidity ($900−$1,100) who did not miss any payment obligations during the last three months of 2022. We then measure how the likelihood of a household missing a payment obligation during 2023 varied by how much of their liquidity comes from cash savings. Figure 2 shows that among those with the least cash savings (roughly 6 percent of their available liquidity), nearly 20 percent missed a payment obligation in 2023, while only 7 percent of those with the most cash savings (over 86 percent of available liquidity) missed a payment. This suggests that, even when households have considerable discretionary spending, they could, in theory, reallocate to cover emergency expenses, in practice, their lack of cash savings frequently leaves them vulnerable.
Figure 2: Among low-income households with about $1,000 of total liquidity, those who rely on diverting discretionary spending exhibit greater financial distress than those with little discretionary income but more cash savings.
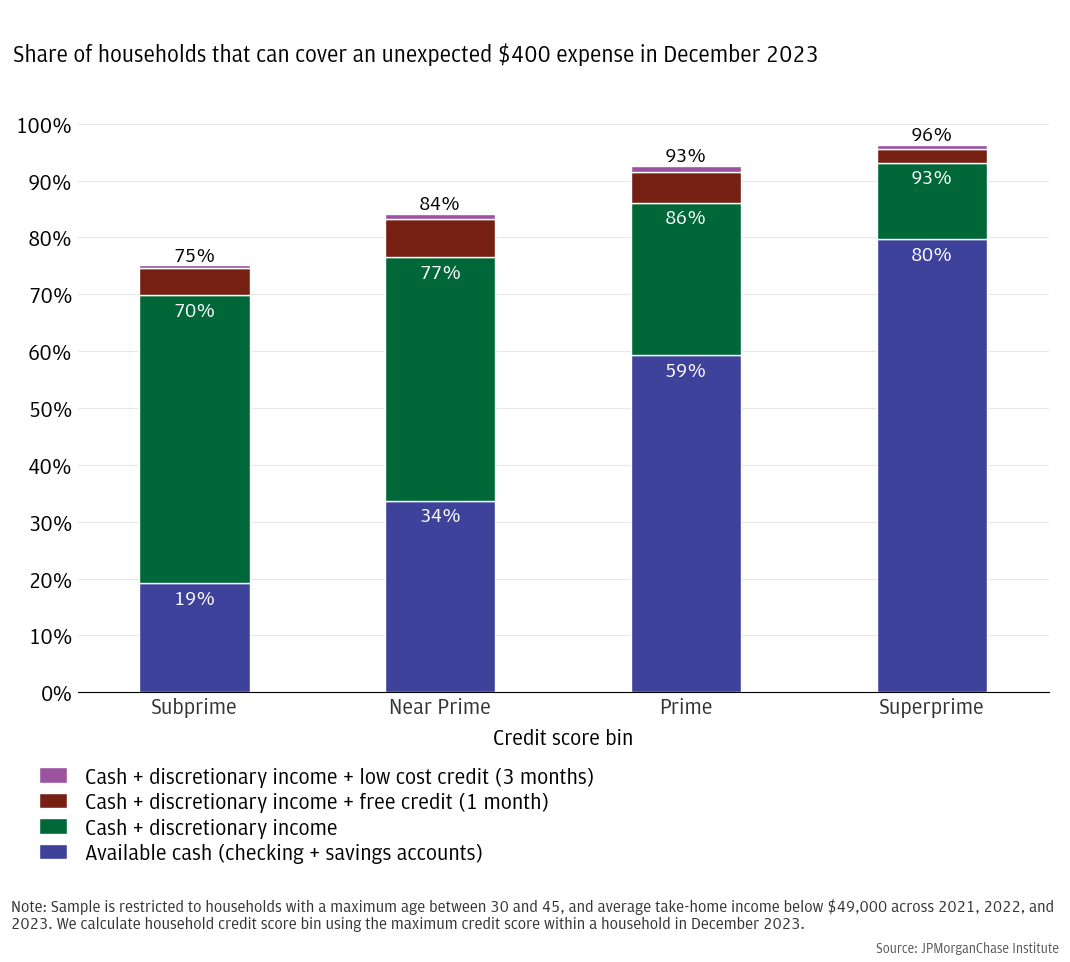
If we compare the expense resilience of households with different credit scores—which serve as a proxy for the ability to pay one’s financial obligations—we see a similar pattern. We take low-income households in our sample (below $49,000 in annual take-home income), calculate their average cash savings and discretionary spending during 2022, then compare that to the household’s eventual credit score at the end of 2023. Figure 3 shows that for these low-income households, the main differentiator between low- and high-credit score households is not the total amount of available liquidity a household can access in a given month, but the amount of cash savings a household holds. Combining cash savings and discretionary income, 75 percent of low-income households with subprime credit can, in theory, cover a $400 emergency expense with some combination of cash savings, diverted discretionary spending, and short-term credit. However, only 19 percent can do so using cash savings versus 80 percent of superprime (but still low-income) households.
Figure 3: Low-income households with subprime credit scores rely more on redirecting planned spending to cover unexpected expenses. In contrast, most low-income households with superprime credit scores can cover the expense using available cash savings.
Figures 2 and 3 show that households with lower cash savings are financially insecure even with significant discretionary income. Households that rely more on their ability to pull back on discretionary spending are more at risk of bad financial outcomes—missed payments on phone, electricity, or health bills, low credit scores, and spiraling financing costs. But there is an opportunity for households with discretionary income to build up cash savings by re-routing planned discretionary spending into savings. We explore how feasible this cash diversion is for low-income, low-savings households in the next section.
The typical low-income household with $500 in savings could double their total savings by reducing part of their discretionary spending for 48 days. However, we also find that many lower-income households do not have enough discretionary income to easily build up savings.
In the previous section, we found that when households plan to cover unexpected expenses by diverting discretionary spending, they are more financially vulnerable than if they also have an emergency savings fund. Households can build up their emergency fund by diverting some of their discretionary spending to savings for a short time. After building up their emergency fund, households can then resume their usual spending behavior.
To estimate how quickly a household can build up their emergency savings, we use each household’s historical spending data to calculate how much each household in our sample spends in an average month on certain leisure categories they might be able to forgo without incurring significant welfare costs. Specifically, we estimate how quickly each household could reach $1,000 in cash savings by reducing spending on certain leisure categories—a subset of discretionary spending—by 75 percent, specifically restaurants, travel, entertainment, and non-clothing retail shopping.13 Using the household’s average monthly spending over the course of a year, we estimate how many days of reduced leisure spending it would take to reach $1,000 in savings from their actual savings amount. To focus on households for whom accumulating savings might be particularly difficult, we again restrict our sample to those aged 30−45, and further restrict our sample to those with average take-home income of roughly $30,000 ($27,000−$33,000).14
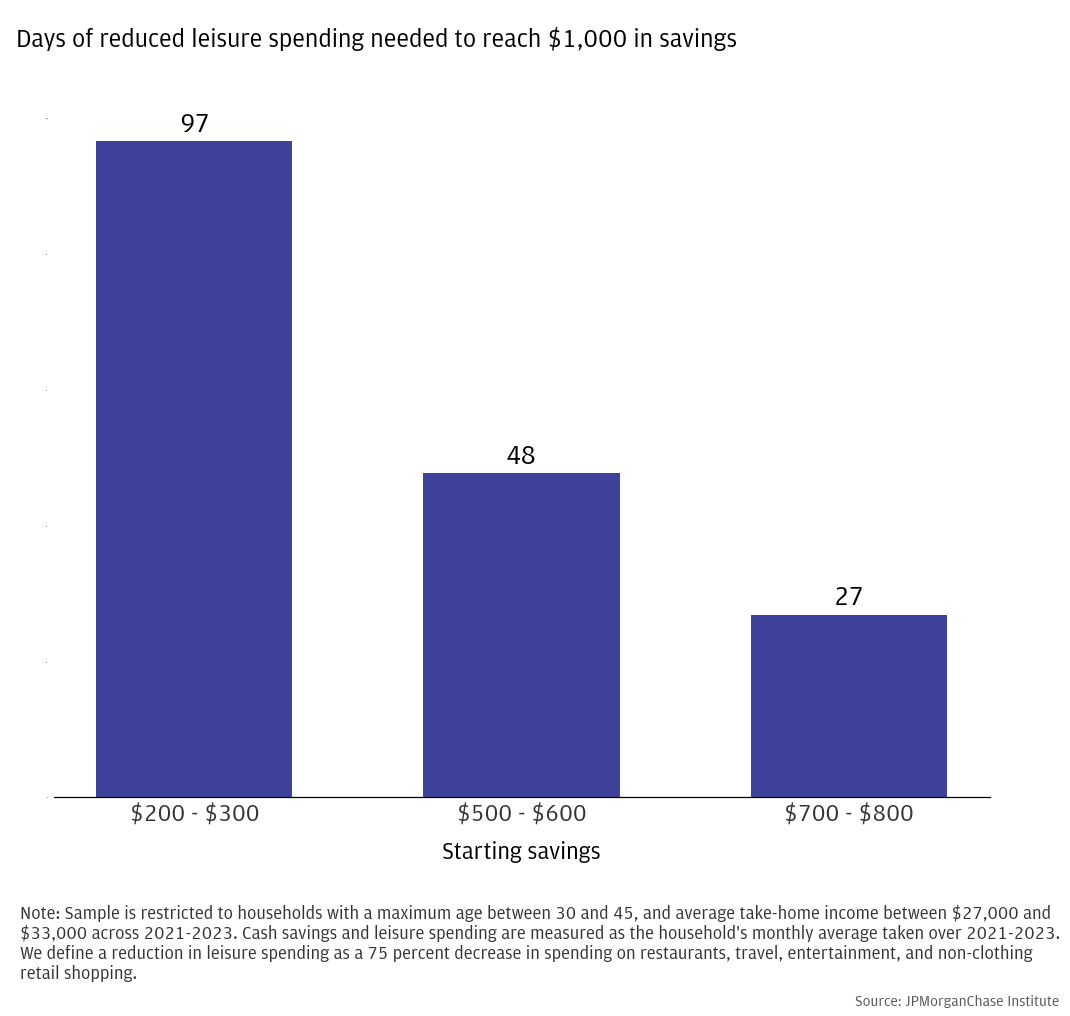
We find that by redirecting three-quarters of their leisure spending into cash savings, the typical household with $500-$600 in cash savings and about $30,000 in take-home income can reach $1,000 of cash savings in 48 days.15 Figure 4 shows the median amount of time it would take to reach $1,000 in savings by households with different amounts of starting savings, ranging from about 1 month (starting with $700−$800 in savings) to about 3 months (starting with $200−$300 in savings). This exercise demonstrates a potential route for those with lower incomes to build emergency savings to protect against financial distress.
Figure 4: By reducing leisure spending, the median household with $500 savings and $30,000 in take-home income can accumulate $1,000 of cash savings in 48 days.
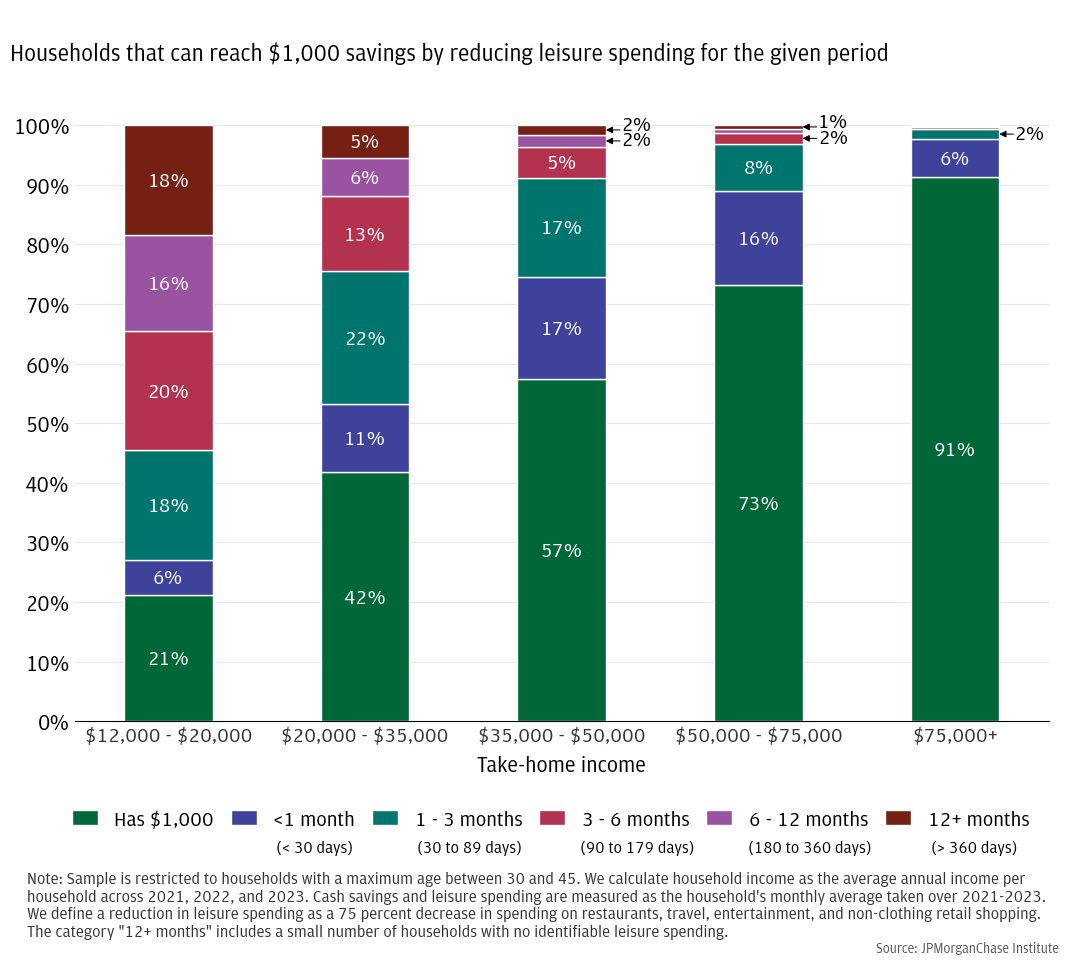
Nevertheless, many households may have more difficulty reaching the $1,000 savings target. Figure 5 shows how many households in different income groups already have $1,000 in savings, and how many can reach $1,000 by reducing their leisure spending for less than 1 month, between 1 and 2 months, etc. Lower-income households are much less likely to reach $1,000 in savings quickly. This is because lower-income households tend to have lower starting balances as well as less leisure spending they can re-route to savings. Under our assumed saving strategy (a temporary 75 percent reduction in leisure spending), if a household has $500 in savings but only spends $20 on leisure goods in an average month, they will only add $15 to their savings per month using this strategy, and it will take them almost 3 years to reach $1,000 in total savings.
While most households can reach $1,000 in less than 3 months, significant portions of the lowest income households would require at least 6 months to reach $1,000 in savings. For those taking home less than $20,000 per year, this goal is particularly difficult, with 34 percent requiring at least 6 months, with many households potentially needed much longer. This group is also the most likely to rely on government supports like SNAP for basic necessities (the federal poverty limit for a two-person household in 2023 was $19,720).16 It is also important to note that our data does not include the very lowest income households due to our data quality restrictions, and households with less than our minimum of $12,000 of annual income will likely have even less leisure spending to re-route to savings.
Figure 5: While most income groups can reach $1,000 within 3 months, very few households taking home less than $20,000 per year can do so.
A household’s ability to manage unexpected expenses provides the foundation of its financial security. Every household chooses a strategy for handling unexpected expenses that uses some combination of savings and discretionary income. Discretionary income can be used for unexpected expenses if they arise and discretionary spending if they don’t. For those that do have discretionary income, we find that, holding total available liquidity constant, households are more financially secure when they have more cash savings. This suggests that households can increase their financial security by temporarily forgoing some discretionary spending and putting that money into an emergency savings fund. However, households with little discretionary income cannot easily accumulate savings. Their options for improving their financial security are more severe. They must find a way to reduce their essential spending or increase their total income through new employment. However, we find that most households have the capacity to increase their emergency savings relatively quickly.
Given the high costs of being unable to pay for unexpected expenses such as auto or home repairs, why might people keep emergency savings funds that are small relative to their discretionary spending? Why would they adopt such a risky strategy to guard against shocks? It is possible that they do not realize how risky their strategy is. Summarizing the existing research on financial literacy in the United States, Lusardi and Mitchell (2023) find that many Americans lack core financial literacy skills, and risk management is the core financial skill which people lack most—it is also the skill they are most likely to admit they lack.
Instead, people frequently rely on rules of thumb, habits, the behavior of their peers, and other signals to help them make financial decisions (Gomes, Hiliassos, and Ramadorai 2021). These heuristics can lead to bad outcomes, either because they are not appropriate to the household’s circumstances, or because circumstances change and households don’t adapt. As a result, even large, sudden improvements in a household’s income or wealth may not result in long-term improvements in financial security. A study of winners of large lottery prizes (over $50,000) found that winning such a prize delayed bankruptcy but did not prevent it.17 Similarly, a recent randomized controlled trial that gave low-income households $1,000 per month (an average increase in income of 40 percent) for 3 years found that the additional income caused recipients to report feeling like their financial health was improved, but it did not affect credit delinquencies, bankruptcies, or household net worth (Bartik et al. 2024).
People do not appear to adapt their strategy to an increase in income or wealth, but they do respond to direct signals about what their strategies should be, whatever the source. While winning the lottery may not save a person from bankruptcy, living near a lottery winner can increase their risk of bankruptcy, likely because people look to their neighbors to help develop their spending and saving strategies (Agarwal, Mikhed, and Scholnick 2020). People also rely heavily on signals like default minimum payments to decide how quickly they should repay their debts.18
Financial education directly informs households about how to improve their financial strategies, and programs that provide financial education have been shown to be effective at improving people’s long-run financial health (Kaiser and Lusardi 2024). Studies using randomized controlled trials on both teenagers and adults have found that financial education significantly improves long-term credit default rates, saving rates, budgeting, and similar outcomes. Notably, direct education programs in a classroom-like setting generate much larger effects than more passive, “light-touch” interventions such as informational brochures. Despite the higher cost of more active interventions, such programs have been found to be highly cost effective.19
In contrast, programs that temporarily boost savings, such as subsidized but liquid savings accounts, may be less effective at improving financial security specifically, because they do not change what households believe is the optimal amount of emergency savings. Institute research has found that households keep fairly stable cash buffer targets—after a large income windfall, households increase their spending until their cash buffer returns to target. If an expense draws down their cash buffer, they cut back on spending until their savings return to the target (Wheat and Eckerd 2023). If a household believes that $500 is the right amount for their emergency fund, a subsidy may induce them to temporarily hold more than $500 in savings. But once the subsidy is removed, the household is likely to revert to $500, as long as they continue to believe that $500 is the right amount for them. Subsidizing saving could effectively increase total savings if access to the subsidized savings were restricted—this is the fundamental principle behind savings policy for retirement (401(k) and IRA) and education (529 plans) in the United States. But for a savings fund to be useful as a hedge against unexpected expenses, it must be easy to access. However, if the savings fund is easy to access, households will readily spend any savings they see as “extra.”
Together, the results of this and existing research suggests that financial education programs can be highly effective in improving households’ financial health at relatively low costs.
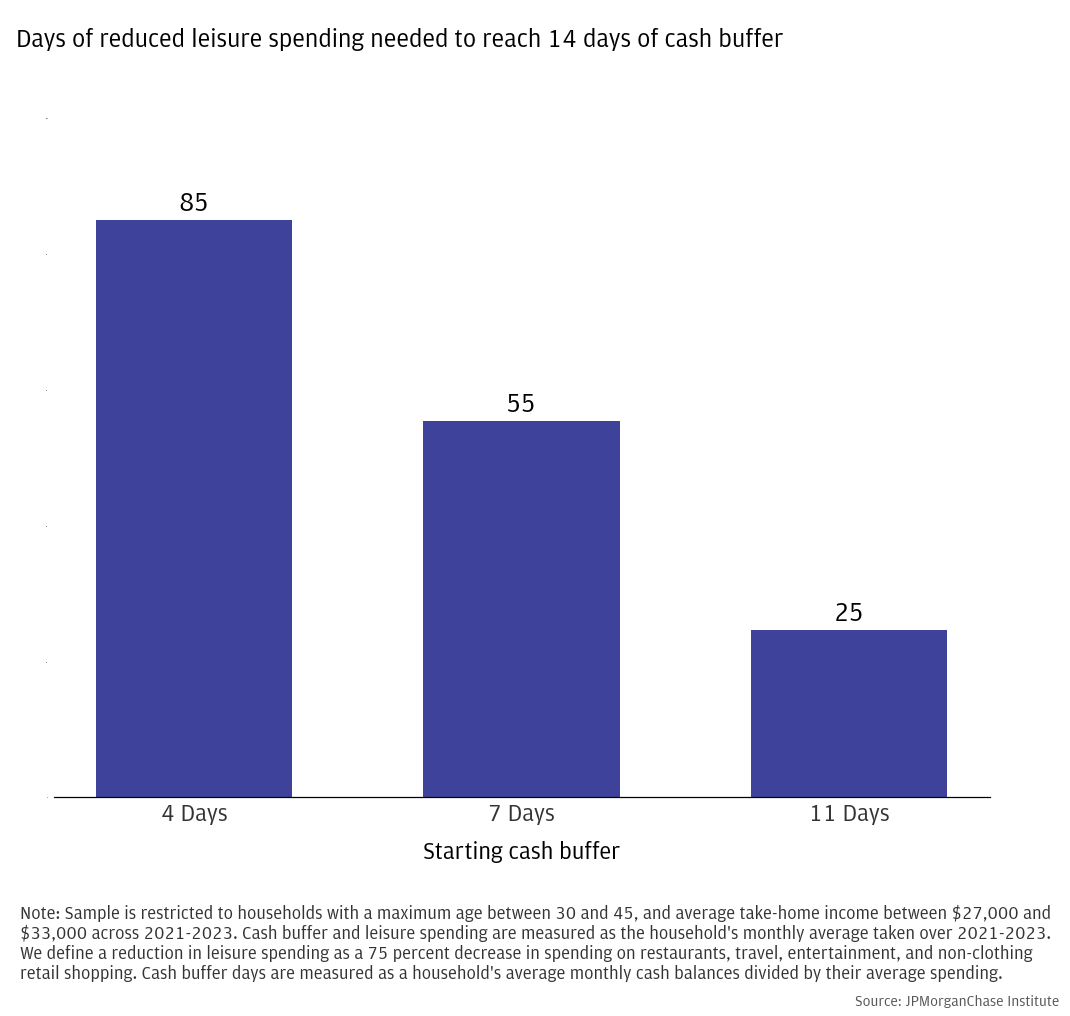
Figure A1: By cutting discretionary spending in half, low-income households can achieve a goal of 14 days of cash buffer within several weeks.20
Agarwal, Sumit, Vyacheslav Mikhed, and Barry Scholnick. 2020. “Peers’ income and financial distress: Evidence from lottery winners and neighboring bankruptcies.” The Review of Financial Studies 33(1): 433–472.
Bartik, Alexander W., Elizabeth Rhodes, David E. Broockman, Patrick K. Krause, Sarah Miller, and Eva Vivalt. 2024. “The Impact of Unconditional Cash Transfers on Consumption and Household Balance Sheets: Experimental Evidence from Two US States.” NBER Working Paper No. 32784. http://www.nber.org/papers/w32784
Cox, James C., Daniel Keisman, and Susan Dynarski. 2020. “Designed to fail: Effects of the default option and information complexity on student loan repayment.” Journal of Public Economics 192: 104298
Ganong, Peter, Fiona Greig, Pascal Noel, Daniel M. Sullivan, and Joseph Vavra. 2024. “Spending and Job-Finding Impacts of Expanded Unemployment Benefits: Evidence from Administrative Micro Data.” American Economic Review 114(9): 2898–2939.
Ganong, Peter, and Pascal Noel. 2019. “Consumer Spending during Unemployment: Positive and Normative Implications.” American Economic Review 109(7): 2383–2424.
Ganong, Peter, Pascal Noel, Christina Patterson, Joseph Vavra, and Alexander Weinberg. 2024. “Earnings Instability.” Working Paper. https://voices.uchicago.edu/ganong/files/2024/03/earnings_instability-8ec8ba2640feedb4.pdf
Hankins, Scott, Mark Hoekstra, and Paige Marta Skiba. 2011. “The Ticket to Easy Street? The Financial Consequences of Winning the Lottery.” The Review of Economics and Statistics 93(3): 961–969.
Kaiser, Tim, and Annamaria Lusardi. 2024. “Financial Literacy and Financial Education: An Overview.” NBER Working Paper No. 32355. http://www.nber.org/papers/w32355
Lusardi, Annamaria, and Olivia S. Mitchell. 2023. “The Importance of Financial Literacy: Opening a New Field.” Journal of Economic Perspectives 37(4): 137–154.
Wheat, Chris, Erica Deadman, and Daniel M. Sullivan. 2022. “How families used the advanced Child Tax Credit.” JPMorganChase Institute. https://www.jpmorganchase.com/institute/all-topics/financial-health-wealth-creation/how-families-used-advanced-CTC
Wheat, Chris, Erica Deadman, and Daniel M. Sullivan. 2024. “How vulnerable are Americans to unexpected expenses?” JPMorganChase Institute. https://www.jpmorganchase.com/institute/all-topics/financial-health-wealth-creation/how-vulnerable-are-americans-to-unexpected-expenses
Wheat, Chris, and George Eckerd. 2023. “Household Cash Buffer Management from the Great Recession through COVID-19.” JPMorganChase Institute. https://www.jpmorganchase.com/institute/all-topics/financial-health-wealth-creation/household-cash-buffer-management-from-the-great-recession-through-covid-19
We thank Bernard Ho and Lucas Nathe for their hard work and contribution to this research. Additionally, we thank Bryan Kim, Katie Faryniarz, Alfonso Zenteno, Oscar Cruz, and Katherine Johnston for their support. We are indebted to our internal partners and colleagues, who support delivery of our agenda in a myriad of ways and acknowledge their contributions to each and all releases.
We would like to acknowledge Jamie Dimon, CEO of JPMorgan Chase & Co., for his vision and leadership in establishing the Institute and enabling the ongoing research agenda. We remain deeply grateful to Peter Scher, Vice Chairman; Tim Berry, Head of Corporate Responsibility; Heather Higginbottom, Head of Research, Policy, and Insights and others across the firm for the resources and support to pioneer a new approach to contribute to global economic analysis and insight.
This material is a product of JPMorganChase Institute and is provided to you solely for general information purposes. Unless otherwise specifically stated, any views or opinions expressed herein are solely those of the authors listed and may differ from the views and opinions expressed by J.P. Morgan Securities LLC (JPMS) Research Department or other departments or divisions of JPMorgan Chase & Co. or its affiliates. This material is not a product of the Research Department of JPMS. Information has been obtained from sources believed to be reliable, but JPMorgan Chase & Co. or its affiliates and/or subsidiaries (collectively J.P. Morgan) do not warrant its completeness or accuracy. Opinions and estimates constitute our judgment as of the date of this material and are subject to change without notice. No representation or warranty should be made with regard to any computations, graphs, tables, diagrams or commentary in this material, which is provided for illustration/reference purposes only. The data relied on for this report are based on past transactions and may not be indicative of future results. J.P. Morgan assumes no duty to update any information in this material in the event that such information changes. The opinion herein should not be construed as an individual recommendation for any particular client and is not intended as advice or recommendations of particular securities, financial instruments, or strategies for a particular client. This material does not constitute a solicitation or offer in any jurisdiction where such a solicitation is unlawful.
Wheat, Chris, Daniel M. Sullivan, and Erica Deadman. 2025. “Building financial security and resilience to unexpected expenses: The importance of cash savings.” JPMorganChase Institute. https://www.jpmorganchase.com/institute/all-topics/financial-health-wealth-creation/building-financial-security-and-resilience
Footnotes
Kaiser and Lusardi (2024) discuss how people respond to information about financial strategies. Choi (2022) describes the supply of popular financial advice and how well popular advice correlates with strategies found to be ideal in academic economic research.
Past Institute research suggest that some households, especially younger households, have high discretionary income compared to their cash savings (Wheat, Deadman, and Sullivan 2024).
Lusardi and Mitchell (2023), Kaiser and Lusardi (2024).
Ganong et al. (2024) document how unemployment insurance supported household spending after job loss during the pandemic. Bartik et al. (2024) find in a randomized controlled experiment that unconditional income supports have little or no effect on net worth, credit scores, delinquencies, bankruptcies, and other financial health-related outcomes.
Our sample consists of households with active Chase checking accounts, defined as households that have at least one checking account, with at least five non-transfer transactions per month during our sample window (calendar years 2021 through 2023). To ensure that we have an accurate view into the household’s income, we limit our analysis to households with at least $12,000 in annual take-home income across their deposit accounts during our sample window. We limit our sample to households for whom we can observe and categorize the majority of their spending activity, removing households with more than 20 percent of spending occurring via non-Chase credit card payments.
The SCF measures pre-tax income, whereas we observe take-home income in our data. We apply a tax withholding rate of 22 percent to approximate pre-tax income when weighting results to match the SCF income distribution. https://www.federalreserve.gov/econres/scfindex.htm
Non-discretionary expenditures include debt payments and necessary spending, such as groceries, healthcare, utilities, and rent. Discretionary spending includes categories such as home appliances and furniture, department stores, clothing, and leisure categories such as restaurants, travel, and entertainment. Our discretionary income metric is equal to 75 percent of discretionary spending plus average monthly saving; in other words, we assume that 75 percent of the household’s monthly discretionary spending can be redirected to help cover expense shocks.
If the households’ credit cards already carry a revolving balance, then there is no additional interest-free grace period for new purchases, and new purchases begin accruing interest immediately. Our “free use of credit” metric assumes that all households are using credit cards that do not currently carry revolving balances. Our data cannot differentiate cards with revolving balances from those without, and we therefore cannot determine the interest cost of the first billing cycle of credit card use on a household-by-household basis. But using a conservative assumption that all credit cards contain revolving balances, we find that our results are not noticeably affected: assigning half a month of interest fees to all households during the first billing cycle (assuming a mid-cycle purchase date), our results do not change substantively. We observe less than 0.1 percent difference in the share of households able to cover a $400 or $1,600 expense using one month of credit, and the share of households able to cover the expense overall. Intuitively, this is unsurprising since 15 days of interest is small relative to the expense shocks we are considering: with a 23 percent APR and a $400 purchase, 15 days of compounded interest is less than $4, and we suppose that households with discretionary income will not put the entire $400 expense on a credit card. Since our results are robust to these two options, we assume households will pay no interest for the first billing cycle of credit card use.
https://www.nerdwallet.com/article/credit-cards/credit-card-grace-period
The amount of time between making a purchase on a credit card and having to pay back that purchase will be at least 21 days, the legally required minimum number of days between the last day of the billing period and the payment due date. For purchases made before the end of the billing period, the gap between purchase date and payment due date is often a month or longer and can be as much as seven or eight weeks. We simplify this by referring to paying the purchase back “within one month.”
While credit card APRs are often high relative to other types of loans, limiting to two months of interest charges minimizes the amount paid in interest, and households are only considered able to use this option if their discretionary income can cover the full purchase plus interest repayment within the timeframe. We also note that the other option for immediate short-term loans are payday lenders, which have shorter repayment periods and much higher rates. Per CFPB data, a “typical two-week payday loan with a $15 per $100 fee equates to an annual percentage rate (APR) of almost 400 percent.”
https://www.consumerfinance.gov/ask-cfpb/what-is-a-payday-loan-en-1567/
We source credit card interest rates from the Board of Governors of the Federal Reserve System (US), Commercial Bank Interest Rate on Credit Card Plans. Our calculations vary interest rate over time based on these monthly rates.
https://fred.stlouisfed.org/series/TERMCBCCALLNS
See Wheat, Deadman, Sullivan (2024) for a more thorough discussion of how people can tap different sources of liquidity to pay for unexpected expenses.
Our leisure spending category is comprised of spending on restaurants, gift shops and other miscellaneous (non-clothing) retail, entertainment, travel (flights and accommodations) and miscellaneous durables such as sporting goods. Entertainment includes goods and services like concerts, video games, and gambling.
We limit this analysis to households in the middle of our low-income group, with annual take-home income between $27,000 and $33,000, to avoid over-reliance on the highest of the low-income households (those with income just below the $49,000 cutoff), which would under-estimate the amount of time of reduced discretionary spending needed to reach the stated cash savings goal.
We use a $1,000 cash savings goal for this exercise, as this cash savings amount corresponds with financial stability on par with prime credit score households.
Eligibility for most programs is based on whether a household’s income is below the federal poverty limit, which depends on the size of the household. See https://aspe.hhs.gov/sites/default/files/documents/1c92a9207f3ed5915ca020d58fe77696/detailed-guidelines-2023.pdf
Hankins, Hoekstra, and Skiba (2011) compare large prize winners ($50,000 to $150,000) to small prize winners and find that large prize winners are significantly less likely to file for bankruptcy in the 2 years after winning, but at 5 years after winning, bankruptcy rates between large winners and small winners is indistinguishable. Moreover, large winners have similar amounts of debts and assets at the time of their bankruptcies as small winners.
In a lab experiment, Cox, Kreisman, and Dynarski (2020) show that college students are very responsive to suggestions that they should (or shouldn’t) enroll in income-driven repayment plans to repay their student debt. Keys and Wang (2019) and Wang (2024) show that borrowers anchor heavily to default minimum payments set by lenders.
In general, see Lusardi and Mitchell (2023) and Kaiser and Lusardi (2024) for summaries of academic research on financial education and its effects.
The level of the cash buffer goal (14 days) was established in the same way as the $1,000 cash savings goal: set to correspond with financial stability on par with prime credit score households, as measured by missed payment risk.
Authors

Chris Wheat
President, JPMorganChase Institute

Daniel M. Sullivan
Consumer Research Director, JPMorganChase Institute

Erica Deadman
Consumer Research Lead, JPMorganChase Institute
Media Contact
Shelby Wagenseller, Shelby.Wagenseller@jpmchase.com