COVID-19 has rapidly transformed everyday life. While the scope of the pandemic is global, consumers experience the economic impacts locally.

To help decision-makers understand the impact of the COVID-19 pandemic on local economies, we created a local commerce data series which provides a place-based view of local spending. Based upon transactions made by over 70 million de-identified credit and debit card users a month on average, the series provides a view of local commerce spending growth.

The downloadable data and charts capture year-over-year growth rates and growth contributions for local commerce spending for 16 metro areas. The "national" view is constructed as the aggregate trend across these 16 metro areas. For all geographies, growth is broken out by consumer age, product type (e.g. restaurants), and channel (i.e. online/offline) to help local stakeholders better understand how consumer spending varied prior to and over the course of the pandemic.

Map

With spending growth continuing to decline after October 2020, cities are seeing their lowest growth rates since before July 2020

cur_periodid level growth_rate
2019-01 Atlanta 0.058200254
2019-01 Seattle 0.106540533
2019-01 San Francisco 0.194660931
2019-01 San Diego 0.127566422
2019-01 Portland 0.05077627
2019-01 New York 0.10076935
2019-01 New Orleans 0.023489644
2019-01 Miami 0.152645235
2019-01 Phoenix 0.159069561
2019-01 Houston 0.080988142
2019-01 Detroit 0.122944113
2019-01 Denver 0.119224576
2019-01 Dallas 0.050891634
2019-01 Columbus 0.135556388
2019-01 Chicago 0.118133044
2019-01 Los Angeles 0.18287275
2019-02 New Orleans -0.00611204
2019-02 Seattle 0.034042279
2019-02 San Francisco 0.170279957
2019-02 San Diego 0.100428302
2019-02 Portland 0.01200764
2019-02 Phoenix 0.094955987
2019-02 New York 0.070394499
2019-02 Miami 0.140630709
2019-02 Dallas 0.05868755
2019-02 Houston 0.056007999
2019-02 Detroit 0.140202397
2019-02 Denver 0.126166108
2019-02 Columbus 0.151885776
2019-02 Chicago 0.151411418
2019-02 Atlanta 0.025092288
2019-02 Los Angeles 0.156624955
2019-03 New Orleans -0.034050859
2019-03 Seattle 0.088329076
2019-03 San Francisco 0.173368281
2019-03 San Diego 0.109601782
2019-03 Portland 0.025262182
2019-03 New York 0.065281676
2019-03 Miami 0.148698845
2019-03 Phoenix 0.102947795
2019-03 Houston 0.049703928
2019-03 Detroit 0.130299703
2019-03 Denver 0.0983242
2019-03 Los Angeles 0.16726163
2019-03 Dallas 0.037930532
2019-03 Columbus 0.147366423
2019-03 Chicago 0.139137398
2019-03 Atlanta 0.021701731
2019-04 San Francisco 0.185532465
2019-04 San Diego 0.187287152
2019-04 Portland 0.161834647
2019-04 Phoenix 0.186276205
2019-04 New York 0.193287375
2019-04 New Orleans 0.139805074
2019-04 Miami 0.166560426
2019-04 Seattle 0.19470071
2019-04 Houston 0.137441359
2019-04 Detroit 0.188267109
2019-04 Denver 0.201827841
2019-04 Dallas 0.244084188
2019-04 Columbus 0.21858702
2019-04 Chicago 0.17446428
2019-04 Atlanta 0.18238502
2019-04 Los Angeles 0.188434426
2019-05 Seattle 0.180950289
2019-05 San Francisco 0.176372065
2019-05 San Diego 0.174837905
2019-05 Portland 0.14996004
2019-05 Phoenix 0.161447197
2019-05 New York 0.145972907
2019-05 New Orleans 0.127135103
2019-05 Miami 0.163247804
2019-05 Los Angeles 0.182043187
2019-05 Detroit 0.1252134
2019-05 Denver 0.17815327
2019-05 Dallas 0.215643562
2019-05 Columbus 0.153723053
2019-05 Chicago 0.128130775
2019-05 Atlanta 0.17541374
2019-05 Houston 0.111280997
2019-06 New Orleans 0.101447205
2019-06 Seattle 0.160328715
2019-06 San Francisco 0.147355187
2019-06 San Diego 0.147381997
2019-06 Portland 0.126136404
2019-06 New York 0.126184708
2019-06 Miami 0.128766176
2019-06 Phoenix 0.138001615
2019-06 Houston 0.091267004
2019-06 Atlanta 0.130534515
2019-06 Chicago 0.118124618
2019-06 Columbus 0.142265271
2019-06 Los Angeles 0.156218493
2019-06 Denver 0.154223443
2019-06 Detroit 0.118398978
2019-06 Dallas 0.192394533
2019-07 Seattle 0.143611913
2019-07 San Francisco 0.144366914
2019-07 San Diego 0.149774288
2019-07 Portland 0.117932096
2019-07 Phoenix 0.144954957
2019-07 New Orleans 0.082793632
2019-07 Miami 0.126786733
2019-07 New York 0.134241222
2019-07 Houston 0.112841009
2019-07 Detroit 0.130703753
2019-07 Denver 0.163206342
2019-07 Dallas 0.215842939
2019-07 Columbus 0.151017251
2019-07 Chicago 0.123566624
2019-07 Atlanta 0.136466381
2019-07 Los Angeles 0.150235659
2019-08 New Orleans 0.109608079
2019-08 Seattle 0.139874312
2019-08 San Francisco 0.130962802
2019-08 San Diego 0.136249471
2019-08 Portland 0.125500097
2019-08 Phoenix 0.135769746
2019-08 New York 0.123589018
2019-08 Miami 0.146596653
2019-08 Columbus 0.144239817
2019-08 Houston 0.111236313
2019-08 Detroit 0.127111472
2019-08 Denver 0.155933864
2019-08 Dallas 0.205170305
2019-08 Chicago 0.112574049
2019-08 Atlanta 0.13158135
2019-08 Los Angeles 0.150314868
2019-09 Miami 0.074857548
2019-09 San Francisco 0.107965394
2019-09 San Diego 0.120250777
2019-09 Portland 0.094836512
2019-09 Phoenix 0.116930292
2019-09 New York 0.111968439
2019-09 New Orleans 0.088385249
2019-09 Seattle 0.107474012
2019-09 Los Angeles 0.12239335
2019-09 Detroit 0.092449434
2019-09 Denver 0.126502876
2019-09 Dallas 0.185559243
2019-09 Columbus 0.120482228
2019-09 Chicago 0.081137815
2019-09 Atlanta 0.107736859
2019-09 Houston 0.081141324
2019-10 Seattle 0.122025039
2019-10 San Francisco 0.110762981
2019-10 San Diego 0.127691205
2019-10 Portland 0.101773636
2019-10 Phoenix 0.136009795
2019-10 New York 0.098529228
2019-10 New Orleans 0.077556599
2019-10 Miami 0.109083469
2019-10 Houston 0.104835049
2019-10 Detroit 0.108936662
2019-10 Denver 0.127622311
2019-10 Dallas 0.189640157
2019-10 Columbus 0.125064823
2019-10 Chicago 0.095740602
2019-10 Atlanta 0.110013292
2019-10 Los Angeles 0.133712907
2019-11 New Orleans 0.066491216
2019-11 Seattle 0.096982924
2019-11 San Francisco 0.075866696
2019-11 San Diego 0.090303069
2019-11 Portland 0.073909482
2019-11 Phoenix 0.099197128
2019-11 New York 0.083052936
2019-11 Miami 0.101439515
2019-11 Atlanta 0.090689726
2019-11 Houston 0.069346525
2019-11 Detroit 0.086846822
2019-11 Denver 0.092081182
2019-11 Dallas 0.159492591
2019-11 Columbus 0.102060737
2019-11 Chicago 0.070110508
2019-11 Los Angeles 0.104160885
2019-12 New Orleans 0.099462497
2019-12 Seattle 0.11553444
2019-12 San Francisco 0.109451284
2019-12 San Diego 0.116058859
2019-12 Portland 0.093744533
2019-12 Phoenix 0.122426099
2019-12 New York 0.104500964
2019-12 Miami 0.105312386
2019-12 Los Angeles 0.116875027
2019-12 Houston 0.10997912
2019-12 Detroit 0.113083445
2019-12 Denver 0.143825521
2019-12 Dallas 0.178345636
2019-12 Columbus 0.122302549
2019-12 Chicago 0.089880634
2019-12 Atlanta 0.121659866
2020-01 San Francisco 0.083807221
2020-01 San Diego 0.153334302
2020-01 Portland 0.214388855
2020-01 Phoenix 0.13407954
2020-01 New York 0.187590246
2020-01 New Orleans 0.214145165
2020-01 Miami 0.117137012
2020-01 Seattle 0.17923577
2020-01 Houston 0.12974581
2020-01 Detroit 0.128390618
2020-01 Denver 0.206390047
2020-01 Dallas 0.234639634
2020-01 Columbus 0.1450886
2020-01 Chicago 0.110829545
2020-01 Atlanta 0.242393627
2020-01 Los Angeles 0.110693868
2020-02 Seattle 0.30136091
2020-02 San Francisco 0.130119915
2020-02 San Diego 0.209503326
2020-02 Portland 0.293591724
2020-02 Phoenix 0.224033731
2020-02 New York 0.235926659
2020-02 New Orleans 0.25523888
2020-02 Miami 0.140649748
2020-02 Los Angeles 0.162071199
2020-02 Detroit 0.146293703
2020-02 Denver 0.224440532
2020-02 Dallas 0.272611768
2020-02 Columbus 0.164528553
2020-02 Chicago 0.137247008
2020-02 Atlanta 0.278349237
2020-02 Houston 0.170785822
2020-03 New York -0.062796082
2020-03 Seattle -0.065536499
2020-03 San Francisco -0.16428026
2020-03 San Diego -0.073396514
2020-03 Portland 0.007520426
2020-03 Phoenix 0.004895158
2020-03 New Orleans 0.010061623
2020-03 Miami -0.116983881
2020-03 Houston -0.082333659
2020-03 Detroit -0.113307536
2020-03 Denver -0.026728358
2020-03 Dallas 0.002670019
2020-03 Columbus -0.081463216
2020-03 Chicago -0.131089477
2020-03 Atlanta 0.000132238
2020-03 Los Angeles -0.120640196
2020-04 Seattle -0.252556278
2020-04 San Francisco -0.339393276
2020-04 Portland -0.199443758
2020-04 Phoenix -0.162044811
2020-04 New York -0.332145127
2020-04 New Orleans -0.209087073
2020-04 Miami -0.283899836
2020-04 San Diego -0.276892421
2020-04 Houston -0.267361557
2020-04 Detroit -0.271561171
2020-04 Denver -0.251522146
2020-04 Dallas -0.209237368
2020-04 Columbus -0.201954607
2020-04 Chicago -0.248295554
2020-04 Atlanta -0.248700265
2020-04 Los Angeles -0.285664846
2020-05 Seattle -0.201907327
2020-05 San Francisco -0.297026346
2020-05 San Diego -0.197025599
2020-05 Portland -0.158858373
2020-05 Phoenix -0.080548029
2020-05 New York -0.238631836
2020-05 New Orleans -0.110369239
2020-05 Miami -0.188493511
2020-05 Detroit -0.108724543
2020-05 Houston -0.154878032
2020-05 Denver -0.143437945
2020-05 Dallas -0.088309987
2020-05 Columbus -0.080939873
2020-05 Chicago -0.170097131
2020-05 Atlanta -0.145353437
2020-05 Los Angeles -0.221253362
2020-06 Phoenix -0.049477207
2020-06 New York -0.151594864
2020-06 Portland -0.110961234
2020-06 New Orleans -0.049902747
2020-06 San Francisco -0.229551089
2020-06 Seattle -0.151242734
2020-06 San Diego -0.133007065
2020-06 Miami -0.075079564
2020-06 Denver -0.085936423
2020-06 Houston -0.107664612
2020-06 Detroit -0.023812369
2020-06 Los Angeles -0.155582134
2020-06 Dallas -0.049007557
2020-06 Columbus -0.018451205
2020-06 Chicago -0.08330433
2020-06 Atlanta -0.07284014
2020-07 Seattle -0.097872853
2020-07 San Francisco -0.19040968
2020-07 San Diego -0.119855354
2020-07 Portland -0.071596287
2020-07 Phoenix -0.053372162
2020-07 New York -0.080541923
2020-07 New Orleans -0.012035514
2020-07 Miami -0.058751248
2020-07 Houston -0.112634932
2020-07 Detroit 0.007676247
2020-07 Denver -0.07325438
2020-07 Dallas -0.053206893
2020-07 Columbus -0.01960377
2020-07 Chicago -0.048005922
2020-07 Atlanta -0.062845592
2020-07 Los Angeles -0.131780042
2020-08 New Orleans -0.072791943
2020-08 Seattle -0.11085624
2020-08 San Francisco -0.192546589
2020-08 San Diego -0.130473723
2020-08 Portland -0.099350983
2020-08 Phoenix -0.06600566
2020-08 New York -0.105095377
2020-08 Miami -0.115907512
2020-08 Atlanta -0.090535561
2020-08 Houston -0.11862985
2020-08 Detroit -0.036225471
2020-08 Denver -0.090129149
2020-08 Dallas -0.069972996
2020-08 Columbus -0.055362105
2020-08 Chicago -0.069441782
2020-08 Los Angeles -0.143639415
2020-09 New Orleans -0.052938136
2020-09 San Francisco -0.166288752
2020-09 San Diego -0.093712336
2020-09 Portland -0.091716431
2020-09 Phoenix -0.03602762
2020-09 Seattle -0.099510076
2020-09 New York -0.06005734
2020-09 Miami -0.016540303
2020-09 Denver -0.068426714
2020-09 Houston -0.074718525
2020-09 Detroit 0.007066663
2020-09 Dallas -0.043159673
2020-09 Columbus -0.020588906
2020-09 Chicago -0.039615155
2020-09 Atlanta -0.068510129
2020-09 Los Angeles -0.119734383
2020-10 Seattle -0.080802999
2020-10 San Francisco -0.137571566
2020-10 San Diego -0.088539595
2020-10 Phoenix -0.031590485
2020-10 New York -0.060742681
2020-10 New Orleans -0.06513071
2020-10 Miami -0.056453265
2020-10 Portland -0.05313808
2020-10 Houston -0.080329209
2020-10 Detroit 0.006890302
2020-10 Denver -0.059890682
2020-10 Dallas -0.02524814
2020-10 Columbus -0.020408824
2020-10 Chicago -0.037121702
2020-10 Atlanta -0.053406823
2020-10 Los Angeles -0.097689411
2020-11 San Diego -0.108132546
2020-11 Portland -0.101943136
2020-11 Phoenix -0.069625924
2020-11 New York -0.106189313
2020-11 New Orleans -0.076018776
2020-11 Miami -0.098599445
2020-11 Los Angeles -0.115842564
2020-11 Dallas -0.072564893
2020-11 Detroit -0.058766485
2020-11 Denver -0.098943277
2020-11 Columbus -0.06736115
2020-11 Chicago -0.091026248
2020-11 Atlanta -0.087062505
2020-11 San Francisco -0.141351976
2020-11 Houston -0.108693479
2020-11 Seattle -0.122819195

While online growth continues to be positive over time, overall growth has been dominated by contractions in offline spending

cur_periodid level growth_contribution
2019-01 Offline 0.054711
2019-01 Online 0.065416
2019-02 Offline 0.046341
2019-02 Online 0.057807
2019-03 Offline 0.053917
2019-03 Online 0.047614
2019-04 Offline 0.11833
2019-04 Online 0.067444
2019-05 Offline 0.100992
2019-05 Online 0.05509
2019-06 Offline 0.093087
2019-06 Online 0.041793
2019-07 Offline 0.09182
2019-07 Online 0.048754
2019-08 Offline 0.100315
2019-08 Online 0.034275
2019-09 Offline 0.069672
2019-09 Online 0.039566
2019-10 Offline 0.080409
2019-10 Online 0.035524
2019-11 Offline 0.077758
2019-11 Online 0.012573
2019-12 Offline 0.056706
2019-12 Online 0.056801
2020-01 Offline 0.103059
2020-01 Online 0.046806
2020-02 Offline 0.133819
2020-02 Online 0.060741
2020-03 Offline -0.08828
2020-03 Online 0.006651
2020-04 Offline -0.2937
2020-04 Online 0.020402
2020-05 Offline -0.23236
2020-05 Online 0.047274
2020-06 Offline -0.17936
2020-06 Online 0.064189
2020-07 Offline -0.14659
2020-07 Online 0.0623
2020-08 Offline -0.15925
2020-08 Online 0.054829
2020-09 Offline -0.13202
2020-09 Online 0.062691
2020-10 Offline -0.12224
2020-10 Online 0.059182
2020-11 Offline -0.16776
2020-11 Online 0.067286

Despite rapid growth during the summer of 2020, spending on general goods (e.g. department stores, large online retailers) declined notably in Q4 2020

cur_periodid level growth_rate
2019-01 Clothing 0.136736026
2019-01 Fuel 0.048069832
2019-01 General Good 0.132183394
2019-01 Grocery 0.083942655
2019-01 Home 0.116628415
2019-01 Leisure 0.075688835
2019-01 Personal Care 0.189086127
2019-01 Pharmacy 0.051023066
2019-01 Professional Consumer 0.18801602
2019-01 Restaurant 0.181957235
2019-01 Transportation 0.204213143
2019-02 Transportation 0.216945163
2019-02 Restaurant 0.169333294
2019-02 Professional Consumer 0.173377454
2019-02 Pharmacy 0.048384056
2019-02 Personal Care 0.162024236
2019-02 General Good 0.118576086
2019-02 Home 0.07748679
2019-02 Grocery 0.073642396
2019-02 Fuel 0.034504132
2019-02 Clothing 0.097597248
2019-02 Leisure 0.049143667
2019-03 Personal Care 0.123107811
2019-03 Transportation 0.206363518
2019-03 Restaurant 0.178238347
2019-03 Professional Consumer 0.158648788
2019-03 Leisure 0.124811961
2019-03 Pharmacy 0.03480068
2019-03 Grocery 0.046472418
2019-03 Home 0.068696547
2019-03 General Good 0.100363676
2019-03 Fuel 0.075522254
2019-03 Clothing 0.069060841
2019-04 Restaurant 0.191392403
2019-04 Professional Consumer 0.23869508
2019-04 Pharmacy 0.143479308
2019-04 Personal Care 0.230860181
2019-04 Leisure 0.235644723
2019-04 Transportation 0.264454712
2019-04 Grocery 0.156177301
2019-04 General Good 0.191667517
2019-04 Fuel 0.188914006
2019-04 Clothing 0.186717774
2019-04 Home 0.155497058
2019-05 Transportation 0.263921692
2019-05 Restaurant 0.216413765
2019-05 Professional Consumer 0.23189898
2019-05 Pharmacy 0.091581424
2019-05 Personal Care 0.176889936
2019-05 Leisure 0.190686482
2019-05 Grocery 0.124239373
2019-05 General Good 0.15436382
2019-05 Fuel 0.144326333
2019-05 Clothing 0.10791984
2019-05 Home 0.104035146
2019-06 Personal Care 0.125905114
2019-06 Transportation 0.211676198
2019-06 Restaurant 0.191501787
2019-06 Professional Consumer 0.19223422
2019-06 Leisure 0.181950274
2019-06 Pharmacy 0.066973055
2019-06 Grocery 0.118666794
2019-06 Clothing 0.091284306
2019-06 Fuel 0.092883649
2019-06 Home 0.085013024
2019-06 General Good 0.141705501
2019-07 Transportation 0.181079897
2019-07 Restaurant 0.16058578
2019-07 Professional Consumer 0.229955047
2019-07 Personal Care 0.159555123
2019-07 Leisure 0.279188573
2019-07 Pharmacy 0.079228393
2019-07 Grocery 0.10341264
2019-07 General Good 0.154849137
2019-07 Fuel 0.111197829
2019-07 Clothing 0.072690726
2019-07 Home 0.132494464
2019-08 Pharmacy 0.060208304
2019-08 Transportation 0.14841928
2019-08 Restaurant 0.189940591
2019-08 Professional Consumer 0.184435168
2019-08 Personal Care 0.143991884
2019-08 Fuel 0.091669401
2019-08 Home 0.104540864
2019-08 Grocery 0.121439848
2019-08 General Good 0.133346726
2019-08 Clothing 0.065858231
2019-08 Leisure 0.232851732
2019-09 Personal Care 0.110290285
2019-09 Restaurant 0.149452901
2019-09 Professional Consumer 0.224820574
2019-09 Pharmacy 0.057046941
2019-09 Transportation 0.116217832
2019-09 Leisure 0.233539722
2019-09 Grocery 0.071852465
2019-09 General Good 0.118508948
2019-09 Fuel 0.080860016
2019-09 Clothing -0.000191038
2019-09 Home 0.1097657
2019-10 Restaurant 0.159365256
2019-10 Professional Consumer 0.1673739
2019-10 Pharmacy 0.049902732
2019-10 Personal Care 0.136002076
2019-10 Leisure 0.233445007
2019-10 Transportation 0.104256102
2019-10 Grocery 0.097112049
2019-10 General Good 0.121627632
2019-10 Fuel 0.084118766
2019-10 Clothing 0.027416143
2019-10 Home 0.099296353
2019-11 Transportation 0.086035728
2019-11 Restaurant 0.169538614
2019-11 Professional Consumer 0.130244718
2019-11 Pharmacy 0.038705569
2019-11 Personal Care 0.126502865
2019-11 Leisure 0.179825664
2019-11 Grocery 0.096966097
2019-11 General Good 0.045133442
2019-11 Fuel 0.101275608
2019-11 Clothing -0.020299681
2019-11 Home 0.060070946
2019-12 Pharmacy 0.055658065
2019-12 Transportation 0.095593206
2019-12 Restaurant 0.10743481
2019-12 Professional Consumer 0.202290203
2019-12 Personal Care 0.079334242
2019-12 Leisure 0.197618574
2019-12 Home 0.14056239
2019-12 Grocery 0.054579642
2019-12 General Good 0.147399602
2019-12 Fuel 0.137448295
2019-12 Clothing 0.085583152
2020-01 Restaurant 0.185558793
2020-01 Professional Consumer 0.194032354
2020-01 Pharmacy 0.090311653
2020-01 Personal Care 0.139771474
2020-01 Leisure 0.261354009
2020-01 Transportation 0.112517835
2020-01 Grocery 0.11040293
2020-01 General Good 0.13942091
2020-01 Fuel 0.205627545
2020-01 Clothing 0.070290437
2020-01 Home 0.121756899
2020-02 Transportation 0.11309409
2020-02 Restaurant 0.22065154
2020-02 Professional Consumer 0.209620966
2020-02 Pharmacy 0.11893563
2020-02 Personal Care 0.171743049
2020-02 Leisure 0.304313487
2020-02 Grocery 0.165171741
2020-02 General Good 0.205048916
2020-02 Fuel 0.229300381
2020-02 Clothing 0.124247313
2020-02 Home 0.178156133
2020-03 Pharmacy 0.154524681
2020-03 Transportation -0.435912191
2020-03 Restaurant -0.348104414
2020-03 Professional Consumer -0.036513636
2020-03 Personal Care -0.434249513
2020-03 Leisure -0.209350124
2020-03 Home -0.035362392
2020-03 Grocery 0.344261502
2020-03 General Good 0.032705525
2020-03 Fuel -0.162551735
2020-03 Clothing -0.456450929
2020-04 Restaurant -0.558452188
2020-04 Professional Consumer -0.187831753
2020-04 Pharmacy -0.16678114
2020-04 Personal Care -0.890627396
2020-04 Leisure -0.457128518
2020-04 Transportation -0.821620269
2020-04 Grocery 0.171286768
2020-04 General Good -0.060208005
2020-04 Fuel -0.479151387
2020-04 Clothing -0.659318694
2020-04 Home -0.116762952
2020-05 Transportation -0.769779505
2020-05 Restaurant -0.442605506
2020-05 Professional Consumer -0.157651725
2020-05 Pharmacy -0.140180641
2020-05 Personal Care -0.728741443
2020-05 Leisure -0.440935973
2020-05 Grocery 0.161069625
2020-05 General Good 0.041693619
2020-05 Fuel -0.365415205
2020-05 Clothing -0.507310817
2020-05 Home 0.060362028
2020-06 Pharmacy -0.08823372
2020-06 Transportation -0.664116012
2020-06 Restaurant -0.341096483
2020-06 Professional Consumer -0.01363751
2020-06 Personal Care -0.456801958
2020-06 General Good 0.117536703
2020-06 Home 0.167090392
2020-06 Grocery 0.074115929
2020-06 Leisure -0.367613244
2020-06 Fuel -0.261064958
2020-06 Clothing -0.276247211
2020-07 Restaurant -0.265528356
2020-07 Professional Consumer 0.01492988
2020-07 Pharmacy -0.065126608
2020-07 Personal Care -0.384288224
2020-07 Leisure -0.382822191
2020-07 Transportation -0.602961635
2020-07 Grocery 0.092212218
2020-07 General Good 0.123785627
2020-07 Fuel -0.228062128
2020-07 Clothing -0.164947951
2020-07 Home 0.130559651
2020-08 Transportation -0.581209021
2020-08 Restaurant -0.242716644
2020-08 Professional Consumer -0.022760621
2020-08 Pharmacy -0.117078945
2020-08 Personal Care -0.440756147
2020-08 Leisure -0.362627242
2020-08 Grocery 0.038359419
2020-08 General Good 0.100385257
2020-08 Fuel -0.230344101
2020-08 Clothing -0.237625258
2020-08 Home 0.099877597
2020-09 Pharmacy -0.088706594
2020-09 Restaurant -0.203330099
2020-09 Professional Consumer 0.039867572
2020-09 Transportation -0.536460155
2020-09 Personal Care -0.328570946
2020-09 General Good 0.126673697
2020-09 Home 0.173694633
2020-09 Grocery 0.03541159
2020-09 Fuel -0.228633555
2020-09 Clothing -0.11079142
2020-09 Leisure -0.322023556
2020-10 Transportation -0.529508592
2020-10 Restaurant -0.165384512
2020-10 Pharmacy -0.110268433
2020-10 Personal Care -0.301113705
2020-10 Leisure -0.333157289
2020-10 Professional Consumer 0.014353888
2020-10 Grocery 0.057659939
2020-10 General Good 0.141516137
2020-10 Fuel -0.23791192
2020-10 Clothing -0.118894391
2020-10 Home 0.112754365
2020-11 Restaurant -0.271727323
2020-11 Clothing -0.169407958
2020-11 Fuel -0.272211885
2020-11 General Good 0.098621228
2020-11 Grocery 0.008288792
2020-11 Home 0.12124383
2020-11 Leisure -0.322655097
2020-11 Personal Care -0.367991035
2020-11 Pharmacy -0.142397783
2020-11 Professional Consumer 0.028499098
2020-11 Transportation -0.557641029

We hope these data can provide a better understanding of current local economic conditions and inform ongoing efforts to aid the recovery of local economies.  Let us know of any feedback or questions by emailing institute@jpmchase.com.

Frequently Asked Questions

How can these data be used?

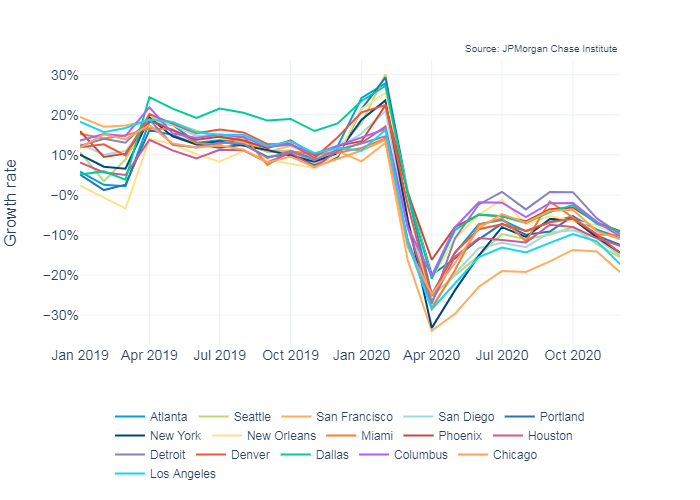
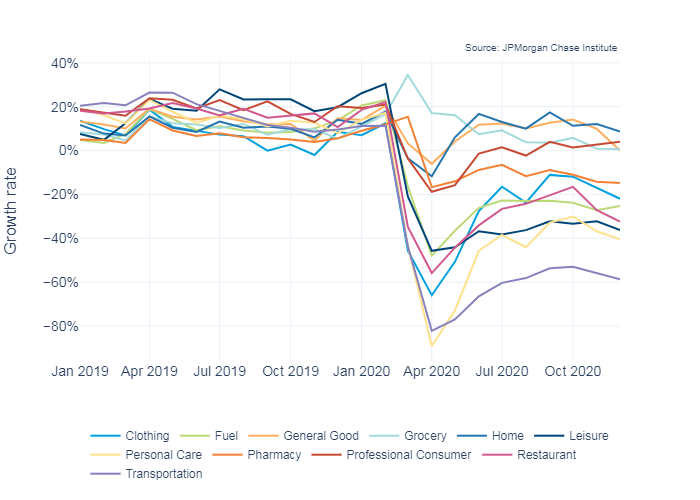
Local commerce data provide a lens into the evolution of retail spending in the metro areas we track. In the context of COVID-19, these data enable local stakeholders to better understand initial responses to the pandemic, the path of consumer spending as policy interventions change, and the extent to which spending is returning to pre-pandemic levels. In more general terms, local commerce patterns illuminate trends in a critical fiscal base for state and local governments.

The data are organized in a directory structure by geography. Data that span the 16 metro areas we track are in the National directory. The same views for each metro area sit in the sub-directories of the CBSA directory. Each data view is comprised of both a chart and the associated data file.

Users of local commerce data should also be aware that these series are versioned products. The goal is to provide the best view of local commerce spending we can provide at any given time. To the extent that updates are made to sampling, reported measures, or the set of attributes (e.g. channel), the older versions of the data series will be made available for comparison.

Which geographic areas are included in the data?

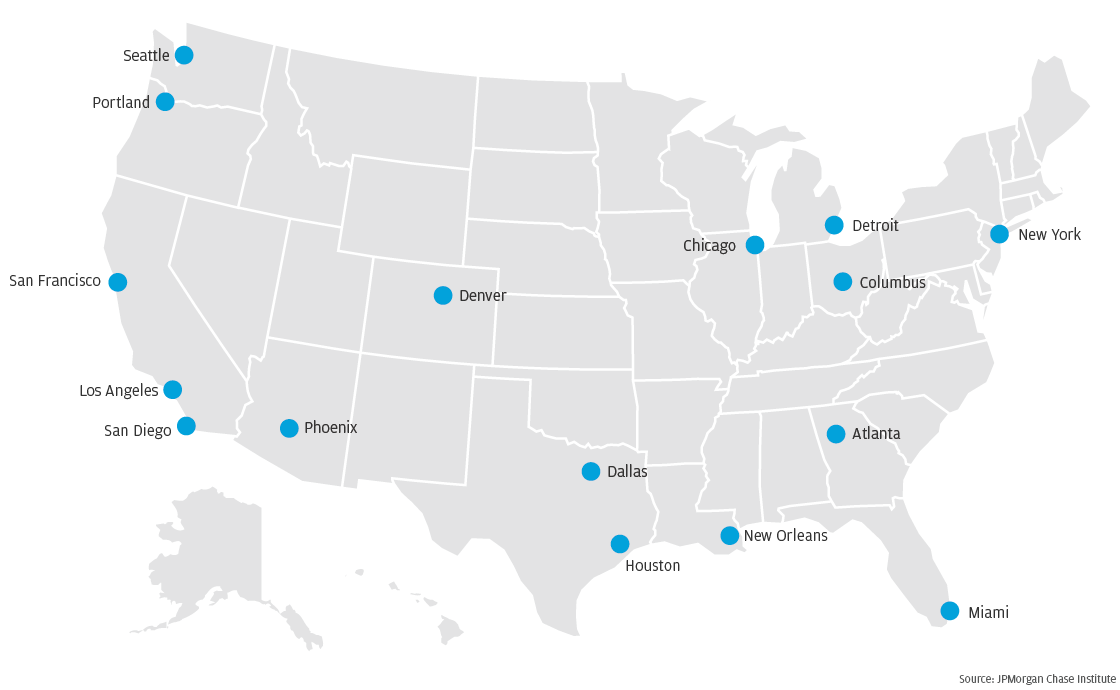
There are 16 metro areas in data:

  • Atlanta
  • Chicago
  • Columbus
  • Dallas-Ft. Worth
  • Denver
  • Detroit
  • Houston
  • Los Angeles
  • Miami
  • New Orleans
  • New York
  • Phoenix
  • Portland (OR)
  • San Diego
  • San Francisco
  •  Seattle

Each metro area is represented by the collection of ZIP codes that intersects the relevant

Core-Based Statistical Area.

How is the Pandemic Spending (PS) series different than former Local Commerce Index (LCI)?

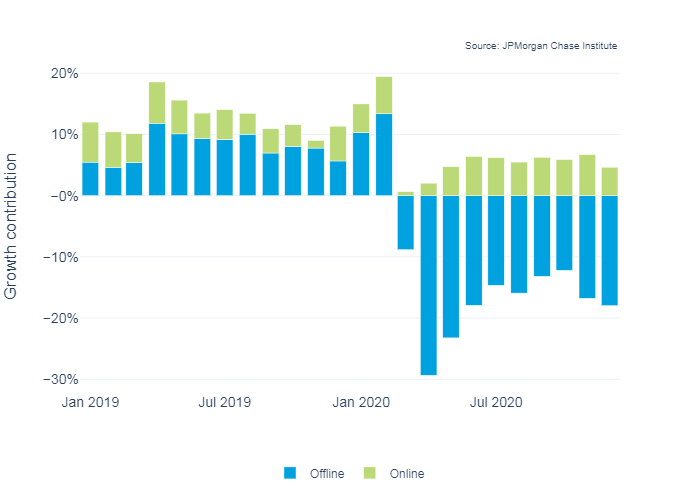
The Pandemic Spending (PS) series differs from the former Local Commerce Index (LCI) in two primary ways. First, the former LCI was based on transactions that occurred at establishments located inside of metro areas (i.e. the Sellers'/Merchant view). The PS series, by contrast, is based upon transactions that are executed by people that live inside certain metro areas (i.e. the Buyers'/Consumer view). These two views overlap, but are different in important ways. Among other things, the Buyers' view provides better coverage of online purchases.

The PS series also differs in the sampling approach. Both the former LCI and the PS series rely on a version of a "stable cohort". The former holds exactly the same population in the target (e.g. January 2020) and comparison (e.g. January 2019) months in the growth calculation, while the latter only prevents new customers from joining the sample over the course of the year. The PS series also differs by freezing the sample in the last month of the status quo, February 2020. See "How are people selected for inclusion into the sample?" for details.

How are people selected for inclusion into the Pandemic Spending series sample?

To the extent we are seeking to estimate growth in the broader economy, we leverage a stable cohort approach. For transactions to be included in our series, the person making the transaction must have cleared our transaction threshold in the target month (e.g. January 2020) and the comparison month in the growth calculation (e.g. January 2019). This approach precludes, for example, growth due to new people entering the sample over the course of the year. This sampling approach also means that the population used for the January 2020 calculation can differ from the population used for the December 2019 calculation.

To focus on effect of the pandemic, we stop updating our population in February 2020. Since we require people to clear a transaction threshold to be included in the sample, we would have lost people when everyone pulled back spending. To measure the impact of the pandemic-related reduction in spending, we freeze our sample to include those people that cleared the threshold in February and use the same population for all subsequent months.

Acknowledgments

We thank Chris Wheat, Marvin Ward, Lindsay Relihan, James Duguid, Anu Raghuram, and Bryan Kim for their substantial contributions to the production and analysis of this data series. We also thank colleagues at the JPMorgan Chase Institute for their comments and suggestions.