
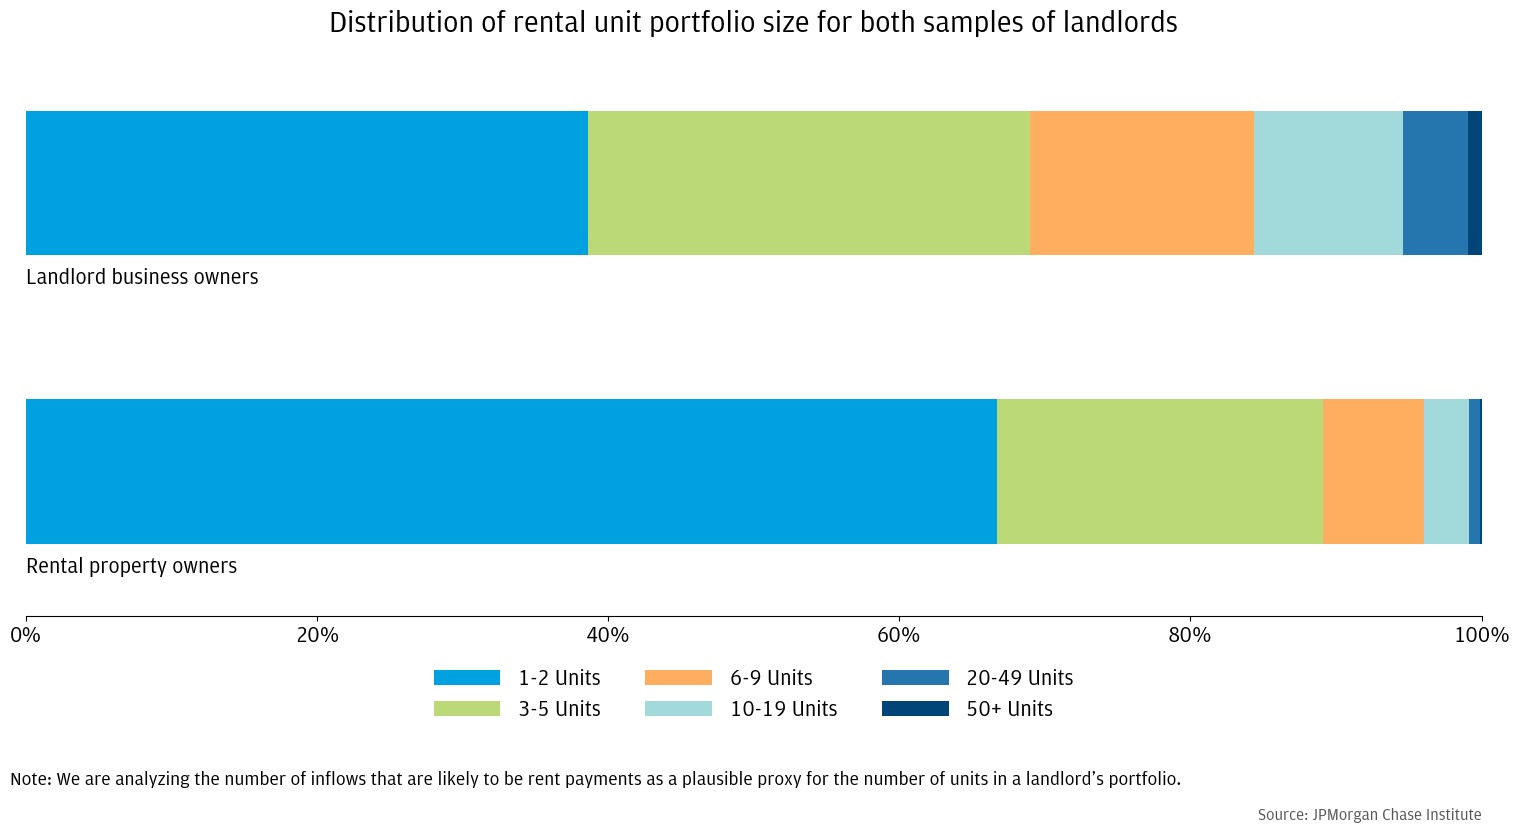
Figure 1: The rental property owners skew more towards smaller landlords than the landlord business owners sample, but for both samples, most landlords have 5 or fewer rental inflows (implying 5 or fewer units in their portfolio).

Creating thriving communities together
See how our clients and partners—from small business owners to workforce training leaders—work with JPMorganChase to drive meaningful impact and economic growth where they live and work.
Learn moreLatest news

Veteran’s Unconventional Path to Landing her Dream Job in Tech
U.S. Army Veteran Ashley Wigfall transitioned to a civilian role and charted her path to technologist through mentorship and skills training at the JPMorgan Chase tech hub in Plano, Texas.
Learn more
Findings
The COVID-19 pandemic hit renters harder than homeowners,1 leading policy makers to try to help renters with eviction moratoriums and billions of dollars of rental assistance. Given the critical role that landlords play in providing rental housing and their dependence on rental income, it is important to understand not just how the pandemic has affected tenants, but also the financial health of landlords.
Moreover, landlords give us a much-needed window into rent payment trends, which have been difficult to evaluate during the pandemic. Unlike the very centralized mortgage market, the rental market is disaggregated and largely made up of small to medium sized landlords. Large-scale representative data on rent payments do not exist.2 Of the nearly 50 million rental housing units, almost half are in rental properties with only one to four units and almost three-quarters of rental properties (41 percent of rental units) are owned by individual investors.3 Smaller landlords are especially important because landlords that own and operate two to four and five to fifty unit buildings provide most of the nation’s existing affordable housing stock.4
The financial health of landlords often crucially depends on their rental income. A Brookings Institute analysis of the Rental Housing Finance Survey finds that one-third of individual investor landlords are from low- to moderate-income households where their property income constitutes up to 20 percent of their total household income.5 In addition, the Urban Institute analyzed American Community Survey data to find that roughly a third of landlords of two-to-four-unit buildings are older than 65, meaning they are mostly retired and unlikely to have another source of income.6 Regardless of whether a tenant can make rent payments, landlords have costs related to their rental property such as mortgages, taxes, utilities, and maintenance expenses. While there is some flexibility in certain costs such as maintenance and mortgage payments (due to widespread forbearance), others (e.g., taxes) must be paid.
While many renters have been unable to continue paying rent because of the economic impact of the pandemic, policies aimed at helping renters might also threaten the financial health of landlords. Some have worried that eviction moratoriums might result in tenants not paying rent even when they have the means to do so, though evidence is limited. Almost $50 billion of rental assistance is available from the Emergency Rental Assistance Program and the American Rescue Plan Act, but distribution of the funds has been slow7 and landlords cannot apply for assistance without the tenant as a cosigner.
Using JPMorgan Chase small business and personal deposit account and mortgage servicing data, we examine how small to medium sized landlords fared during the pandemic. We evaluate their rental revenues, expenses, and balances using two samples: (1) landlord business owners: small business account holders who have indicated that they are a lessor of a residential property, and (2) rental property owners: Chase deposit account holders who also have a Chase mortgage on a multifamily or investment property. Our samples allow us to study smaller landlords and compare against pre-pandemic trends.
We find evidence that landlords lost rental revenue during the pandemic, especially in the spring of 2020 when rental revenue for the median landlord was down about 20 percent relative to 2019. Revenues recovered quickly and the median landlord ended 2020 with a modest decline of 3 percent in rental revenue compared to 2019. Our data does show that a larger share of landlords experienced a decline of more than 10 percent in revenues during the pandemic (38 percent in 2020 vs. 34 percent in 2019) but most of the volatility appears to be normal year-to-year volatility. Importantly, as revenues were declining, landlords cut expenses by an amount greater than their rental income declined, which resulted in overall higher cash balances. We find the financial outcomes of landlords varied across cities: landlords in San Francisco, New York, and Miami–and specifically the core city centers in those areas–experienced the greatest declines in rental revenues while landlords in Phoenix, Houston, and Dallas collected the same amount or more rental income in 2020 than 2019. For those with mortgages, part of the cost cutting came through taking advantage of widely available mortgage forbearance programs with up to 10 percent of landlords opting into forbearance and 7 percent missing payments. In general, landlords in cities with greater declines in rental revenues were more likely to cut costs and more likely to miss mortgage payments.
Unprecedented government support through programs such as unemployment insurance (UI) and economic impact payments (EIP) during the pandemic likely provided needed relief to renters and helped to prevent a worse outcome for landlords. However, the larger cash buffers landlords built during the pandemic are misleading as an indicator of financial health. While many landlords were able to pull back on expenses as revenues declined, in many instances, they are simply delaying costs that they will need to make up down the road. Missed mortgage payments will need to be paid eventually and deferred maintenance could result in higher costs later if the fixes were preventative. Furthermore, a slightly larger share of landlords than normal experienced substantial declines in rental income. For this pocket of the landlord population, the challenging task of getting rental relief that has already been allocated out faster will be critical to both making them whole and staving off eviction for their tenants.
We use de-identified administrative data on Chase small business, mortgage, and deposit account customers to find two samples of landlords. As shown in Table 1, we construct two distinct samples of landlords. The first is a sample of roughly 18,000 landlord business owners, who have a Chase business checking account and self-identify their industry as Lessors of Residential Buildings and Dwellings. This sample of landlord business owners gives us a relatively clean view of landlord-related revenues and expenses and is the source of insight for Findings 1 and 2 on broad trends in rental revenues, expenses, and balances.
The second sample of landlords is a group of roughly 32,000 rental property owners who have a Chase mortgage on an investment or multifamily property as well as a Chase personal checking account. The strength of this sample is that we are able to observe whether these landlords missed mortgage payments on the rental property, an indicator of financial hardship and the focus of Finding 3. In addition, this sample allows us to characterize the household financial attributes of landlords.
A caveat with this sample is that the personal deposit accounts likely mix landlord- and household-related activity. We attempt to isolate potential rental payments removing as many other types of inflows (e.g., direct deposit labor income, UI payments, tax refunds, etc.) as possible. Based on manual inspection of the relevant transactions as well as summary statistics of our data8, we are confident that a large majority of the remaining inflows are highly likely to be rent payments. However, we also believe that there is more noise in the rent payment measure for this sample than for the landlord business owners sample. Therefore, the vast majority of our analysis of rental revenues for landlords will be based on the landlord business owners sample.
Table 1: Requirements and descriptions for two samples of landlords
| Sample 1: Landlord business owners | Sample 2: Rental property owners |
|---|---|
Requirements:
Sample: 17,646 landlords
| Requirements:
Sample: 32,152 landlords
|
The median landlord in our landlord business owner sample has 4 to 5 rental revenue inflows per month with each inflow being approximately $1300. If we assume that each inflow represents one rental unit, this sample skews toward smaller landlords, but there is also a range of sizes represented. Thirty eight percent are very small landlords with 1-2 inflows, almost half have between 3 and 9 inflows, and 16 percent have over 10 inflows with just one percent above 50 inflows (Figure 1).
In contrast, judging by the number of inflows that could represent rental payments, the sample of rental property owners is composed of even smaller landlords. The median landlord receives just 2 rental inflows per month with each inflow being approximately $1,200. The majority (67 percent) in this sample has just 1-2 inflows, 22 percent have 3-5 inflows, and the bulk of the remainder (7 percent) have 6-9 inflows. Only 4 percent of this sample have more than 10 inflows. (Figure 1)
Figure 1: The rental property owners skew more towards smaller landlords than the landlord business owners sample, but for both samples, most landlords have 5 or fewer rental inflows (implying 5 or fewer units in their portfolio).
Because the landlords in our rental property owners sample are receiving their rental inflows in their personal deposit account, we can examine other activity in that account to learn more about their financial lives. Most have other income in addition to their rental income. About 54 percent receive direct deposit labor income and of those that do, they receive about $5,200 of after-tax direct deposit labor income per month. Total monthly inflows (excluding transfers) for these landlords is about $8,000, meaning that rental income (about $2500) is about 31 percent of their total income. The median landlord has over $22,000 in their checking account.
Table 2: For rental property owners, more than half receive direct deposit labor income and rental income is about 31 percent of all inflows excluding transfers.
Potential Rental Income in 2019 | All Rental Property Owners |
|---|---|
| Median Number of Inflows per Month | 2 |
| Median Amount of Each Inflow | $1,220 |
| Median Total Potential Rental Income | $2,512 |
Other Income in 2019 | |
| Percentage Receiving Direct Deposit Labor Income | 54% |
| Median Monthly Direct Deposit Labor Income* | $5,236 |
| Median Monthly Total Inflows except Transfers** | $8,012 |
Balances in 2019 | |
| Median Household Balance | $22,559 |
*conditional on receipt of deposit labor income
**including rental income
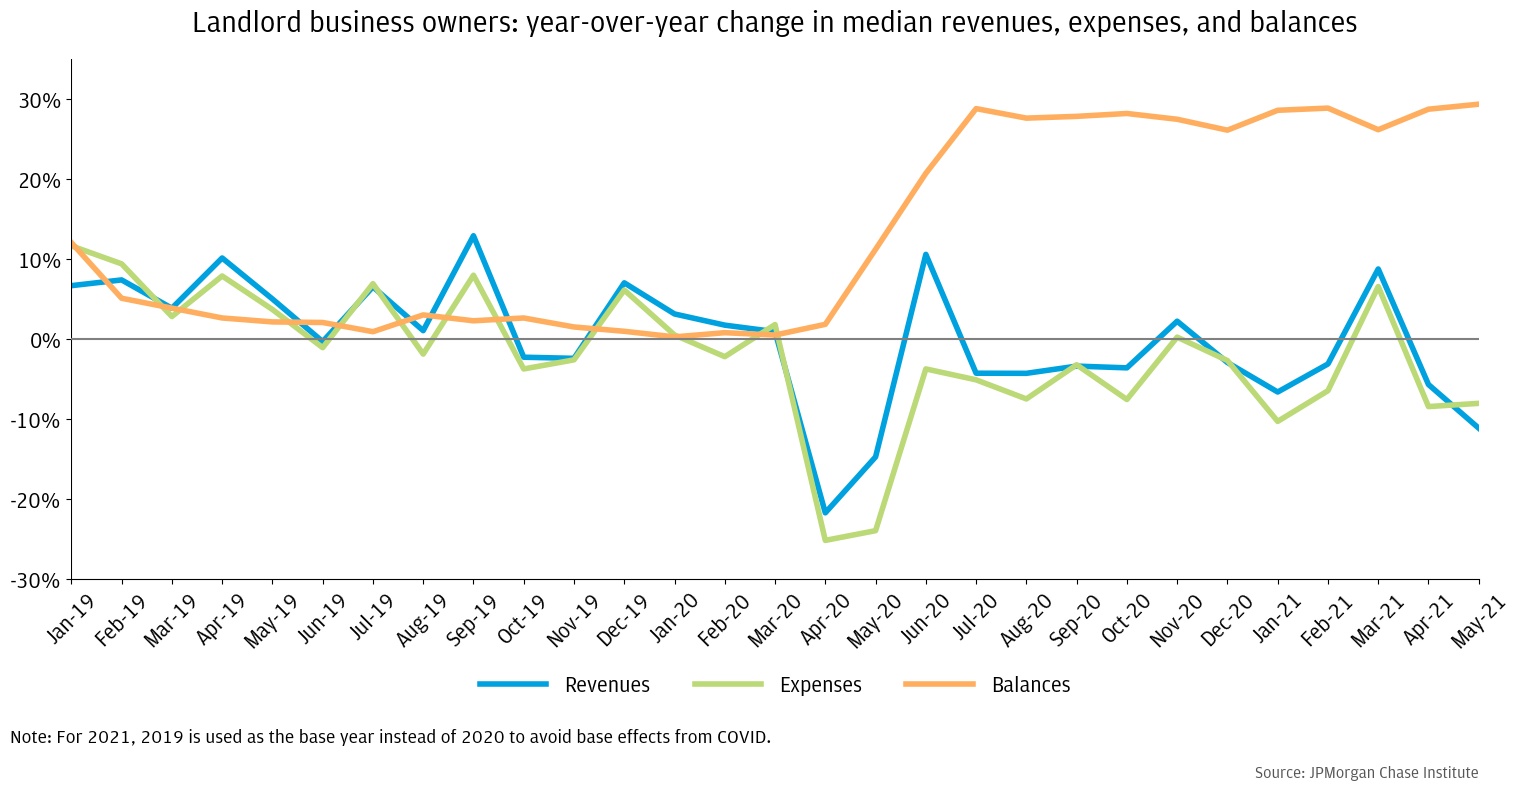
To better understand the impact of the COVID-19 pandemic on landlords, we begin by analyzing rental revenues, expenses, and balances10 for our sample of landlord business owners. As shown in Figure 2, revenues fell by about 20 percent in April and May 2020 as the pandemic hit. At the same time, landlords cut expenses by even more than revenues fell, with expenses falling by about 25 percent. The degree to which both of these series fell is squarely beyond the typical volatility we see in these series in the year leading up to the pandemic. Both revenues and expenses mostly recovered in the summer of 2020 and through the present, though the series remained volatile. While these data do not lend insight into what types of expenses fell (e.g., mortgages, maintenance, taxes, etc.), we will analyze the extent to which landlords used mortgage forbearance to miss mortgage payments in the third finding using our rental property owners sample.
Since expenses fell more than rental revenues, and rental revenues recovered more than expenses did in June, overall balances were higher during the pandemic. By May 2020, balances11 were 11 percent higher on a year over year basis, by June 2020, 21 percent higher, and starting in July 2020, they remained between 25 and 30 percent higher (Figure 2). While higher balances are often a sign of greater financial health, landlords are likely not better off in the long run. To the extent they are deferring expenses that will need to be paid eventually (e.g., mortgage payments missed due to forbearance, needed maintenance, etc.) and the missed rent payments are not recoverable, landlords are simply building up a temporary cash cushion. This observed pattern during the pandemic of expenses falling more than revenues while cash balances increased is not unique to landlords and mirrors what JPMorgan Chase Institute data has shown across all small businesses (Farrell, Diana et al. 2020).
Figure 2: As the pandemic hit in the spring of 2020, rental income declined dramatically, but landlords cut back on expenses even more, resulting in an increase in their cash buffer.
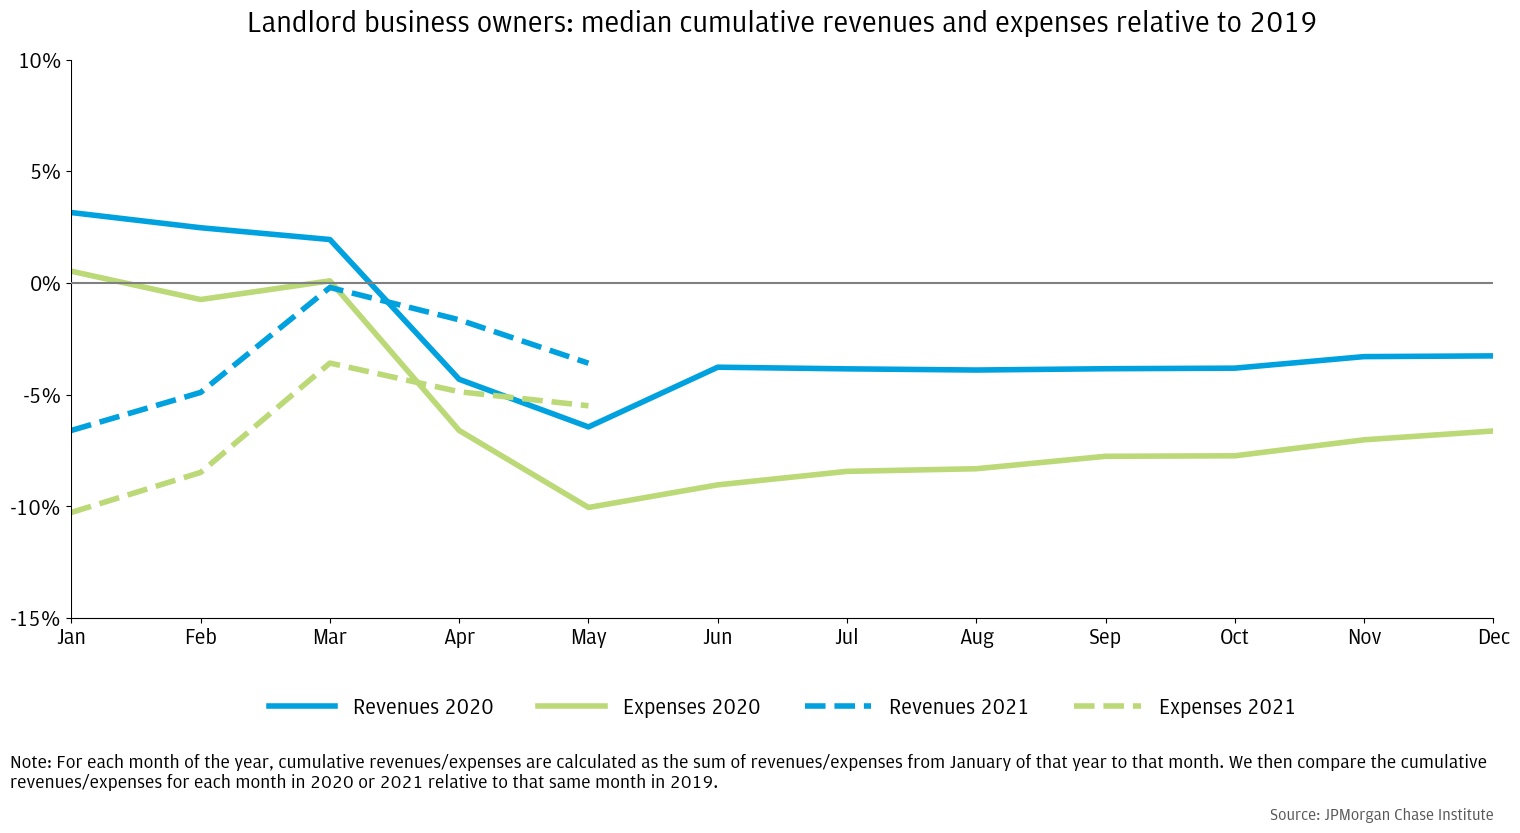
To further investigate how far landlords fell behind during the pandemic, we measure cumulative revenues and expenses in Figure 3 and compare each month of 2020 and 2021 to the same point in time in 2019. Specifically, for each month of the year, cumulative revenues/expenses are calculated as the sum of revenues/expenses from January of that year to that month. We then compare the cumulative revenues/expenses for each month in 2020 or 2021 relative to that same month in 2019.
The median landlord ended 2020 with 3.3 percent less in total rental revenue and 6.6 percent less in total expenses than 2019. In 2021, landlords started the year down relative to 2019 but are catching up. As of the end of May 2021, revenues are down 3.6 percent and expenses are down about 5.5 percent.
Figure 3: Landlords ended 2020 with 3.3 percent less in total revenue and 6.6 percent less in total expenses than 2019.
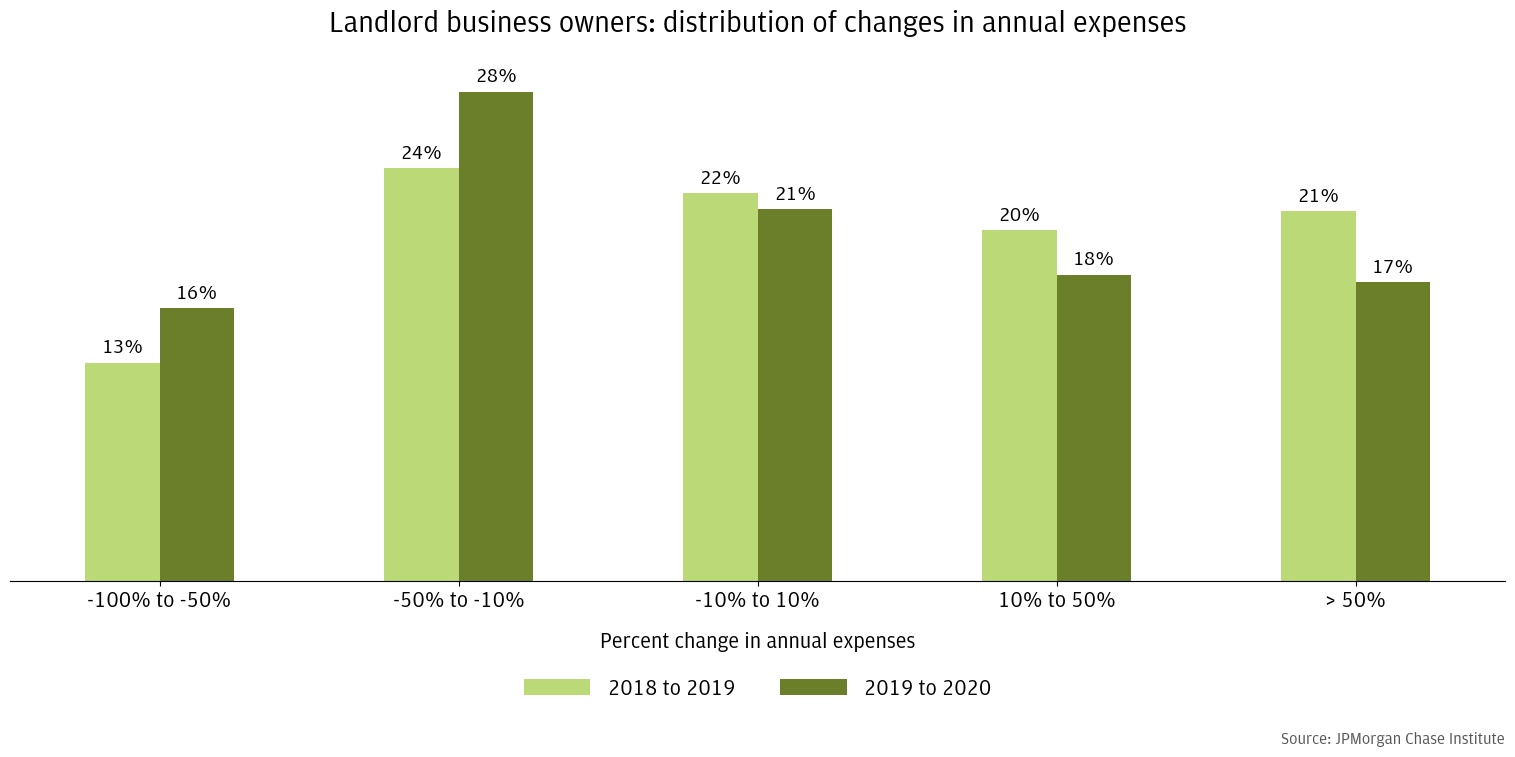
Even though our data is likely to have more volatility than survey data since we are only observing accounts at one bank and landlords may have accounts at multiple institutions, one advantage of our data is that we can compare changes during the pandemic to changes pre-pandemic. Also, while our previous charts show what is happening at the median, it is also important to understand how the distribution of revenues and expenses has changed.
Figure 4 evaluates the distribution of changes in cumulative annual revenues and expenses in 2020 to the same changes in 2019. There is a slight leftward shift in both of the distributions. Slightly more landlords experienced large decreases in total revenues in 2020 relative to 2019. Thirty eight percent of landlords experienced a more than 10 percent decline in total revenues versus 33 percent in 2019. Similar to the trends in rental income and expenses in Figure 3, the leftward shift in the distribution appears to be more pronounced for expenses than for rental income. Forty four percent of landlords cut their expenses by more than 10 percent in 2020 versus 37 percent of landlords in 2019.
Therefore, it does appear that more landlords had very substantial declines in revenues and expenses, but most of this volatility appears to be normal year to year volatility that would have occurred absent the pandemic. The high degree of volatility we observe in our data is not unusual for banking data and could partially reflect landlords changing their banking preferences as well as volatility in rental income.
Figure 4a: More landlords experienced declines in rental revenues in 2020 than in 2019.
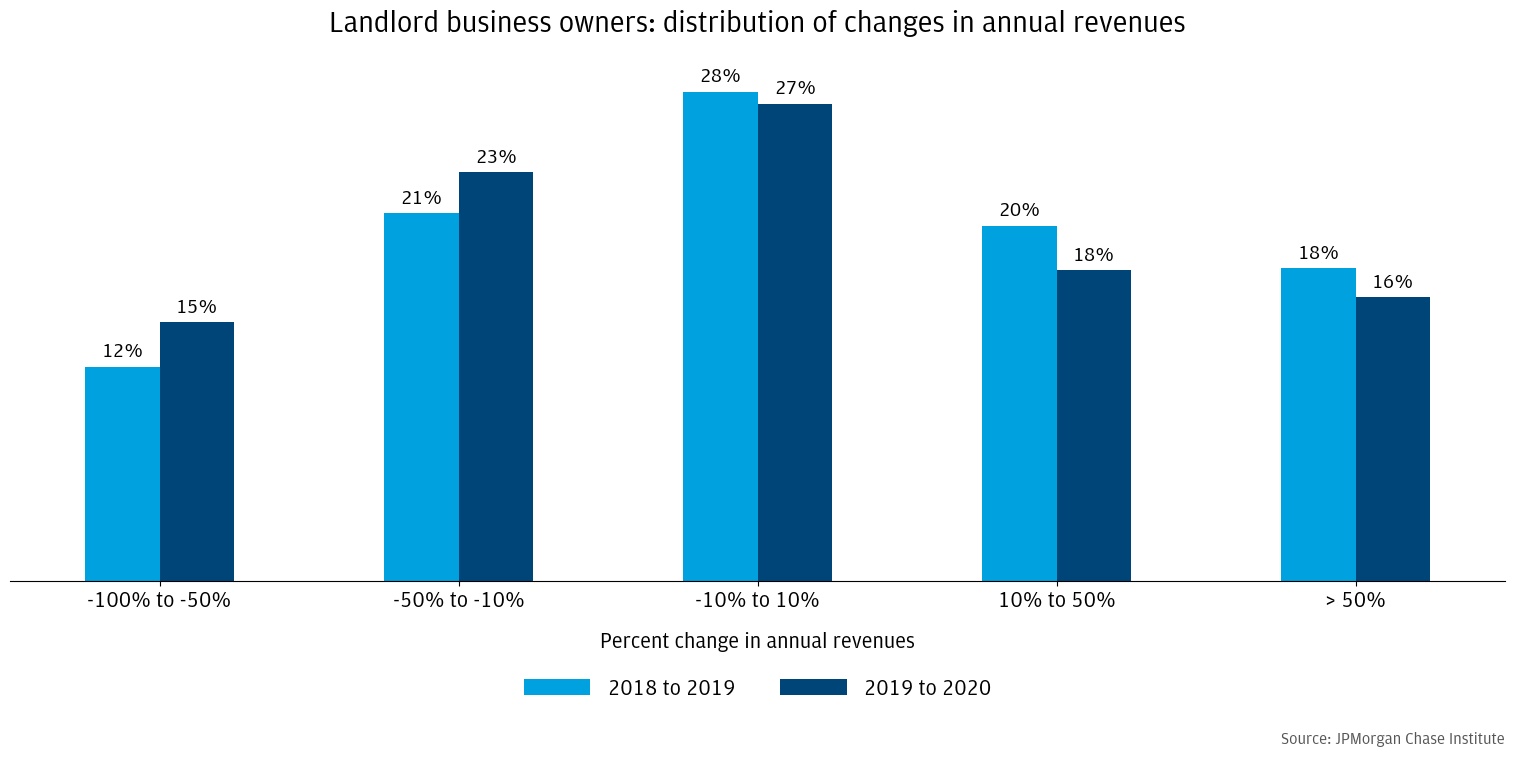
Figure 4b: More landlords experienced declines in expenses in 2020 than in 2019.
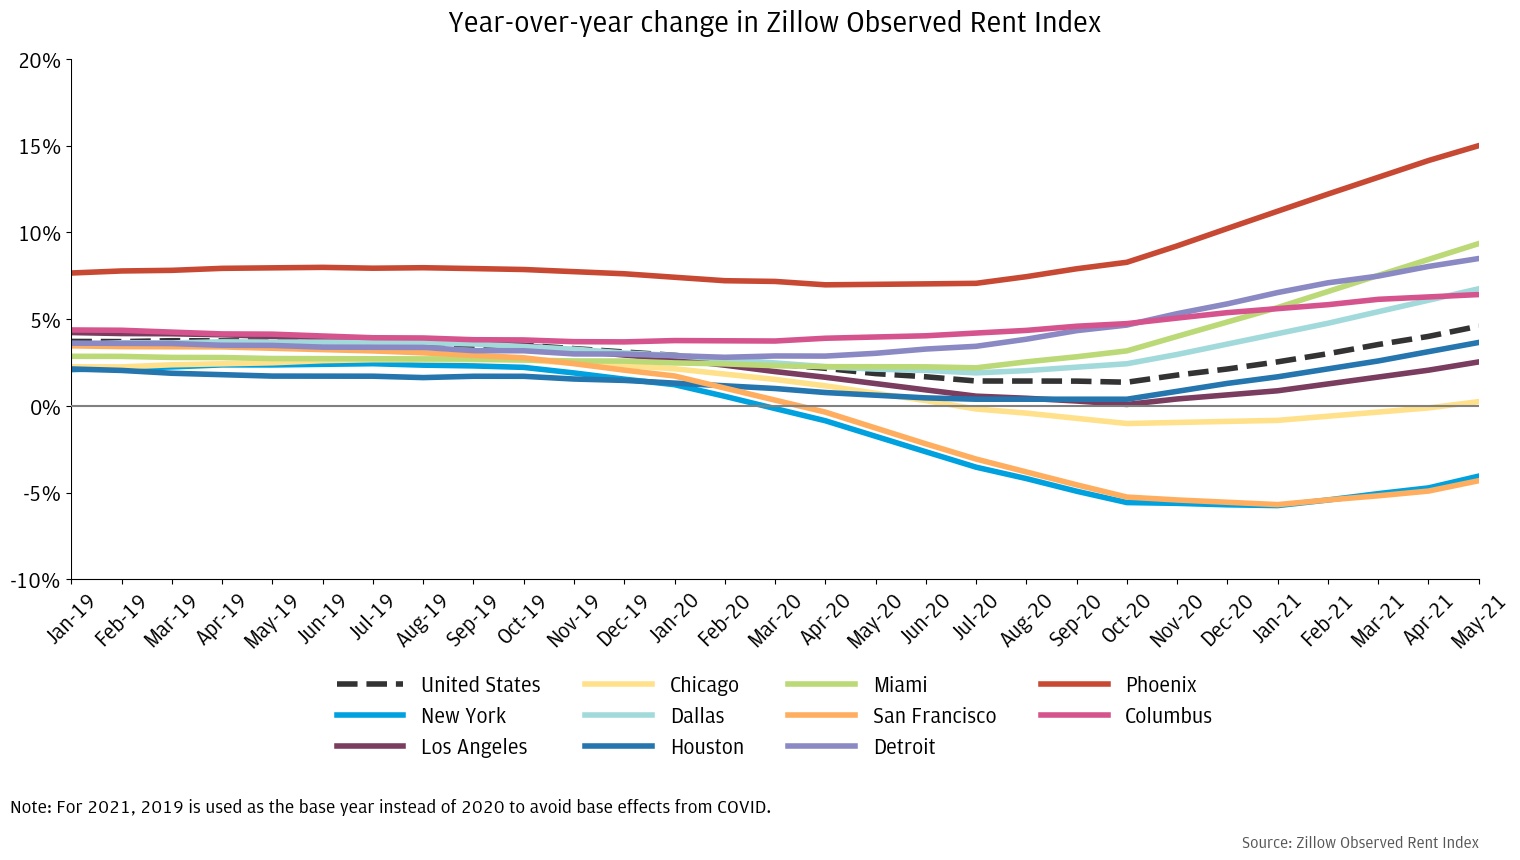
Overall, our data provide evidence that rental revenues declined significantly early on in the pandemic and mostly recovered in the summer resulting in a modest decline for the median landlord by the end of 2020. Importantly, these changes in rental revenues could be reflecting two different factors: (1) unpaid rent (in full or partially) and (2) a price effect due to changes in rent. With renters bearing much of the economic brunt of the pandemic (Greig et al. 2021), more renters are expected to have unpaid rent. At the same time, many parts of the country experienced dramatic changes in rents during the pandemic. While some areas saw higher rents during part or all of 2020, dense and expensive cities such as New York City and San Francisco saw very large decreases in rent that at least partially reversed in 2021 (Figure 5).12
Figure 5: Rent changes during the pandemic varied considerably across cities in the US.
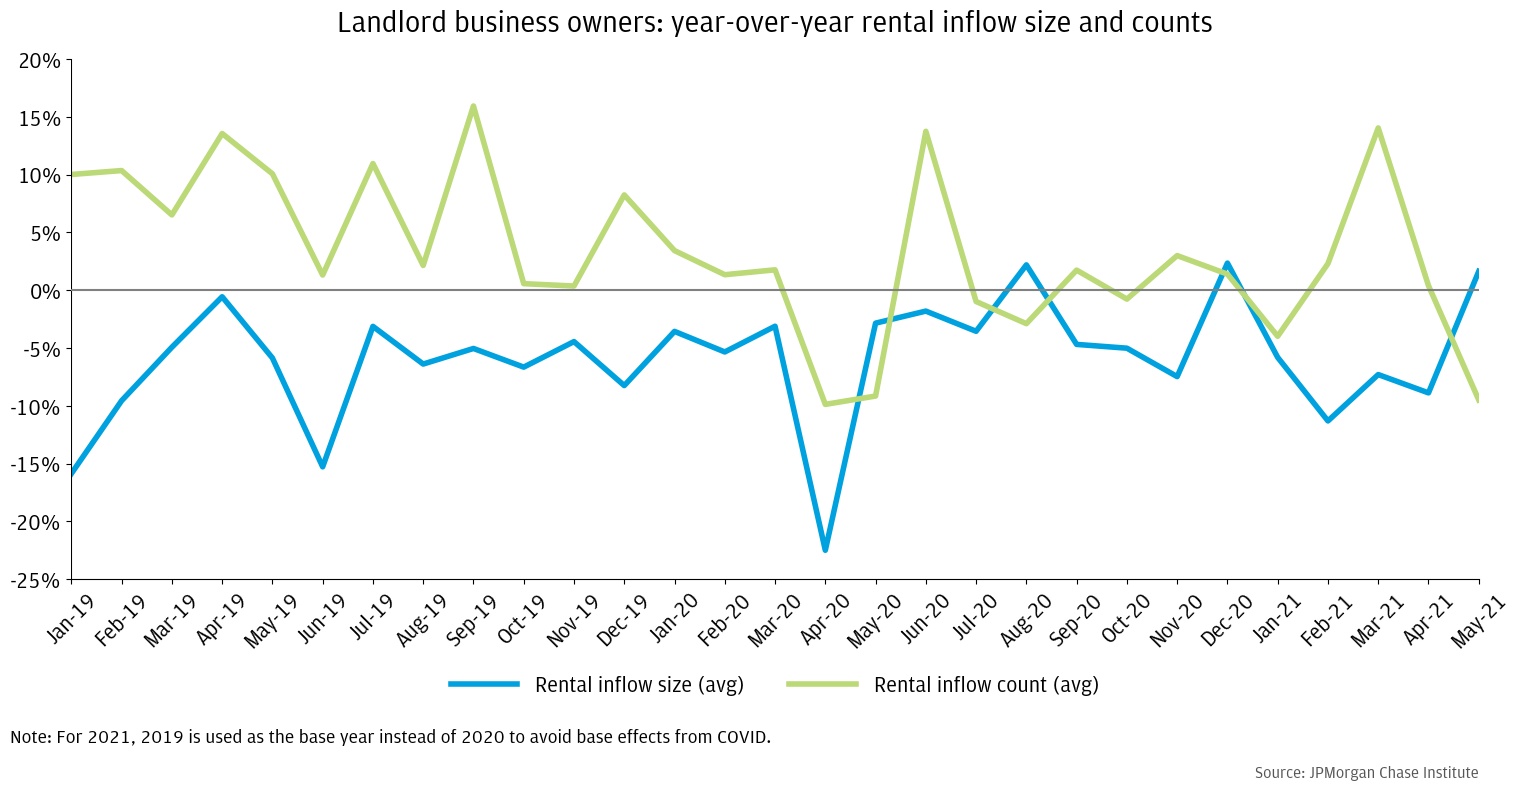
We attempt to partially disentangle the two effects by separating out the number of rental inflows from the size of rental inflows received by landlord business owners in Figure 6. The number of inflows should capture renters skipping rent payments entirely while the size of inflows may reflect both partial payments and price changes. Our data show that both the number of inflows and the size of inflows dropped in April and May 2020 indicating that both effects may be at play. However, it is unlikely that any price changes would have taken effect immediately with the onset of the pandemic as it takes time for landlords to change their prices and most tenants would have been locked into leases. More likely, tenants were making partial payments and/or landlords were giving current tenants discounts in the event of job loss (especially if landlords could get forbearance on their mortgages and eviction was not possible). Over the course of the year, however, the “size of inflows” measure is more likely to be reflecting price effects and these effects are likely to have played a significant role in cities such as New York and San Francisco (see further discussion in Finding 2). In either case, both past-due rent and rental price drops exact a financial toll on landlords.
Figure 6: Both the size and the number of rental inflows dropped early on during the pandemic.
There are a few other sources of data on rent payments and landlords which suggest varying degrees of delinquency throughout the pandemic. While the National Multifamily Housing Council (NMHC) data13 and the Urban Institute’s tracker14 of rent payments to mom-and-pop landlords using Avail data15 both suggest less loss of rental revenue than our data does, the Census Pulse Survey suggests significantly greater loss16. None of these data sources are directly comparable to our data, however. Our data also show much more volatile rental revenues than a survey from the Terner Center (Decker, 2021)17 with more landlords experiencing larger drops and gains and fewer landlords experiencing similar revenues, which is typical of banking data compared to survey data. Finally, a survey from the Harvard Joint Center for Housing (de la Campa, 2021) also suggests greater rental delinquency than our data18, but they measure rent collected against rent owed while we simply measure rent collected.
In summary, our data show that landlords experienced modest losses in rental revenue during the pandemic rather than the catastrophic losses that might have been expected given the pandemic’s economic impact on renters. While our data also demonstrate that a material portion of landlords saw very large declines in rental revenues in 2020, much of this reflected normal year to year variation. Importantly, landlords were able to cut back on—or at least defer—expenses quickly when revenues declined sharply in the early months of the pandemic and build up a larger cash buffer. Unprecedented government supports, such as stimulus and expanded unemployment benefits, that were available to qualifying renters and landlords during the pandemic likely enabled many renters to keep making rent payments and prevented worse losses for landlords.
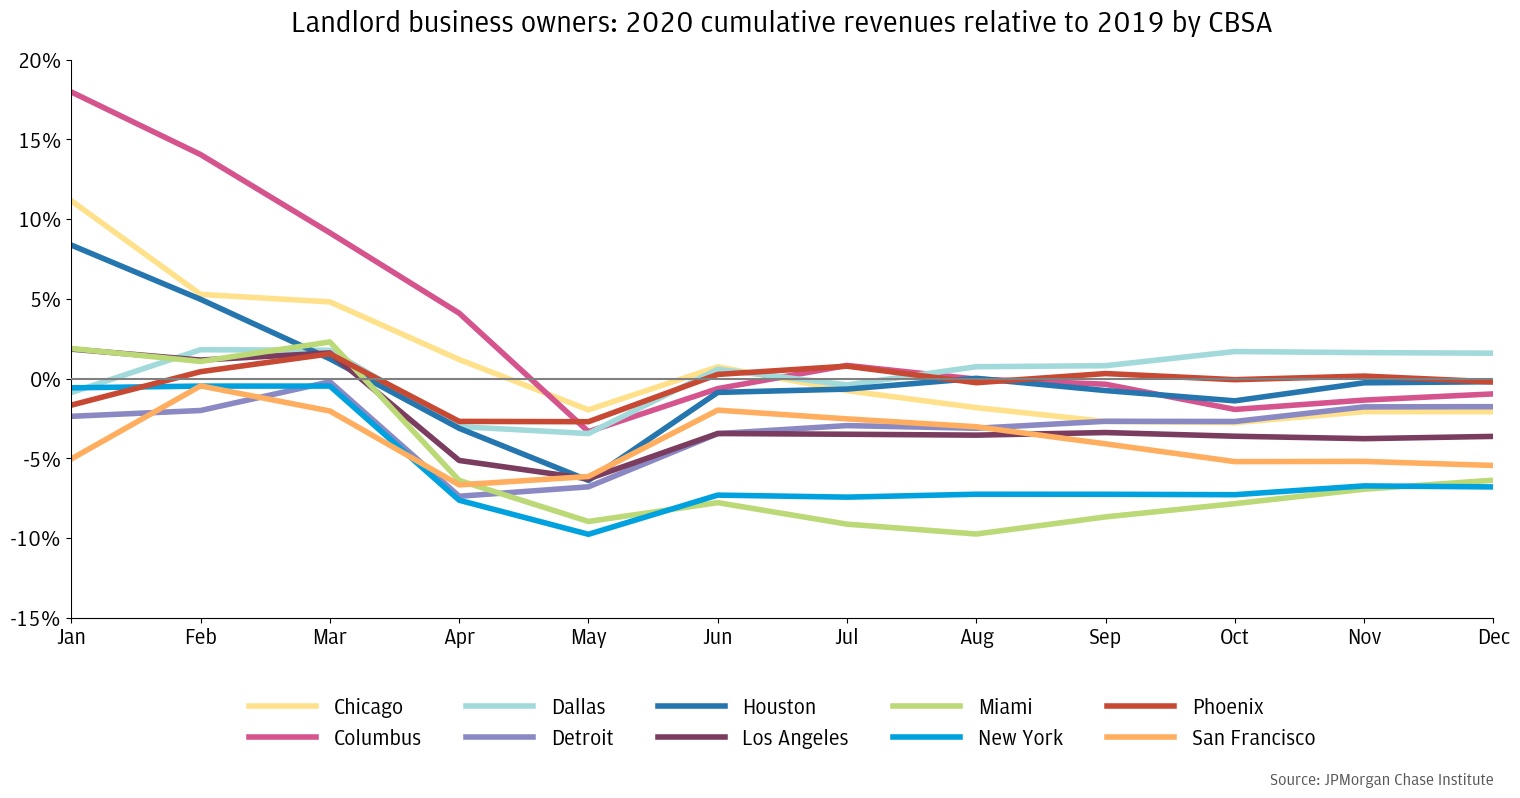
During the pandemic, different cities around the U.S. experienced very different case rates and COVID-related policies (e.g., closures and NPIs). Migration patterns spurred by the possibility of remote work also impacted cities differently with many people moving from higher cost areas to lower cost ones. Therefore, the impact of the pandemic on landlords is likely to be highly location-dependent.
As shown in Figure 7, cumulative revenues declined the most in 2020 relative to 2019 in New York, Miami, and San Francisco as all three were down between 5.4 and 6.8 percent by the end of the year. As a travel hub and dense city, the New York area was hit hard early on by the pandemic and many residents—at least temporarily—relocated to surrounding areas causing rents to decline precipitously in 2020. San Francisco with its large concentration of technology sector workers also saw large rent declines as remote work allowed employees to work from anywhere.19 Unlike New York and San Francisco, Miami did not experience large rent declines (Figure 5) so the drop in revenues is likely to have been driven by higher levels of unpaid rent.
In contrast, Phoenix, Houston, and Dallas did not see as steep of a decline early in the pandemic and ended the year with essentially the same or even a slightly higher level of revenues compared to 2019. Both differences in rent changes over the year and differences in delinquency could be driving the contrast with New York, Miami, and San Francisco. These cities did not experience large rent declines (Figure 5) and they were in states with less restrictive lockdown measures, which might have contributed to less negative employment effects on renters in those states.20 That might explain why these cities had less of a decline than New York and San Francisco. Although lockdowns in Miami were less restrictive, the dramatic decline in travel and tourism may have contributed to rental revenue declines in Miami.21
Figure 7: Revenues were down the most in New York, Miami, and San Francisco and were flat or up in Phoenix, Houston, and Dallas.
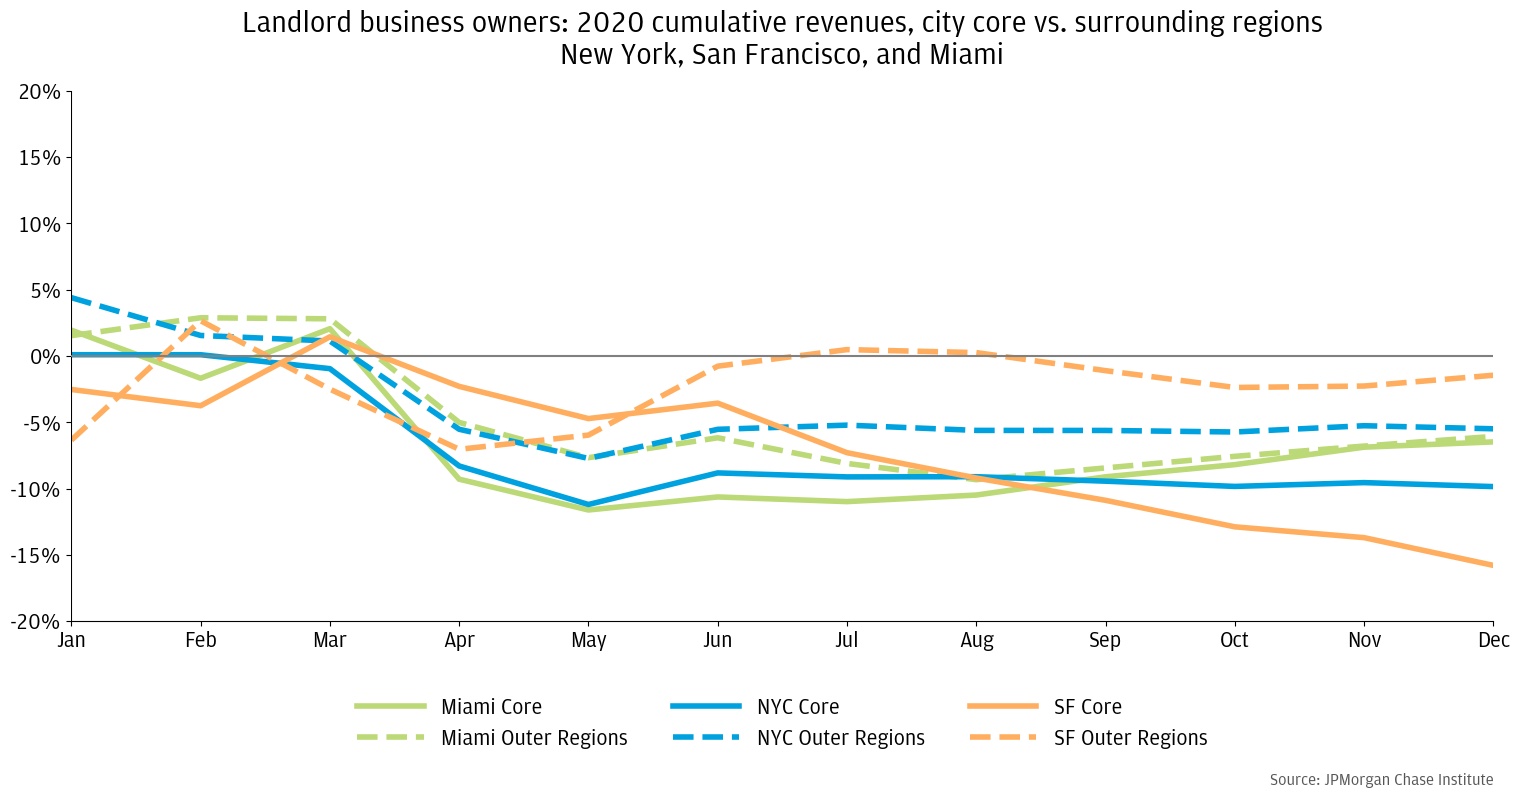
In Figure 7, we looked at each city’s Core Based Statistical Areas (CBSAs), which has the drawback of lumping the core city (e.g., New York City) with the surrounding area (e.g., Westchester and southern Connecticut). During COVID, many residents leaving cities such as New York and San Francisco moved to surrounding areas within commuting distance causing housing prices in the suburbs to increase while prices in the city declined. To pick up on these differential trends, in Figure 8, we use zip codes to separate out the core city from the surrounding areas22 for the three cities with the worst rental revenue declines: New York, Miami, and San Francisco.
Indeed, for both New York City and San Francisco, landlords in the core city saw significantly larger rental revenues declines than those in the surrounding areas. In San Francisco, the core city was down 16 percent by the end of the year versus 2 percent in the surrounding areas and in New York City, the core city was down 10 percent versus 6 percent in the surrounding areas. In Miami, landlords in the core city were down more than those in the surrounding areas in the spring and summer of 2020, but they caught up by the end of the year.
Figure 8: For landlords in both New York and San Francisco, revenues were down more in the core city versus surrounding areas. In Miami, the core city caught up by the end of the year.
One might wonder if there was geographic variation in whether landlords cut back on expenses and, if so, whether places that experienced the steepest declines in rental revenues were also the places where landlords chose to cut back on expenses the most. We find both. Figure 9 shows significant variation in the drop in 2020 expenses across cities and a strong relationship between declines in rental revenue and declines in expenses.
Notably, landlords across all observed cities cut their expenses even if their revenues stayed flat or increased slightly. Landlords in New York and Miami decreased their 2020 expenses by 12 percent and 8 percent, respectively, while landlords in Columbus and Dallas cut their expenses by 2 percent or less.
Similar to overall national trends, all cities are below the 45 degree line, meaning that for landlords in all observed cities, the change in expenses in 2020 was more negative than the change in revenues, even if revenues increased. This indicates that landlords were largely reacting to declines in revenues when pulling back on expenses.
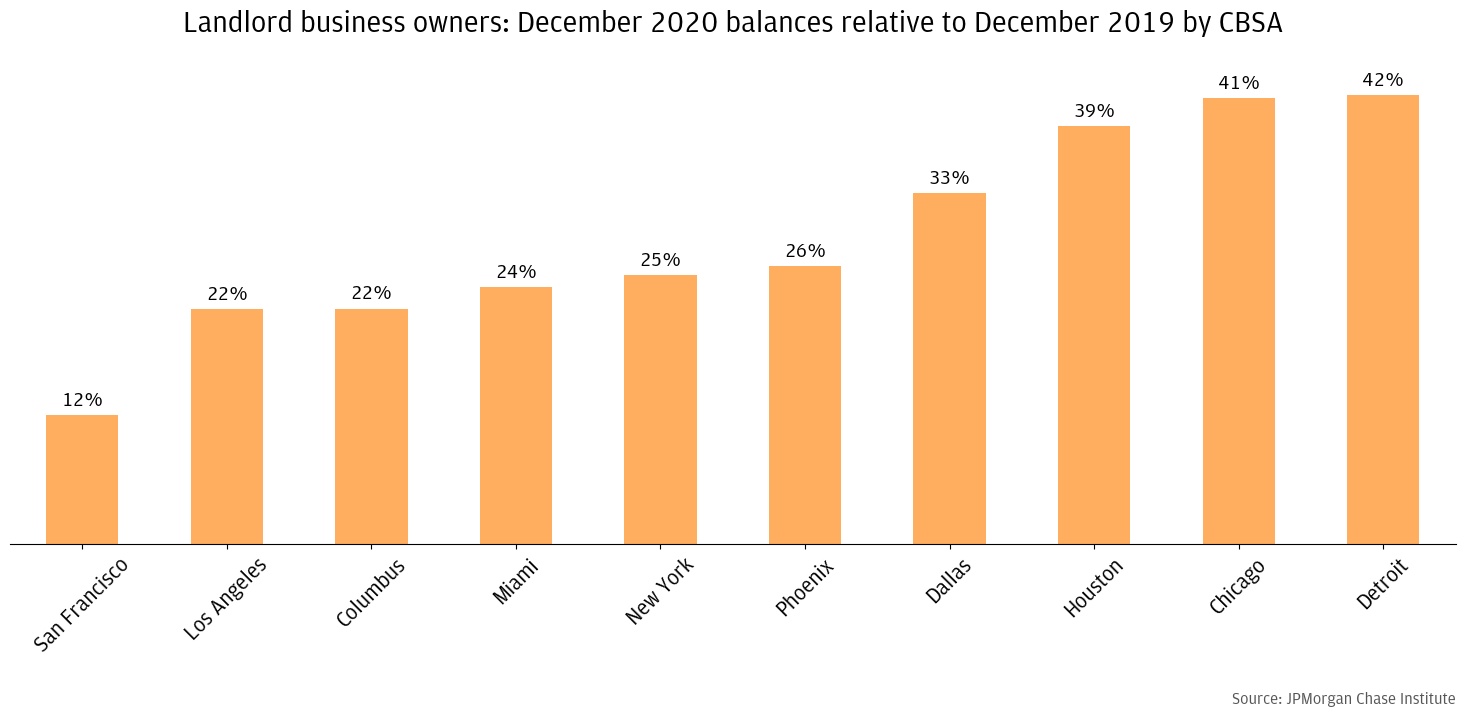
This also implies that landlords in all cities, even the ones with the largest declines in revenues, saw their balances grow—and in some cases, very dramatically—during the pandemic (Figure 10). That said, at the end of 2020, landlords in San Francisco had the smallest growth in balances (12 percent) relative to the end of 2019. Landlords in all other cities had growth of at least 20 percent and in the case of Chicago, Detroit, and Houston, around 40 percent.
Figure 9: In general, the cities with larger revenue declines also had larger declines in expenses. Also, landlords in all cities cut expenses by a greater percentage than the fall in rental revenues they experienced in 2020.
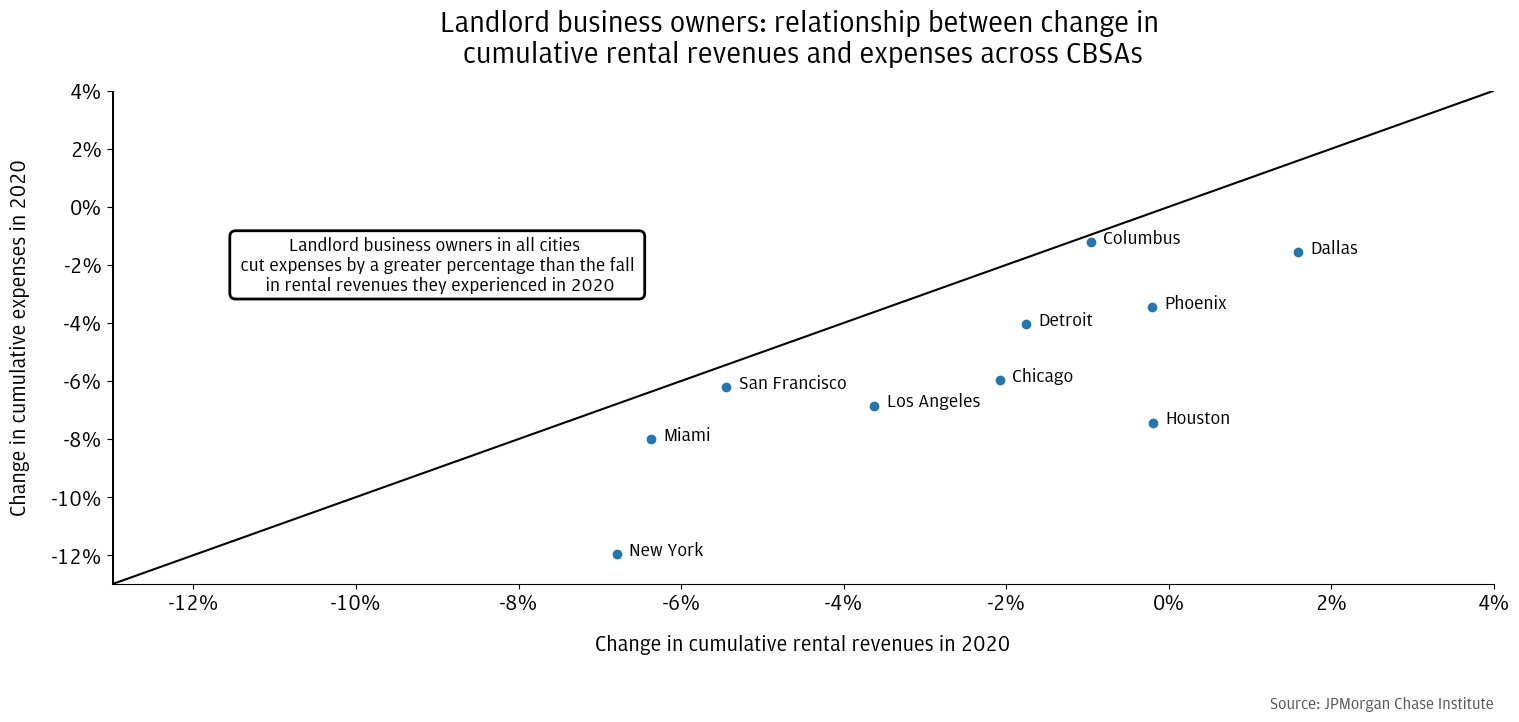
Figure 10: Even in the cities that saw the largest rental revenue declines, balances for landlords were still substantially higher because of decreases in expenses.
In summary, there was significant geographic variation in the financial outcomes of landlords. By the end of 2020, the typical landlord in the city cores of San Francisco and New York had received 16 percent and 10 percent lower rental revenues than in 2019, respectively. In contrast, the median landlords in Phoenix, Houston, and Dallas had fully recovered, if not increased, their rental income in 2020 (Figure 7). Landlords across cities pulled back on expenses to offset these rental losses, resulting in increased cash balances. We observed the largest cuts to expenses among landlords in New York and Miami. Next, we investigate what contributed to the fall in expenses and, specifically, whether landlords missed mortgage payments during the pandemic.
In Findings 1 and 2 we document that landlords pulled back on expenses in order to compensate for a fall in rental income. Next, we turn to our sample of smaller rental property owners to investigate the extent to which landlords used mortgage forbearance, one of the main forms of government support targeted at landlords, and missed mortgage payments as a way to cut back on expenses.
Before we dive into the results, recall that because the landlords in this sample receive their rent payments in their personal deposit accounts as opposed to a separate account for managing their rentals, we believe there is more noise in the rental payment measure for this sample than for the landlord business owners sample. However, since all of the landlords in this sample have a mortgage, we can observe their use of mortgage forbearance to hone in on perhaps the largest and most important expense for many landlords: their mortgage payment.23
We start by examining income and balance trends for this sample of landlords. As shown in Figure 11, the measure that we think largely represents rental income dropped in April and May 2020 by about 10 percent and recovers after.24 This basic trend is similar to what we saw for the landlord busines owners sample in Figure 2 though rental income for these landlords may have recovered more than for the larger landlords in the landlord business owner sample.
Figure 11 also shows that total income (measured as total inflows except transfers), which includes rental revenues, also declined in the early months of the pandemic by about 5 percent. This implies that other income for these landlords—including any labor income—may not have declined as much as rental revenue did. Notably, rental property owners may have received government supports, such as stimulus payments or UI benefits, that offset rental income losses or boosted their income above pre-pandemic baselines. Finally, similar to most households (Greig, et al. 2021), balances for landlords rose25 in part driven by the pandemic government supports mentioned above.
Figure 11: The measure that likely represents rental income drops early on in the pandemic and recovers in the summer.
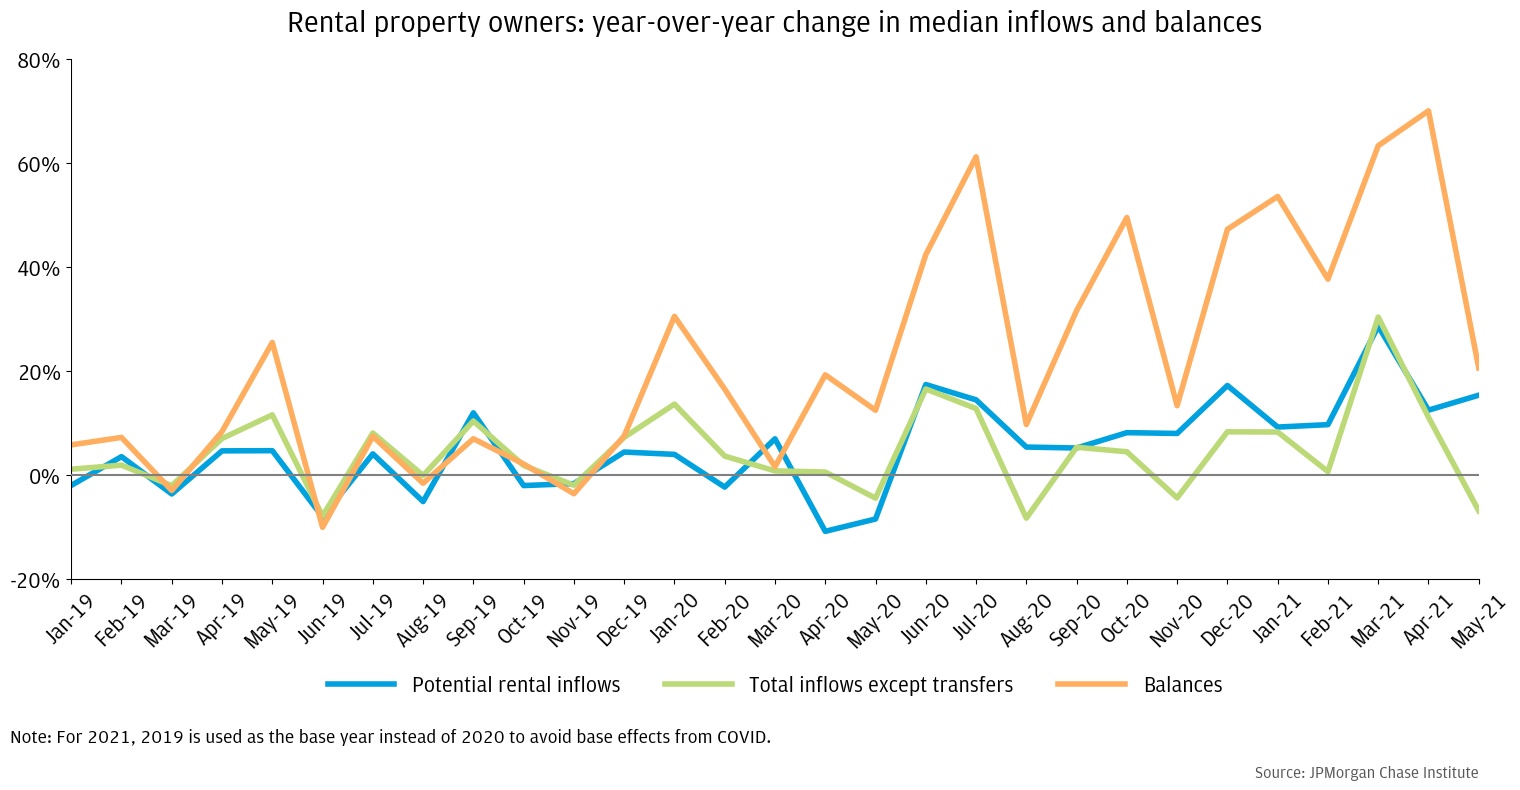
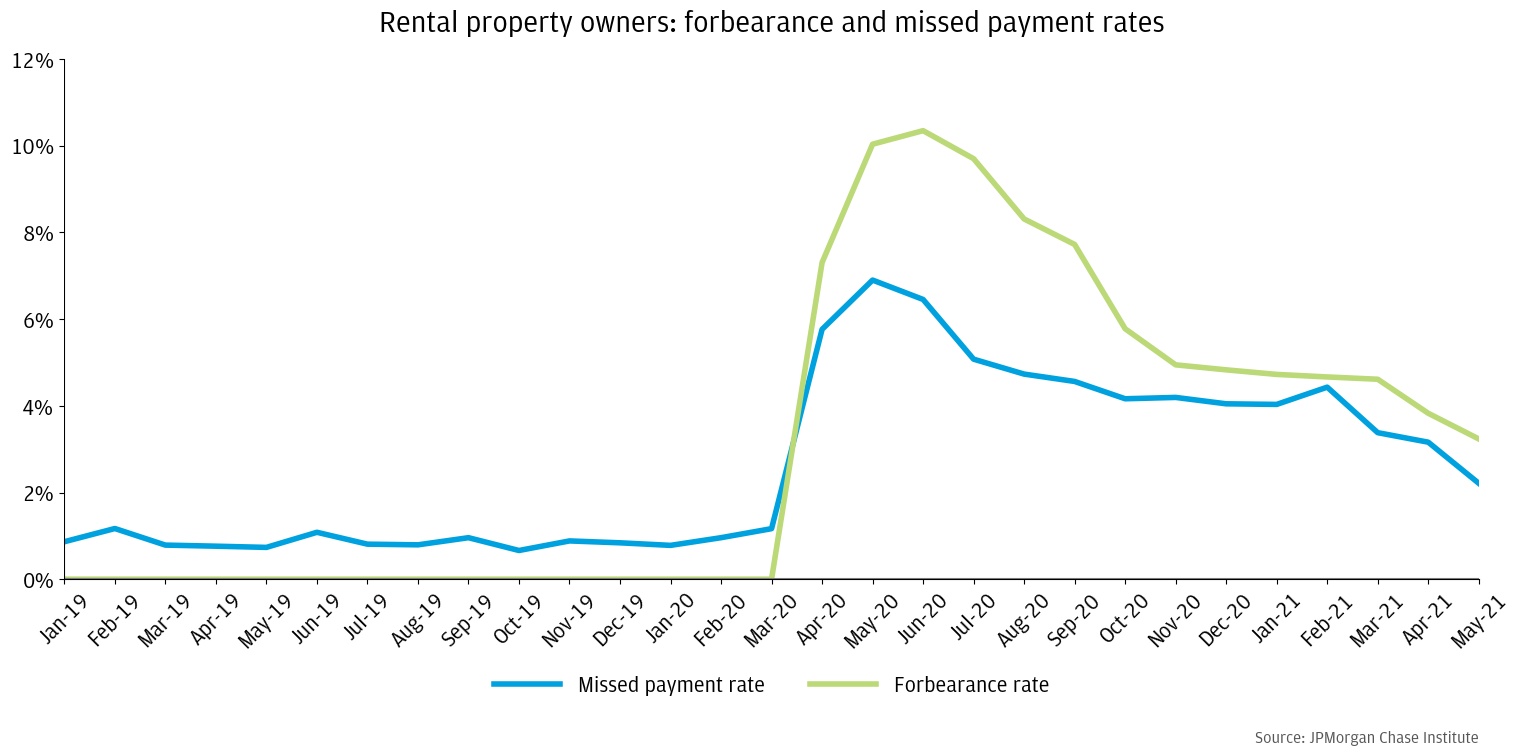
Figure 12 shows that concurrent with the drop in rental income, a significant fraction of landlords entered forbearance and missed mortgage payments. At the peak, 10.3 percent of landlords requested mortgage forbearance in June 2020 and 6.9 percent missed payments in May 2020. Both of these rates are substantially higher than where they were pre-pandemic. The forbearance rate drops steadily over time and reaches 3.2 percent by May 2021. Similarly, the missed payment rate declines steadily to 2.2 percent by May 2021. With such unusually high rates of missed payments, landlord participation in mortgage forbearance undoubtedly contributed to the drop in expenses and increase in balances we observed in Figure 2.
Notably, a substantial portion of landlords requested forbearance, but continued to make mortgage payments, perhaps as an insurance policy in case their tenants stopped paying rent. This is similar to the pattern we observed for the overall mortgage population (Farrell, et al. 2020).
Figure 12: 10.3 percent of landlords requested mortgage forbearance and 6.9 percent missed payments at the peak in June and May 2020, respectively.
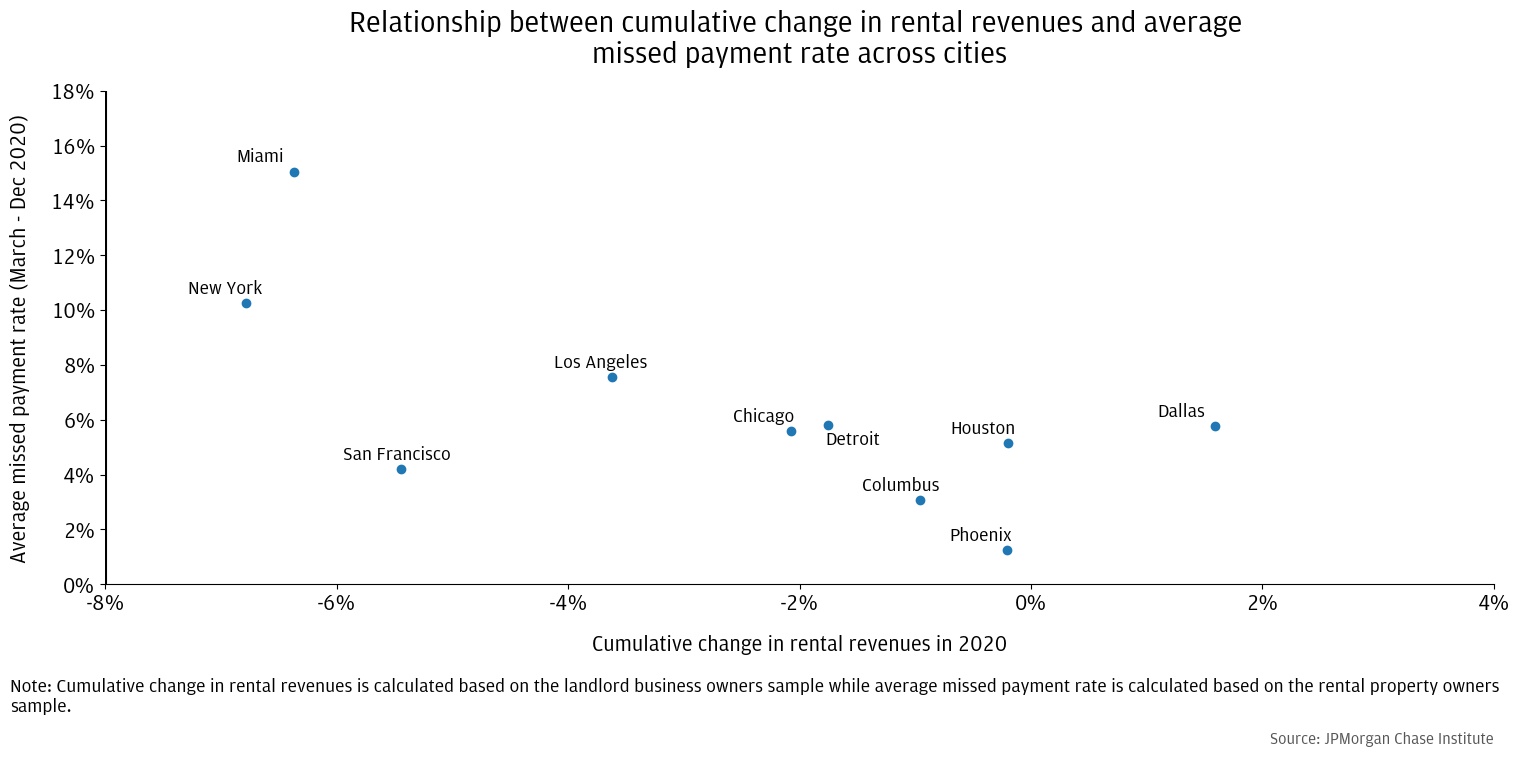
Similar to Figure 9, we ask whether there was geographic variation in the extent to which landlords missed mortgage payments (Figure 13) and whether the cities where landlords saw larger declines in rental revenues also had a greater share of landlords missing mortgage payments (Figure 14). The data show that indeed this is the case.
Rental property owners in New York and Miami were dramatically more likely to miss mortgage payments (Figure 13). At the peak in May of 2020, nearly one in four landlords in Miami and one in seven landlords in New York missed at least one mortgage payment on their rental property. As we documented in Finding 2 with the landlord business owner sample (Figure 7), New York and Miami are also the cities where landlords experienced the largest drop in rental income (Figure 14).
Figure 13: Rental property owners in New York and Miami were much more likely to miss mortgage payments
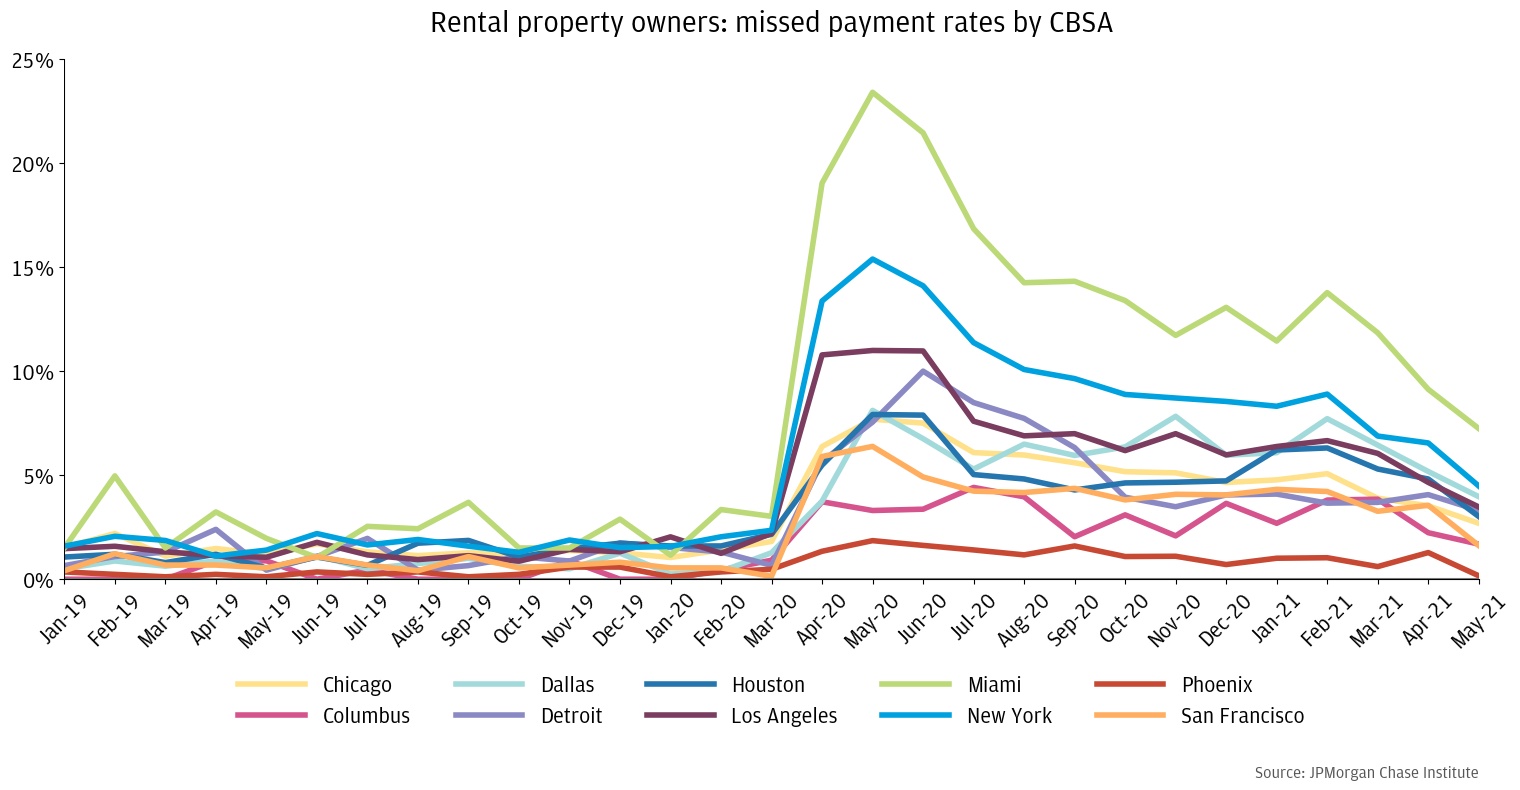
Figure 14: Cities with larger declines in rental revenues also had higher rates of missed mortgage payments.
If missing a mortgage payment is a sure sign of financial hardship for landlords, next we try to better understand the characteristics of landlords who missed mortgage payments. Table 3 shows income and balances pre-pandemic for landlords who did and did not miss mortgage payments. The landlords who missed mortgage payments were more financially vulnerable. They had slightly lower rental inflows based on the measure that we think approximates rental income. The typical potential rental inflow was $780 for landlords who missed mortgage payments compared to $1,269 for those who did not, potentially indicating that landlords who missed mortgage payments had smaller or lower priced properties. They also were slightly less likely to receive direct deposit labor income and when they did, it was lower. Their total income was similar to those who did not miss mortgage payments. Perhaps the largest difference between the two groups, however, is that those who missed mortgage payments had much lower household balances ($16,066) than those who did not ($24,035). This pattern whereby those missing payments had much less of a cash buffer to withstand income shocks is consistent with our prior research on mortgage default (Farrell, et al. 2019).
Finally, during the pandemic, the landlords that missed mortgage payments received more UI income on average, indicating that they were probably more likely to have lost their job. Therefore, it is not just a decline in rental income that could have led to missing mortgage payments, but rather, a decline in total income, which for many landlords includes labor income.
Table 3: Landlords that missed mortgage payments were more financially vulnerable, with slightly lower potential rental income, lower direct deposit labor income, and much lower balances.
Potential Rental Income in 2019 | All Rental Property Owners | Did not miss a mortgage payment |
|---|---|---|
| Median Number of Inflows per Month | 3 | 2 |
| Median Amount of Each Inflow | $780 | $1,269 |
| Median Total Potential Rental Income | $2,339 | $2,539 |
Other Income in 2019 | ||
| Percentage Receiving Direct Labor Income | 51% | 54% |
| Median Monthly Direct Deposit Labor Income* | $4,664 | $5,347 |
| Median Monthly Total Inflows except Transfers** | $7,904 | $8,033 |
Balance in 2019 | ||
| Median Household Balances | $16,066 | $24,035 |
Goverment Support in 2020 | ||
| Average Amount of UI Received per Month (Mar - Dec) | $369 | $187 |
*conditional on receipt of deposit labor income
**including rental income
We do not examine the difference in rental income trends for landlords who did and did not miss mortgage payments because, as discussed, the measure of rental income for this sample is inherently noisier. However, we do observe in Figure 15 that those landlords who missed mortgage payments also saw their balances increase more than those who did not. This pattern makes sense as missing mortgage payments would provide a boost to overall balances.
Figure 15: Landlords who missed mortgage payments saw their balances increase by more than those who did not.
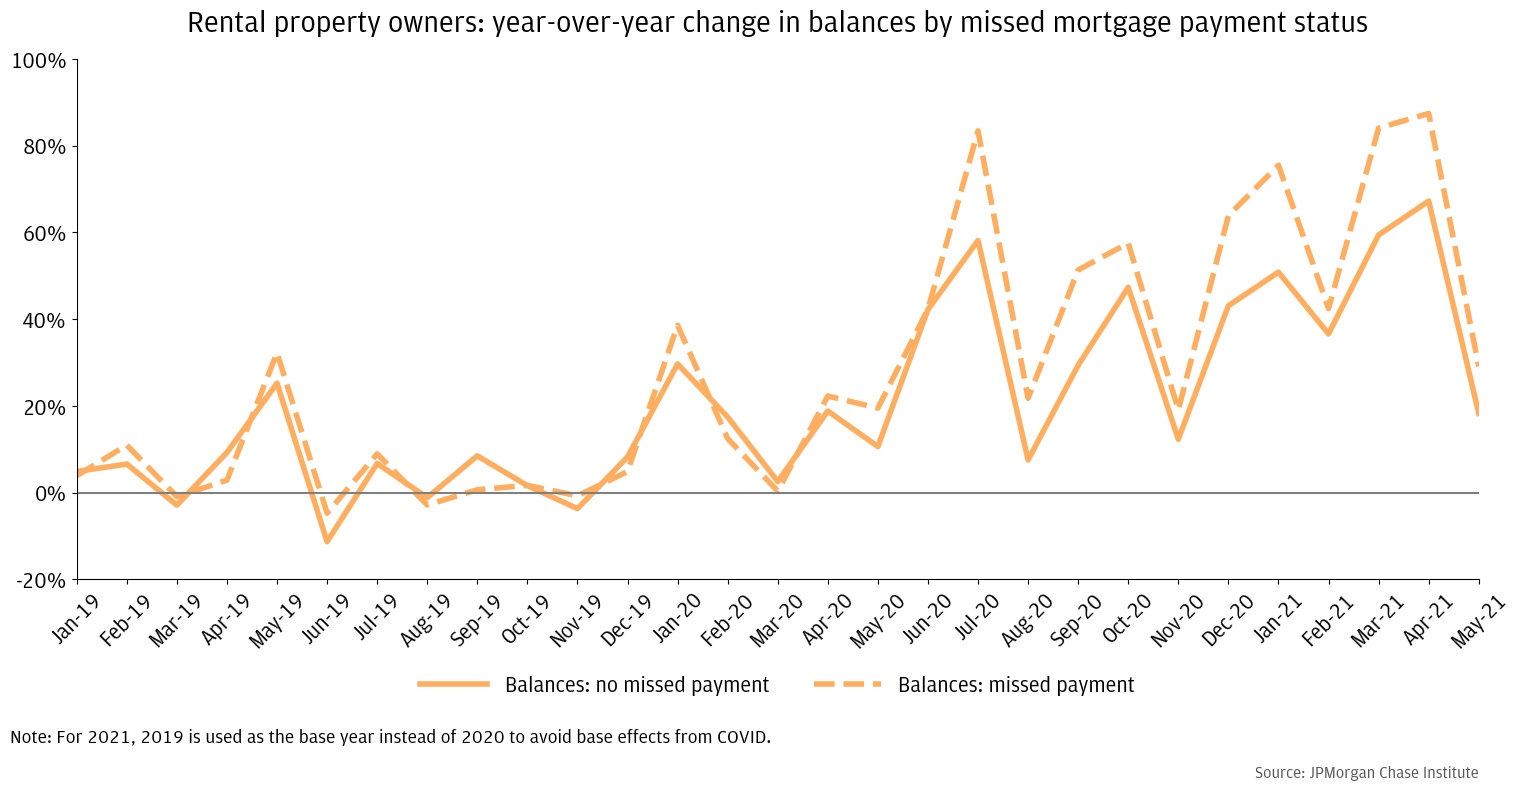
Notably, even rental property owners who did not miss a mortgage payment, experienced an increase in their household cash balance. Though we found that a significant share of landlords deferred mortgage payments, that by itself is unlikely to explain the full decline in expenses documented in Figure 2 that could be contributing to balance growth. As documented by other research (Decker 2021 and de la Campa 2021), landlords likely also reduced other expenses such as maintenance costs.26
Other government supports could also have contributed to the cash balances of landlords. Some of these supports, such as rental assistance, the Paycheck Protection Program, and EIDL, were targeted to small business owners or landlords specifically. We find that cumulatively, less than 1 percent of landlords received either PPP or EIDL in 2020, which is consistent with our sample largely skewing toward smaller landlords unlikely to have employees.27 Very little rental assistance through the Emergency Rental Assistance program had been disbursed by May 2021, the last month of data in our sample. Other government supports, such as stimulus checks and unemployment benefits, were more broadly available and may have led to higher balances even among landlords (Greig, et al. 2021).
Although rental income losses were widespread during the pandemic, they were not financially catastrophic for most landlords. Using transaction level data from small business deposit accounts, we found that for the median small landlord, rental income did decline, especially in the early months of the pandemic, but recovered quickly. The median landlord ended the year with a modest 3 percent shortfall in rent. Zooming out to the entire distribution, more landlords suffered substantial drops in revenues, but most of the volatility was normal year to year volatility. Our data show that landlords were able to cut their expenses by more than their rental revenues fell, which resulted in landlords’ cash balances growing during the pandemic. Based on data on a separate sample of landlords with a mortgage, taking advantage of available mortgage forbearance to miss payments was one of the ways some landlords cut back on their expenses. Landlords who missed mortgage payments were generally more financially vulnerable: they had slightly lower potential rental income, lower direct deposit labor income, and much lower balances.
A wide range of government supports during the pandemic likely prevented more catastrophic losses for landlords. During the COVID recession, the U.S. government provided an unprecedented amount of direct cash support to families. Programs such as expanded UI benefits and stimulus (EIP) checks likely allowed tenants to keep up with their rent payments to a greater degree than they would have been able to otherwise. Renters experienced greater job losses and labor income declines during the pandemic than mortgage holders during the pandemic, but these direct cash payments helped to fill much of that gap (Greig, et al. 2021). As many of these supports are pulled back, and household cash buffers wane, renters facing ongoing unemployment may have trouble meeting their obligations.
In addition to helping renters make their rent payments, landlords also benefited from the flexibility provided by mortgage forbearance and well as direct assistance from stimulus checks. This short-term relief likely helped landlords to provide relief to their tenants in turn. Survey evidence (de la Campa 2021) has shown that landlords offered rent reductions/forgiveness and flexible payment plans to their tenants to a much larger degree during the pandemic than before.
While landlords were able to pull back on expenses in the face of a decline in revenues, the resulting higher cash balances are not necessarily indicative of greater long run financial health. Some landlords may have accrued debt, while others could have deferred maintenance or other expenses. Our data show that one way some landlords cut back on expenses was to take advantage of mortgage forbearance programs created by the CARES Act. While these landlords were able to skip mortgage payments, the payments themselves are simply deferred, not forgiven. Another way landlords likely cut back on expenses is deferring maintenance. Indeed, Decker (2021)28 reports that “[o]wners who cut expenses mostly reported cutting maintenance costs” and survey evidence in de la Campa et al (2021)29 show that the share of landlords cutting back on maintenance increased from 5 percent in 2019 to 31 percent in 2020. However, deferring maintenance often simply means that landlords will need to make the same repairs later. In fact, delaying the repairs might result in higher costs if the repairs would have been preventative. Furthermore, cutting back on maintenance or home improvement costs also means that landlords might not be able to collect as much rent in the future on a property that is in poorer shape. Finally, de la Campa et al (2021) also find that 13 percent of landlords listed their property for sale in 2020 compared to 3 percent in 2019. Selling a source of income is another measure that would temporarily boost savings, but threatens future income potential.
The effects of the pandemic on landlords varied considerably across geographies, with landlords in New York and Miami hit especially hard, suggesting the need for different policy responses across state and localities. Landlords in New York, Miami, and San Francisco—especially in the core urban areas—experiencing the largest rental income declines. They were also among those cutting back the most on expenses. In contrast, landlords in Houston, Dallas, and Phoenix saw no change or increases in their rental revenue and cut back much less on expenses. Cities where rental income declined more were also the same cities where landlords were more likely to miss mortgage payments: more than one in seven landlords in New York and Miami fell behind on mortgage payments in 2020. With federal eviction and foreclosure moratoriums ending, and rent relief distributed through states, policy making decisions and execution shift to state and local leaders.
For the landlords who have experienced substantial shortfalls in rental income, accelerating the pace of rental relief will be critical for both making landlords whole and staving off eviction for their tenants. There remains a population of renters and landlords who are suffering from overdue rent and missing mortgage payments as a result, especially those who are more financially vulnerable.30 Between the Emergency Rental Assistance Program and the American Rescue Plan Act, $46.5 billion of rental assistance has been made available by the federal government for states and localities to distribute. As of the end of September, less than a quarter of the funds have been distributed.31 The distribution of these funds has been hampered by onerous paperwork requirements for both tenants and landlords to prove that tenants meet strict requirements to qualify for assistance, including matching information from the renter and the landlord. Among the many challenges, many of the most vulnerable tenants are not part of the formal rental market (e.g., subletting, renting illegal units, striking informal agreements, etc.) and are not able to provide the leases or other paperwork that is required of them to receive aid. Government officials have altered the rules of the program over time (e.g., allowing for self-attestation of need, providing advances while paperwork is processed, increasing flexibility for what the funds can be used for, etc.) to accelerate the process for getting assistance to needy families when it became clear that paperwork had become too much of a bottleneck. Such flexibility will be key to helping landlords as the pandemic drags on and keeping tenants in their homes as the expiration of various eviction moratoriums rapidly approaches. This need is especially acute for smaller landlords as they are more likely to supply affordable rental housing32 and rent shortfalls during the pandemic has caused more of them to sell their rental properties (de la Campa 2021). Helping these landlords helps to preserve our supply of affordable housing.
Direct cash assistance such as rental assistance (and other programs used during the pandemic such as expanded UI and EIP) has significant benefits relative to interventions such as eviction moratoriums. For example, direct assistance, when deployed quickly, allows renters to continue making rent payments thereby minimizing unintended consequences for landlords and the disruption to the economy. Eviction moratoriums, on the other hand, could create incentives to stop making rent payments even when the renter is able to pay.
Renters have borne the brunt of the pandemic. While government support has gone a long way toward helping tenants directly and providing landlords with some flexibility, the difficult job of distributing rental assistance will be the key next step to a full recovery for both landlords and tenants as eviction moratoriums around the country expire.
Both the National Multifamily Housing Council (NMHC) and the Census Pulse Survey provide rent payment data. However, the NMHC only covers larger landlords. The Census Pulse Survey provides data on a nationally representative sample of renters but does not have pre-pandemic data
2018 Rental Housing Finance Survey (HUD).
The number of inflows we believe to be rent payments, the median size of each inflow (about $1200), and the cadence of the payments (roughly monthly) all increase our confidence that we are capturing true rent payments.
We repeatedly sampled accounts and manually checked inflows to determine if we were successfully removing non-rent inflows and keeping inflows that were likely to be rent payments.
Revenue is all inflows into deposit accounts except transfers and financing (including special financing such as PPP). Expenses is all outflows out of deposit accounts except transfers and financing. Balances are the average monthly balance in the deposit account.
Balances here refers to the average balance over the month.
Alternative measures of rent, such as the Zillow Observed Rent Index, tend to show more volatility than the Bureau of Labor Statistics’ Rent of Primary Residence, which is used in its computation of the Consumer Price Index (CPI). This is because the BLS only surveys landlords every six months and includes all units whereas these alternative measures generally only include units that turn over (not continuing leases or lease renewals which would include rent controlled units), are less comprehensive, and biased toward higher value and more urban units. However, the alternative measures are more timely and are more representative of how prices are changing (prices people are facing when they look for an apartment) whereas the BLS measure is a better measure of current outlays.
The NMHC suggests very small drop in rent payments received, however this data covers large landlords, and hence likely has little overlap with our data.
The Avail data show that around 86 to 87 percent of rent payments were made to mom-and-pop landlords during the pandemic, but the very limited pre-pandemic data from January and February 2020 show very similar results. Therefore, these data would suggest that mom-and-pop landlords saw very little—if any—drop in rental revenues during the pandemic, at least when compared to the first two months of 2020. However, given Avail is an online rent payment platform, the landlords (and tenants) in their sample may not be representative of all smaller landlords and their tenants, especially the ones still paying via cash or check.
The Census Pulse Survey suggests that a fairly constant 15 to 20 percent of renters throughout the pandemic have been behind on rent payments. There are, however, no pre-pandemic data points making it difficult to interpret. It is also not clear based on the way the question is asked whether it is capturing who people are getting more behind each month or if it is those who have missed a payment at some point. Lastly, the Census Pulse data could be capturing people who pay later in the month; this would be more consistent with NMHC, which suggests over 20 percent of renters have not paid by the 6th of the month.
Decker (2021) shows more than half of landlords collected a similar amount of rent or more rent in 2020 than in 2019. About a quarter experienced a decline of 1 to 25 percent in rental revenues. About 13 percent saw their rental revenue decline by more than 25 percent. Our categories are not exactly aligned with this analysis, but we see much more volatile revenue.
De la Campa (2021) finds that the share of landlords who collected 90 percent or more of their charged yearly rent fell 30 percent from 2019 to 2020 (89 to 62 percent). They also find that for a set of landlords, the pandemic has severely limited the amount they collect in rent: 9 percent of landlords received less than half of their yearly rent in 2020. Our measures are difficult to compare to this directly since we don’t measure against rent owed, but this likely suggests a greater drop in rental revenue than our data. Their results may differ from ours partially because they survey landlords in 10 specific cities[1] that do not overlap much with our footprint.
Arizona and Texas had lower state level unemployed rates than New York and California throughout the pandemic despite having similar unemployment rates prior to the pandemic. However, Florida also had lower unemployment rates than New York and California and, after the summer of 2020, had lower unemployment rates than Texas and Arizona as well.
Furthermore, even though an influx of out of state residents to southern Florida during the pandemic may have caused rents to soar (Figure 5), our sample may be capturing landlords who are renting to lower income residents and not the more recent higher income residents.
The core city was defined as the five boroughs (Manhattan, Brooklyn, Queens, Staten Island, and the Bronx) for New York City, the city of San Francisco for San Francisco, and the city of Miami for Miami. The surrounding areas were defined as all zip codes not in the core city.
Unfortunately, we cannot directly categorize expenditures in our data with the level of detail required to draw conclusions on some of the other expenses landlords might have cut or deferred—e.g., maintenance costs, taxes, or other specific categories.
We do not examine expenses for this sample because these are personal deposit accounts used for variety of purposes and expenses include spending that is unrelated to managing the rental property.
The volatility observed in balances is due to our measure of end of month balances being affected by five Friday vs. four Friday (three vs. two pay checks for those paid biweekly) months in each year relative to the base year. In figure 2, we had used average balances over the month for the landlord business owners sample.
Some of the reduction in costs in maintenance costs may not have been completely voluntary on the part of landlords. During the pandemic, it was more difficult to get work done on rental properties both because of public health concerns and also because of the lack of supply of contractors and building materials.
Landlords could not use PPP to cover lost rental income, only to cover expenses related to employees: https://helloskip.com/blog/how-landlords-can-pay-their-mortgage-and-expenses-during-the-public-health-crisis/.
As of the end of August, Goldman Sachs estimates that “2.5-3.5 million households are behind on rent, with $12-17bn owed to landlords.” (Goldman Sachs Economics Research, August 29, 2021, “Evictions and the Economy as the Moratoriums End”)
De la Campa, Elijah, Vincent J. Reina, and Christopher Herbert. 2021. “How Are Landlords Faring During the COVID-19 Pandemic?” Joint Center for Housing Studies, Harvard University.
Decker, Nathaniel. 2021. “The Uneven Impact of the Pandemic on the Tenants and Owners of Small Rental Properties.” Terner Center for Housing Innovation, UC Berkeley.
Farrell, Diana, Chris Wheat, and Chi Mac. 2020. “Small Business Financial Outcomes during the Onset of COVID-19.” JPMorgan Chase Institute.
Farrell, Diana, Fiona Greig, and Chen Zhao. 2020. "Did Mortgage Forbearance Reach the Right Homeowners? Income and Liquid Assets Trends for Homeowners during the COVID-19 Pandemic." JPMorgan Chase Institute.
Farrell, Diana, Kanav Bhagat, and Chen Zhao. 2019. “Trading Equity for Liquidity: Bank Data on the Relationship Between Liquidity and Mortgage Default.” JPMorgan Chase Institute.
Goldman Sachs Economics Research, August 29, 2021, “Evictions and the Economy as the Moratoriums End”
Greig, Fiona, Chen Zhao, and Alexandra Lefevre. 2021. "Renters vs. Homeowners Income and Liquid Asset Trends during COVID-19." JPMorgan Chase Institute.
Greig, Fiona, Erica Deadman, and Tanya Sonthalia. 2021. “Household Finances Pulse: Cash Balances during COVID-19.” JPMorgan Chase Institute.
We thank our research team, specifically Malu Menon, for her hard work and contribution to this research. Additionally, we thank Sarah Kuehl, Anna Garnitz, Sruthi Rao, Emily Rapp, and Stephen Harrington for their support. We are indebted to our internal partners and colleagues, who support delivery of our agenda in a myriad of ways, and acknowledge their contributions to each and all releases.
We are also grateful for the invaluable constructive feedback we received from external experts and partners, including Noel Poyo, Erika Poethig, Ernie Tedeschi, Damon Jones, Katherine Reynolds, Ingrid Gould Ellen, Katherine O’Regan, Elijah de la Campa, and Nathaniel Decker. We are deeply grateful for their generosity of time, insight, and support.
We would like to acknowledge Jamie Dimon, CEO of JPMorgan Chase & Co., for his vision and leadership in establishing the Institute and enabling the ongoing research agenda. We remain deeply grateful to Peter Scher, Vice Chairman, Demetrios Marantis, Head of Corporate Responsibility, Heather Higginbottom, Head of Research & Policy, and others across the firm for the resources and support to pioneer a new approach to contribute to global economic analysis and insight.
This material is a product of JPMorgan Chase Institute and is provided to you solely for general information purposes. Unless otherwise specifically stated, any views or opinions expressed herein are solely those of the authors listed and may differ from the views and opinions expressed by J.P. Morgan Securities LLC (JPMS) Research Department or other departments or divisions of JPMorgan Chase & Co. or its affiliates. This material is not a product of the Research Department of JPMS. Information has been obtained from sources believed to be reliable, but JPMorgan Chase & Co. or its affiliates and/or subsidiaries (collectively J.P. Morgan) do not warrant its completeness or accuracy. Opinions and estimates constitute our judgment as of the date of this material and are subject to change without notice. The data relied on for this report are based on past transactions and may not be indicative of future results. The opinion herein should not be construed as an individual recommendation for any particular client and is not intended as recommendations of particular securities, financial instruments, or strategies for a particular client. This material does not constitute a solicitation or offer in any jurisdiction where such a solicitation is unlawful.
Greig, Fiona, Chen Zhao, and Alexandra Lefevre, 2021. “How did landlords fare during COVID?” JPMorgan Chase Institute. https://www.jpmorganchase.com/insights/community-development/how-did-landlords-fare-during-covid

Fiona Greig
Former Co-President

Chen Zhao
Housing Finance Research Lead

Alexandra Lefevre
Consumer Research Vice President, JPMorganChase Institute