
Figure 1: The majority of midsize firms transact internationally, and many transact with several countries.

Creating thriving communities together
See how our clients and partners—from small business owners to workforce training leaders—work with JPMorganChase to drive meaningful impact and economic growth where they live and work.
Learn moreLatest news

Veteran’s Unconventional Path to Landing her Dream Job in Tech
U.S. Army Veteran Ashley Wigfall transitioned to a civilian role and charted her path to technologist through mentorship and skills training at the JPMorgan Chase tech hub in Plano, Texas.
Learn more
Research
Tracking international payments:
How are midsize firms reacting to tariffs?
February 19, 2026
Tariff increases in 2025 and ongoing uncertainty around U.S. trade policy have renewed questions about how firms are adapting to a more restrictive global trade environment. Using de-identified JPMorganChase payments data, this report examines international transactions by midsize U.S. firms—a segment that represents a significant portion of the private sector and is highly involved in trade, yet is often underrepresented in policy discussions and aggregate statistics.
By focusing on midsize firms, which are likely to be especially impacted by shifts in trade policy, our proprietary international payments data offers unique insight into how these firms adapt to a changing policy landscape—a view unavailable from aggregate trade statistics that may be dominated by larger firms. Specifically, we establish a set of findings based on data from the last few years:
Key findings
Our findings suggest that the relative stability in aggregate international payments in 2025 has obscured the overall impact on midsize businesses. Beneath this stability, midsize firms experienced a sharp increase in tariff-related costs and a meaningful reorientation of international payments away from China, indicating that adjustment may take the form of a gradual reallocation rather than an immediate pullback from global activity.
For policymakers, these findings indicate that trade volumes alone may understate the near-term impact of tariffs on firms that lack the scale to absorb sustained cost increases. For now, the effects of tariffs may be materializing through reallocation rather than a broad retreat from international markets. Our findings also suggest that the longer-run effects of tariffs may depend on whether higher costs and policy uncertainty induce more permanent changes in firm decisions, and that the broader effects of trade policy changes may only become apparent with a significant lag. To this end, we intend to continue monitoring these data over the next year to see if these trends continue or change as firms adapt.
U.S. trade policy was historically volatile in 2025, and significant uncertainty about the longer-term policy landscape remains in 2026.1 The trade environment may continue to evolve due to policy choices about countries and/or products to target,2 outcomes of ongoing legal decisions,3 and ongoing negotiations with trading partners.4
On one hand, the magnitude of past and future policy changes might prompt businesses to react sharply. On the other hand, given the uncertainties, businesses may delay making strategic changes to their operations which could be time-consuming to implement. In prior research (Wheat et al. 2025a, 2025b) we estimated the costs of announced tariffs to midsize firms if they continued to import at unchanged levels. However, we would expect firms to reoptimize as their business conditions changed.
Midsize firms, also known as the middle market, may be among those most affected by these changes in trade policy. Often described as having revenues between $10 million and $1 billion or employing 50-499 workers, midsize firms occupy a unique role in the economy. They may be large enough to be local or regional anchors but not so large that they can easily offset losses in one area with the gains of another. When responding to changes in trade policy, they may be more agile than larger firms but lack the negotiating leverage of their larger counterparts. In this way, they may be more representative of the typical U.S. firm.
To analyze the payments of these firms, we used a dataset of domestic and international transactions by midsize JPMorganChase clients. We excluded several industries from our sample which are not pertinent to this line of research. To reduce volatility of our time series, we dropped a very small number of large outlier transactions, representing 0.4 percent of the total outflow amount and less than 0.0001 percent of the total transaction count from the sample.
To ensure that we included only active firms in our sample, we required firms to have minimum activity of at least 10 outflows per month totaling at least $5,000. For figures that show trends over time, we only used data from firms that satisfy this activity requirement in every month of the sample period. This maintains a constant sample across the entire time period, so that any trends we find are not due to firms entering or leaving the sample.
For more information on how we constructed our sample, see the data appendix.
Midsize firms, also known as middle market firms, play an important role for the U.S. economy. Not only do they matter domestically, employing 48 million workers and generating one-third of private sector GDP,5 but they also transact with other countries. In a 2016 survey, 54 percent of executives of midsize companies reported that they were exporters, and 48 percent responded that they imported.6 Midsize companies often form important links within cross-border value chains, requiring international trade in goods and services. Even midsize companies that exclusively serve the U.S. market may have complex operations and rely on foreign production inputs or financing. All of these operations require international transactions, which are the focus of this report.
To provide context for our main findings below, this section presents foundational facts about the international activity of midsize firms: The majority of midsize firms transact internationally. Larger firms transact with more countries, and payment volumes are concentrated in a relatively small share of firms.
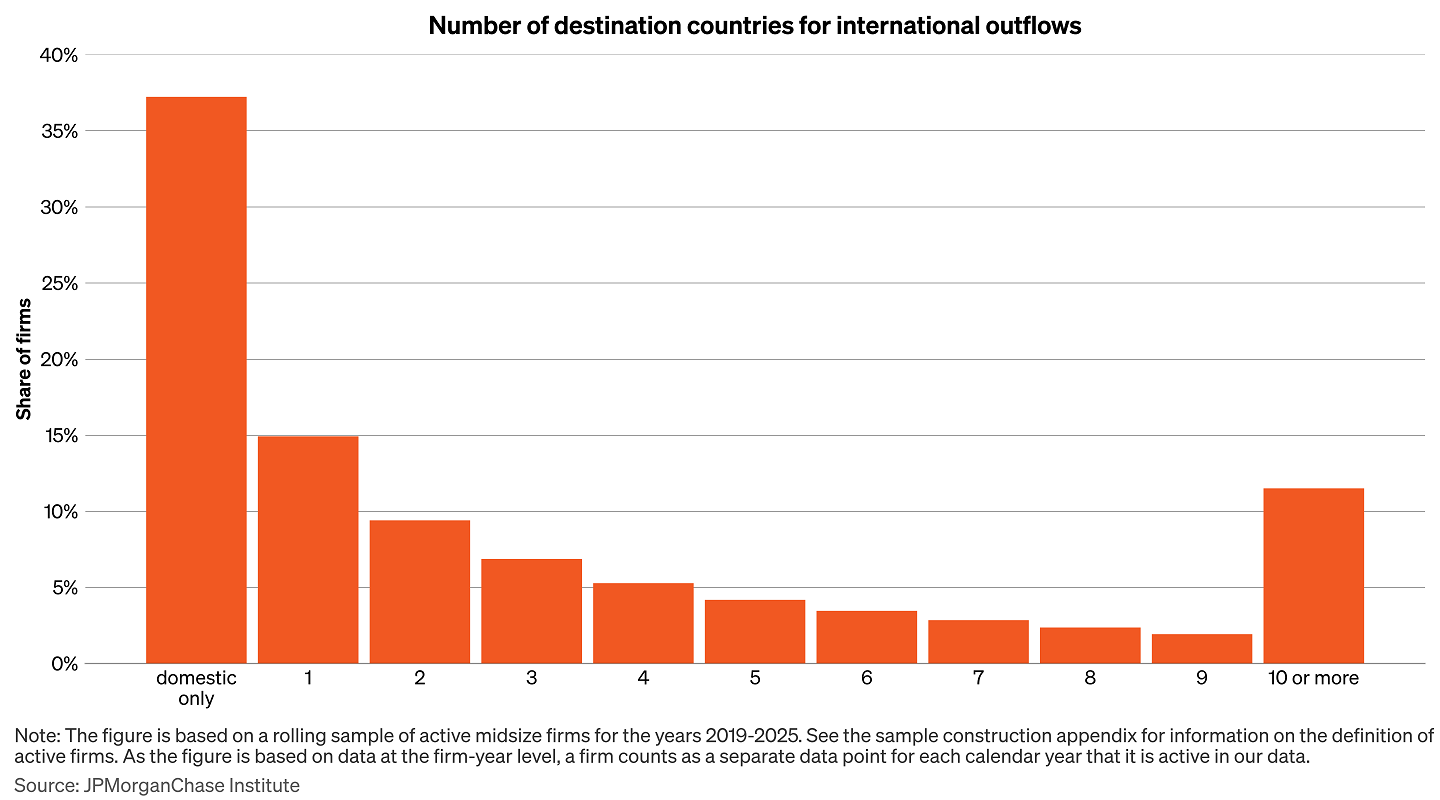
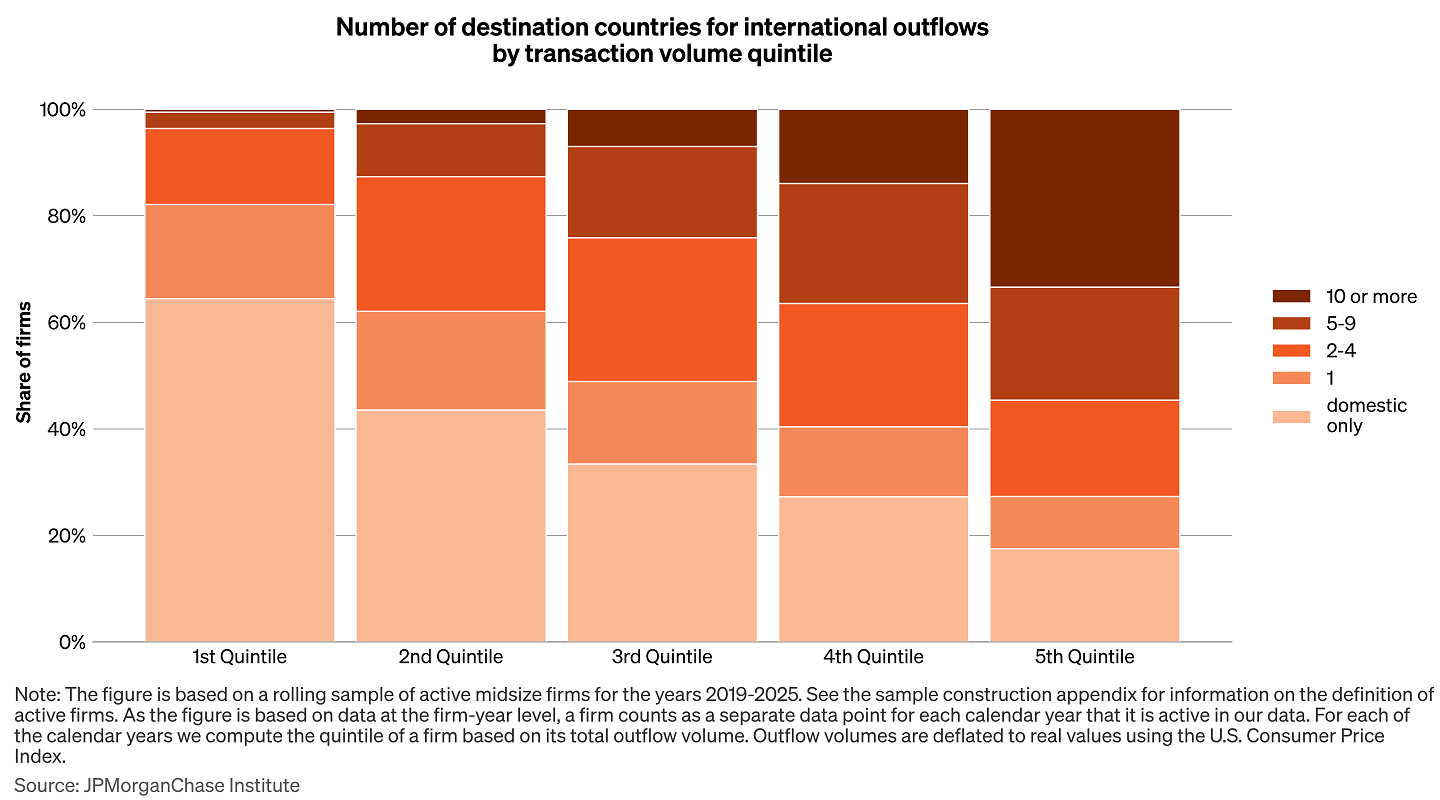
Figure 1: The majority of midsize firms transact internationally, and many transact with several countries.
Figure 1 shows our sample of midsize companies by the number of foreign countries that they send transactions to in a given year. A majority of midsize companies transact internationally: About 37 percent of midsize companies only have domestic transactions, and the remainder of the sample is fairly dispersed, with over 10 percent of midsize companies transacting with a double-digit number of countries each year.
Larger firms tend to transact with more countries, with more than one-third of the firms in the largest quintile transacting with 10 or more countries. See Appendix Figure A1 for further details.
Although most midsize firms do have international outflows, these outflows tend to be concentrated among a relatively small number of firms. The top 20 percent of firms by volume account for 91 percent of international outflows, and the top 5 percent account for 64 percent. See Appendix Figure A2 for details. The particularly high concentration of international outflows aligns with previous research that has demonstrated high firm-level concentration of imports (Bernard, et al. 2007). While our data cover financial flows and other types of transactions in addition to payments for imports, this fact may explain at least part of the concentration we observe.
According to Census data,7 the largest trading partner for midsize firms is China at 21 percent of imports, followed by the European Union (EU) at 16 percent. Our data on international payments, which represent not only payments for goods and services but also financing flows, show a similar distribution across countries and regions. However, transactions in our data are less concentrated in Asia, particularly in China and Southeast Asia, with more weight on Europe, especially the United Kingdom. These differences could be due to the types of flows captured in our data as well as the composition of midsize firms in our sample. Appendix Figure A3 provides a comparison of the country distribution in our payments data and Census goods imports data.
Having established these core facts about international transactions by midsize firms, we now turn our attention to developments in the trend of these transactions over recent years.
International payments by midsize firms have moderately lagged domestic payments since early 2025.
Many changes to international trade policy occurred during 2025, with some of the stated goals being to reduce the U.S. trade deficit and increase investment in domestic manufacturing capacity. Given this, we might expect to see shifts in international transaction behavior by midsize firms.
Figure 2: International payments remained stable in 2025 as domestic outflows grew.
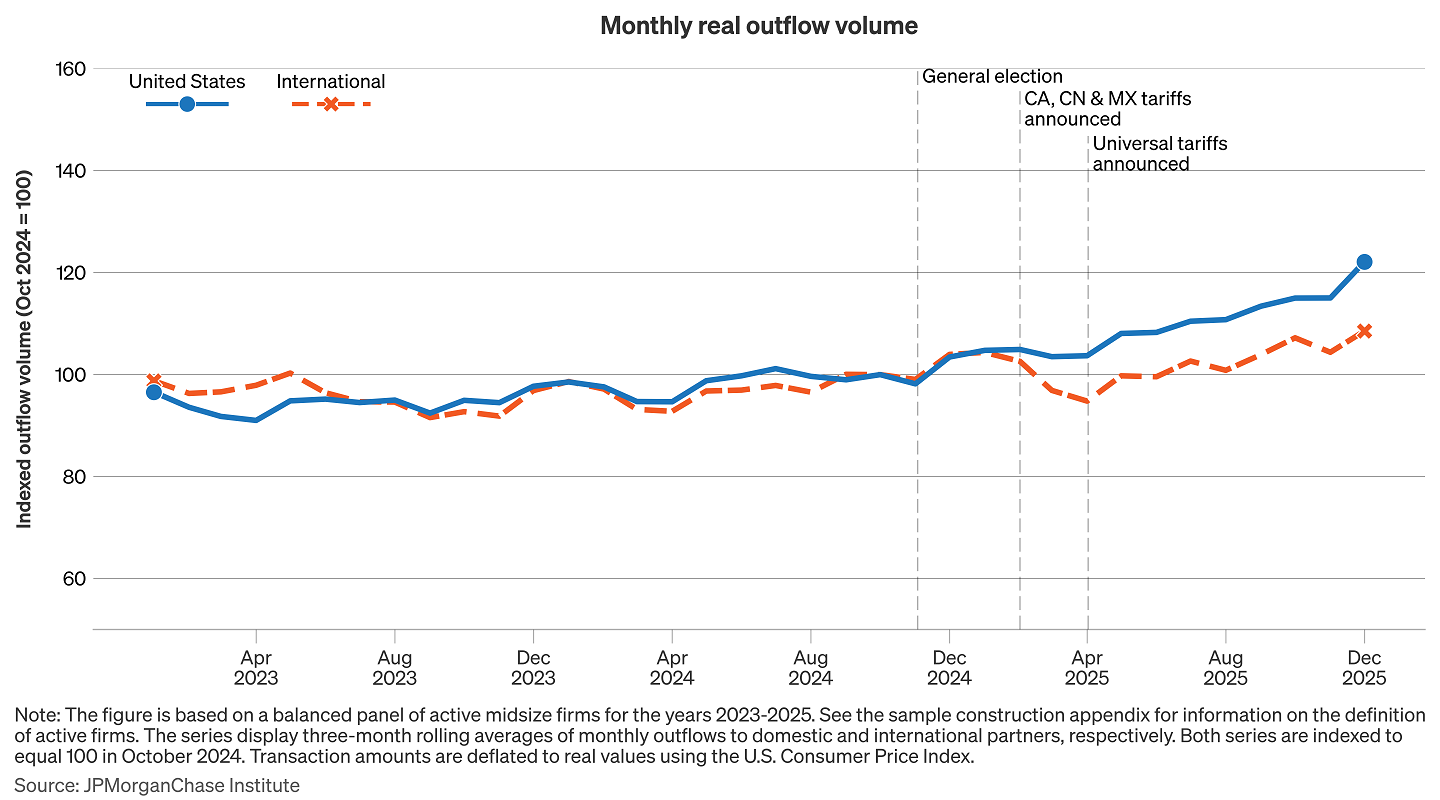
Figure 2 shows real monthly international outflows by a panel of midsize firms along with their outflows within the U.S. for comparison. Both series are indexed to 100 in October 2024, which was the last full month before the U.S. presidential election.8 Note that in absolute terms, domestic payments are much higher than international.9
Both international and domestic outflows were fairly stable throughout most of 2023 and 2024. In 2025, international outflows continued along a mostly flat trend, with a slight increase in the later months of the year. Although they were outpaced by the growth in domestic outflows in 2025, the apparent resilience of international outflows may still seem somewhat surprising given the major tariff rate increases that were implemented over the year.
The timing of international payments may vary substantially in relation to the import of goods. Payment timings can range from being made at the point in time when goods are ordered (cash-in-advance), to being carried out up to several months after goods are delivered to the importer (open account), and may in some cases even be delayed until the goods are sold to the end customer (consignment).10 Therefore, international transactions made after the imposition of tariffs could in some cases be payments for goods ordered or imported before the tariffs took effect. This is particularly pertinent given that other researchers found significant front-loading of imports during late 2024 and early 2025 in anticipation of increased tariffs.11 An initial surge in imports and related payments made in arrears might have offset a subsequent decline and could be consistent with a relatively flat trend overall.
Additionally, past research (Monarch and Schmidt-Eisenlohr 2016, 2023) has found that long-term supplier relationships are valuable to firms, and that many of them go back several years. Given the uncertainty around future tariff policy as well as legal challenges to tariffs announced under the International Emergency Economic Powers Act (IEEPA), many firms may have been hesitant to switch to a supplier from a different country. Even in cases where firms have made that decision, the process of finding the right alternative supplier could take a long time.
Finally, tariff policy impacts may also appear somewhat muted due to our international transactions data encompassing not only payments for imports of goods, which are often subject to tariffs, but also payments for service imports as well as financial flows, which are generally not tariffed. Financial flows such as foreign direct investment could be affected by tariffs indirectly, but the overall effect of this is ambiguous: Firms may be less willing to invest in manufacturing capacity abroad if they plan to import the produced goods into the U.S., but tariffs on raw materials used as production inputs can also serve as a disincentive for reshoring of manufacturing capacity (Kouvelis, Tan and Tang 2023).
Monthly tariff payments by midsize firms have tripled since early 2025.
International payments remained stable in 2025, which is consistent with firms continuing to import despite higher tariff rates. However, midsize firms were not unaffected by tariffs. We find that many new midsize firms have started paying tariffs in 2025, but a sharp rise in tariff payments was driven primarily by midsize firms that had already been paying them before October 2024. This indicates that higher tariff rates mainly increased the cost burden on existing importers rather than dispersing it across a larger pool of tariff-paying firms.
Figure 3: Tariff outflows by midsize firms increased sharply in 2025.
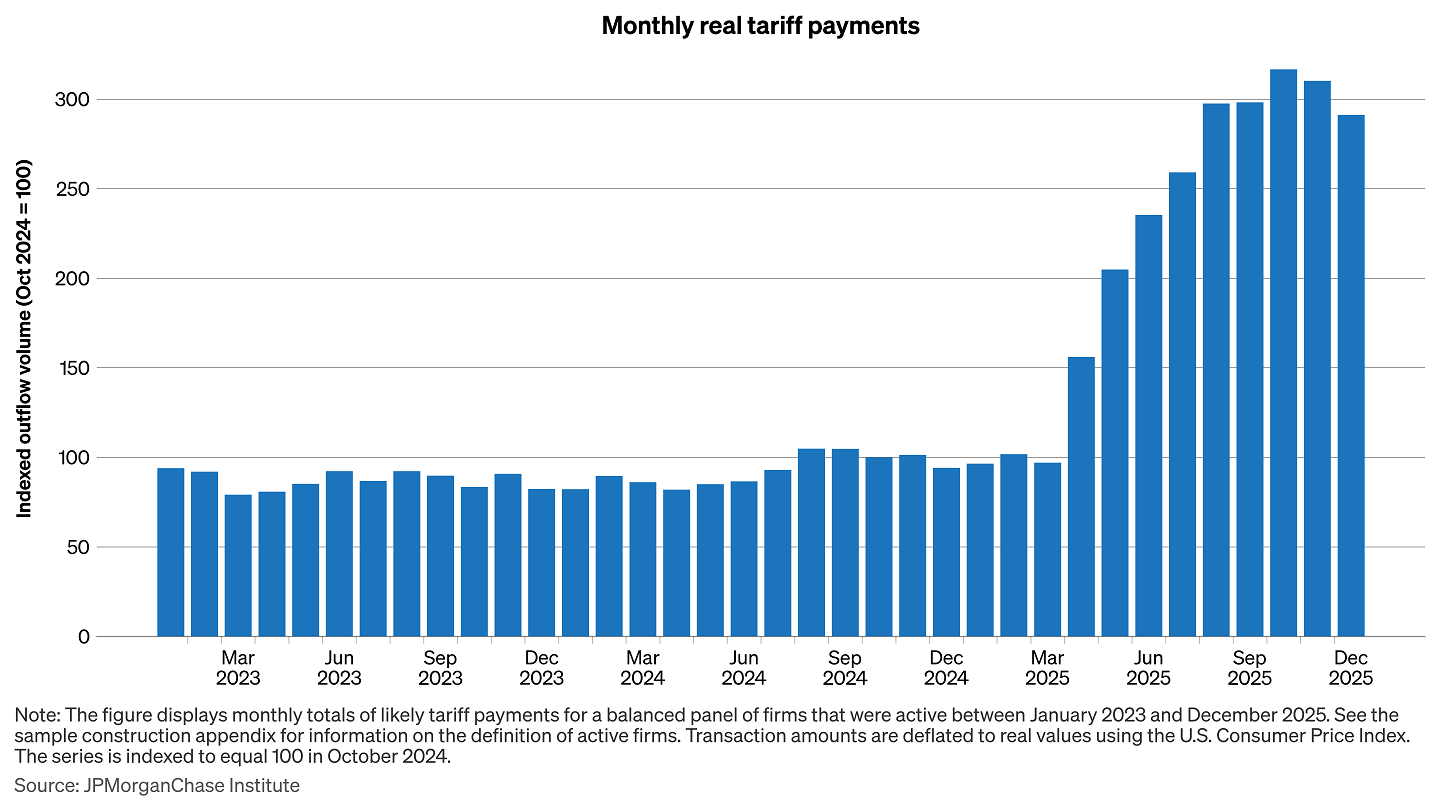
We identified likely tariff payments made by midsize firms, and Figure 3 displays how these payments have evolved over time. A stable trend was interrupted by a sharp increase starting in April 2025, coinciding with the implementation of the first tariff rate increases during that year.12 Total payments continued rising throughout 2025 and eventually reached a level of roughly three times what it had been until early 2025.
These likely tariff payments potentially encompass certain other trade-related fees in addition to tariffs. However, we see the timing and magnitude of the increase in these payments as a strong indication that we do indeed mostly capture tariff payments. We therefore refer to these transactions simply as tariff payments in the following.
Figure 4: The total volume of tariff payments now equals around 10 percent international outflows from all midsize firms, and around 15 percent of international outflows from only midsize firms that pay tariffs.
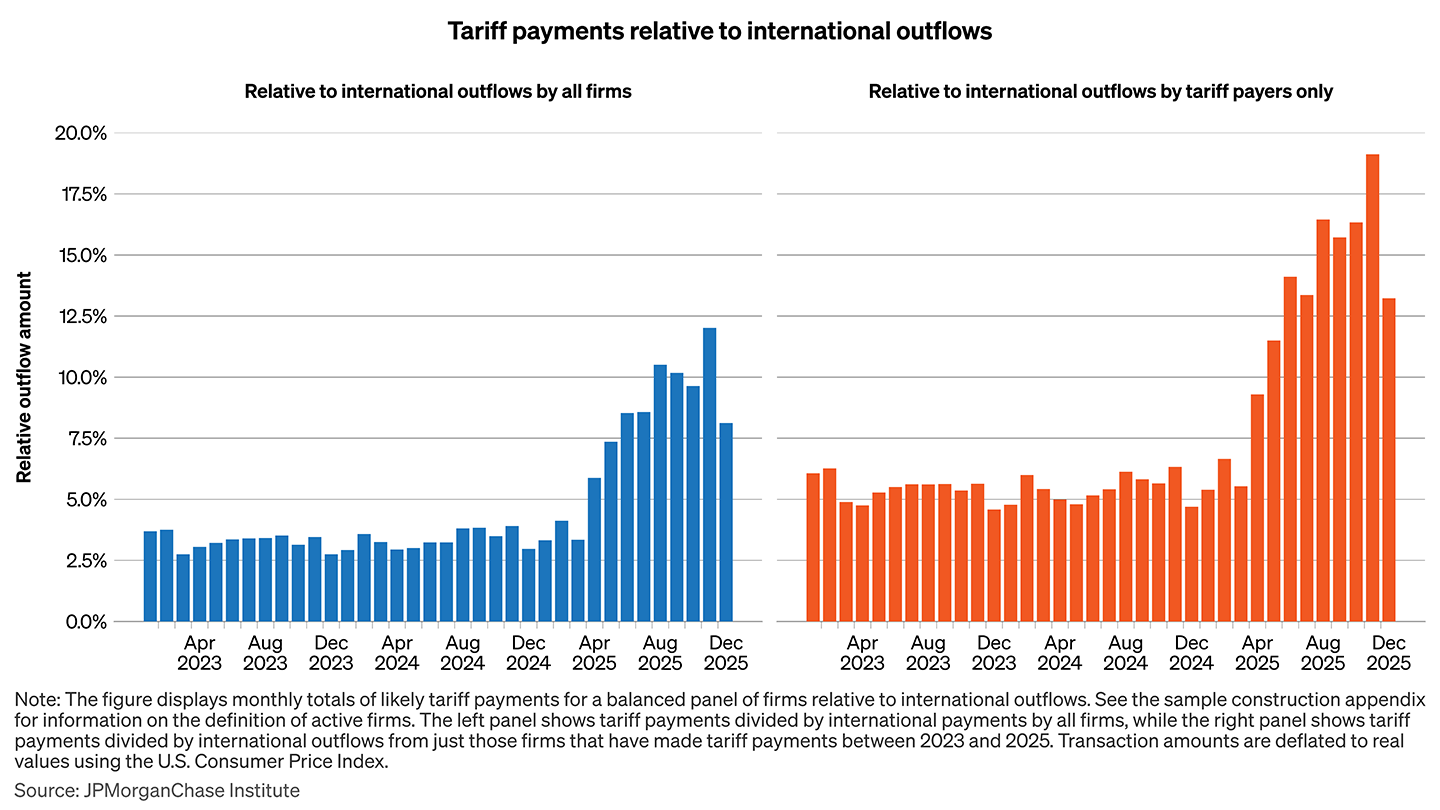
Figure 4 displays monthly tariff outflows by midsize firms relative to their international outflows. In the left panel, the bars indicate tariffs expressed as a percentage of international outflows from all midsize firms. The right panel shows the same tariffs payments expressed as a percentage of international outflows for only those midsize firms that make tariff payments. Because the right panel includes a smaller set of firms, tariff payments are larger relative to total international outflows in that case. In both cases, though, we see a very pronounced increase, just as we did in Figure 3.
While the payment shares shown in Figure 4 are reminiscent of effective tariff rates, they differ along a number of dimensions: As previously noted, the international outflows we observe represent not just payment for imported goods, but also payment for services imports or various types of financial flows. It is also possible that some firms may pay tariffs through payment methods we are unable to observe in our data. These differences may be less pronounced in the right panel, which limits the sample to firms having tariff outflows, but this sample restriction could also skew the results by excluding firms that import tariff-free goods, for instance. Despite these caveats, these figures are consistent with estimates of how effective tariff rates have evolved in 2025. For example, Gopinath and Neiman (2025) estimate that the effective tariff rate increased from around 5 percent in January 2025 to 14.1 percent in September, while estimates from the Penn Wharton Budget Model indicate an increase from 2.2 percent in January to 10.9 percent in October.13
Figure 5: Many new firms are paying tariffs after rate hikes, but most of the revenue increase comes from previous payers.
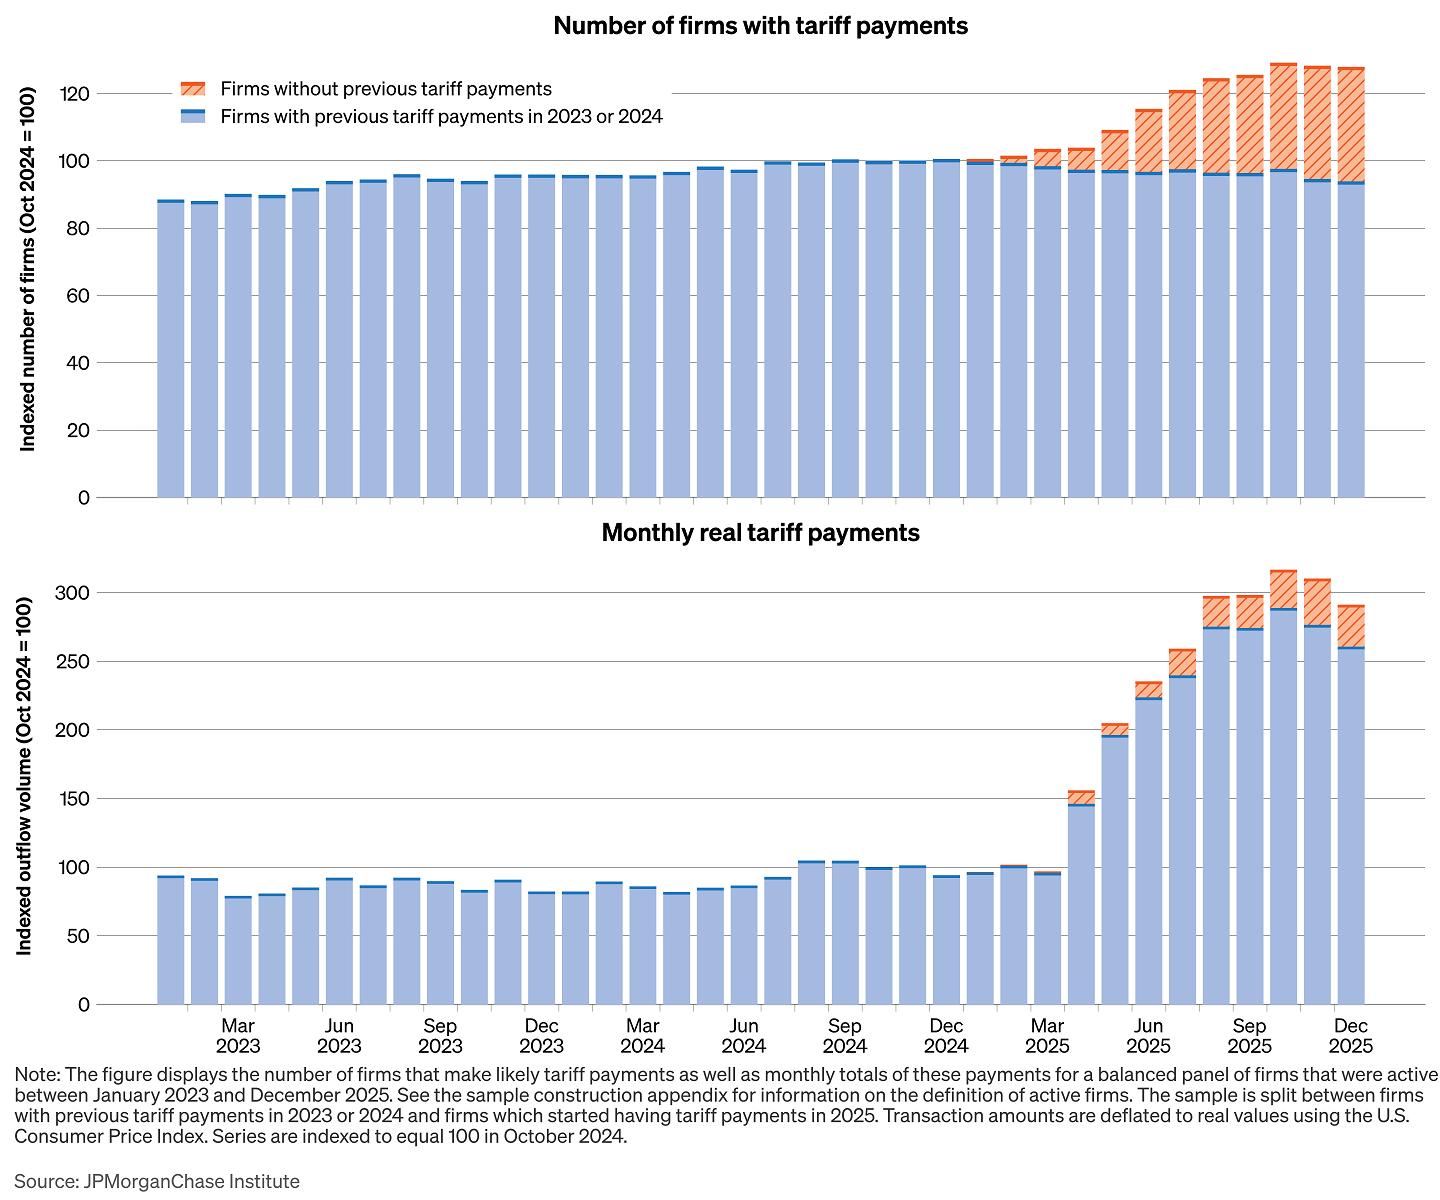
Tariff policy changes during 2025 not only substantially increased rates on some countries that were already subject to them, such as China, but also introduced new universal tariffs on a wide range of countries that had been exempt in many product categories. Consequently, we might expect that some importers that had previously not been subject to tariffs would now be required to pay them.
In Figure 5, we decompose the set of firms that have tariff payments into two groups: those that had tariff payments at any point during 2023 or 2024, and those for whom we observe a tariff payment for the first time during 2025. The first panel of Figure 5 shows the number of firms in each of these two groups, indexed to 100 in October 2024. We see a clear increase in new payers in 2025—particularly accelerating in May of that year. This makes sense as the U.S. government announced a universal tariff on nearly every country in the world in April, and the first effects of this would likely start to appear the following month. Many product categories from countries that were previously tariff-exempt were now subject to a blanket 10 percent tariff rate.14 Any firms that were importing from those countries would therefore be liable to pay the tariff. As we see, the number of firms making tariff payments grew by 28 percent from October 2024 to December 2025.
The second panel of Figure 5 decomposes total tariff payment amounts made by these same two subgroups. Here it becomes evident that new payers make up a much smaller share of the total tariff amount than their share of firms by count. This might be explained if firms importing from newly tariffed countries generally import less or are subject to lower tariff rate increases than firms that had been paying tariffs prior to 2025. It could also be related to the elimination of the de minimis tax exemption, which was a rule that allowed goods shipments valued at $800 or less to be exempt from tariffs and other duties. The exemption was eliminated effective May 2, 2025 for goods shipped from China or Hong Kong15 and effective August 29 for all other countries.16 To the extent that some firms may have been able to completely avoid tariffs due to this exemption while it was still in effect, these firms would likely import goods of a fairly small total value, and therefore would not add much to total tariff revenue.
Outflows to China by midsize firms have dropped by around 20 percent since 2024.
Although aggregate international payments remained steady in 2025, the composition of trading partners may have changed. We therefore examined country- and region-level transaction patterns over time and found that payments by midsize firms to China declined materially, while outflows to other major trading partners remained steady or increased. Outflows of midsize firms with previous payments to China display some potential indications of geographic reallocation to other destinations.
Figure 6: Middle market payments to China have dropped relative to other major trade partners.
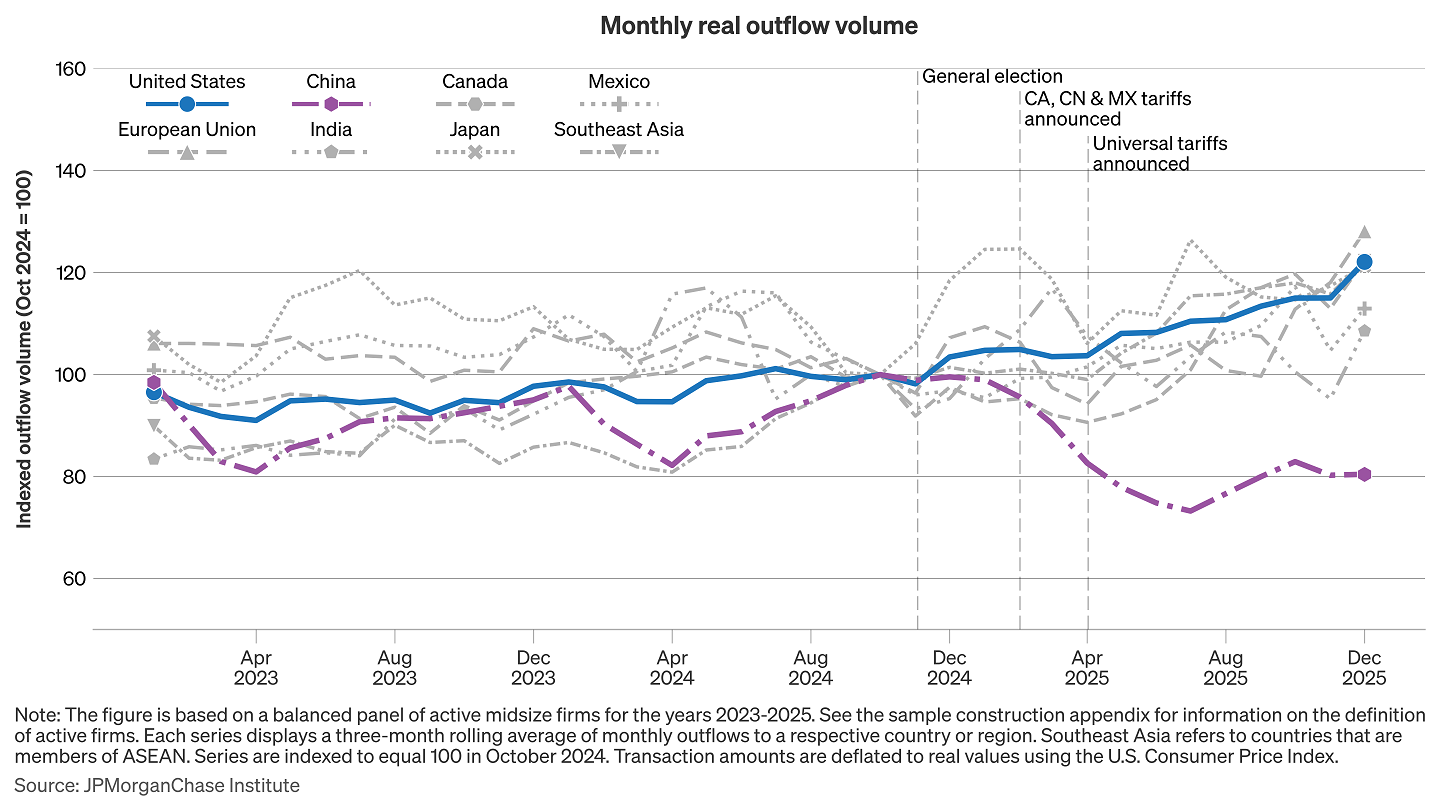
In Figure 6, we plot total monthly outflows by midsize firms to several important U.S. trade partners, and we again include the series of domestic payments for comparison. The series are indexed so they all equal 100 in October 2024.
Over the course of 2025, trends have diverged between the major destinations for international payments. Most notably, outflows to China have clearly dipped and remained below the 2023-2024 trend since the beginning of 2025. This is perhaps not surprising, as China has been the hardest hit by tariffs among major U.S. trade partners—both when considering the overall effective rate, which stood at 37.4 percent in October 2025, according to the Penn Wharton Budget Model,17 and in terms of policy uncertainty, as tariff announcements frequently shifted over the course of the year, briefly reaching rates as high as 125 percent before subsequent reductions.
In contrast to China, outflows to most other major international destinations have trended slightly to moderately positive. Outflows to Canada, the EU, Japan and Southeast Asia have all grown at least as fast as domestic transfers since 2024, while outflow growth to Mexico and India have been slightly more moderate. The robustness of outflows to Canada and Mexico may seem surprising, given that they were the first countries subjected to U.S. tariffs during 2025, along with China. However, despite headline tariff rates on Canada and Mexico of 35 and 25 percent respectively, the share of imports from these countries exempted from tariffs due to the United States-Mexico-Canada Agreement (USMCA) jumped to over 85 percent in the third quarter of 2025.18
Figure 7: Firms that transacted with China before 2025 have increased outflows to other parts of Asia.
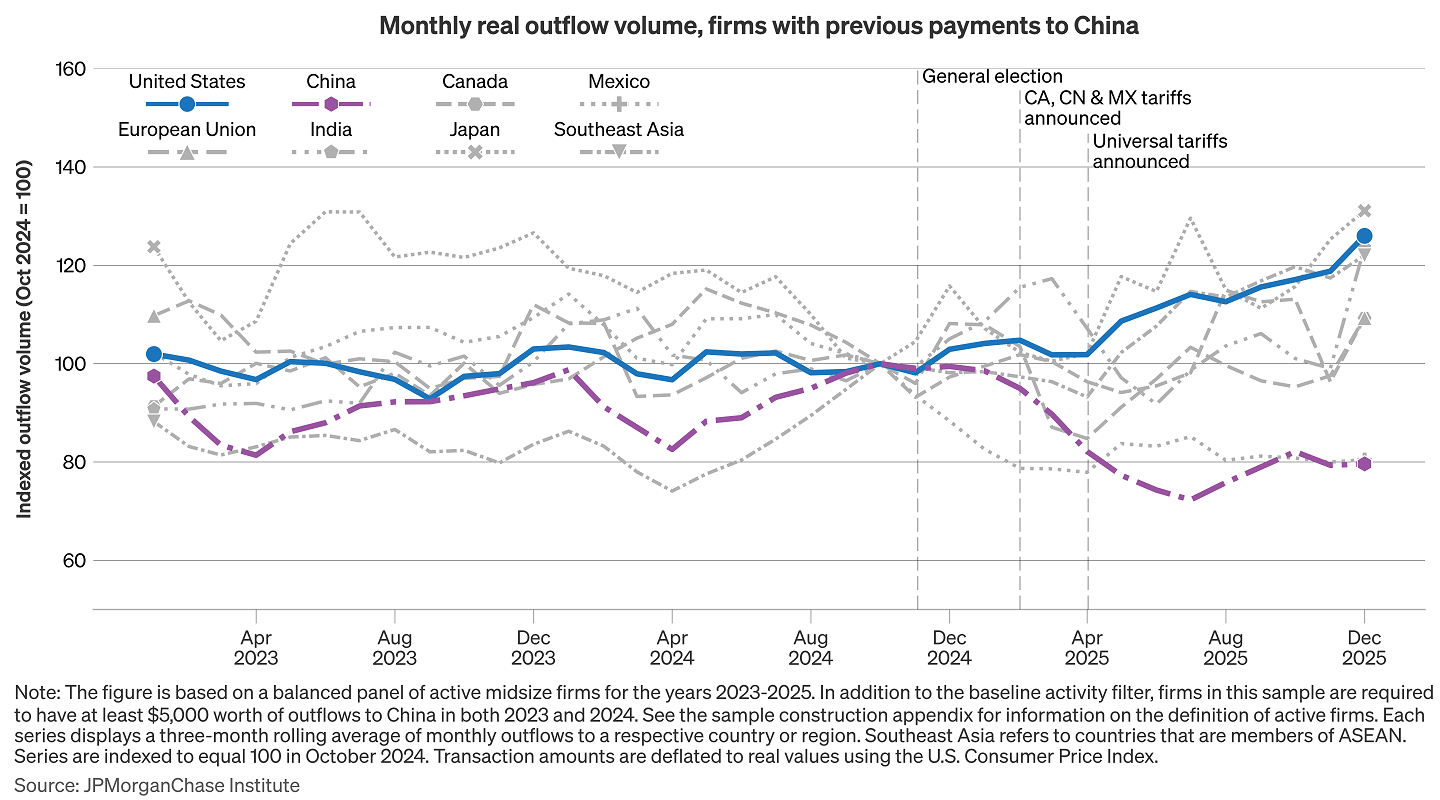
To investigate the decrease in outflow transaction volume to China in more detail, we further limit our sample to midsize firms that had at least $5000 worth of outflows to China in both 2023 and 2024. Conditioning on firms with previous outflows to China can provide clues about how these firms substitute between countries. In Figure 7 we show outflows of these firms to the same set of countries as in Figure 6, again indexed to October 2024.19
Midsize firms with previous outflows to China also substantially decreased their outflows to Mexico, and while flows to the European Union and Canada grew, they did so more slowly than for our overall sample of firms. On the other hand, outflows to Southeast Asia, Japan, and India grew by a similar amount in this restricted sample as in the sample of all firms, plotted in Figure 6. Flows to Japan and Southeast Asia especially accelerated after April, when tariff rates on China reached their peak. One potential reason for the increase in flows to these countries might be import substitution, but many other explanations are possible.
Even though aggregate international outflows remained relatively stable in 2025, we do see evidence that midsize firms may have begun to respond to higher tariffs in the case of China.
Recent changes in U.S. trade policy have raised tariffs substantially and introduced considerable uncertainty for firms engaged in international trade. In this context, firm-level payments data from midsize firms provide a useful lens for assessing how these businesses are responding. Our analysis identified three patterns: stable international payments alongside rising tariff costs, a concentration of tariff burdens among existing importers, and evidence of shifting trade relationships across countries. This gives rise to the following implications:
International flows by midsize firms have only moderately diverged from domestic flows. Even as tariff payments by midsize firms have surged, international outflows have seemingly held up, with international payments only slightly lagging behind domestic payment growth. Past research has shown that firms value supplier relationships highly, so switching to alternative suppliers may be a slow and complicated process. Additionally, our payments data include flows that are unrelated to trade and foreign direct investment, so if those are growing for unrelated reasons, it might offset a corresponding decline in tariff-sensitive transaction types.
Further monitoring is important as tariff effects could still take a while to set in. The unpredictable nature of tariff announcements so far and a protracted legal battle over the validity of tariffs enacted under IEEPA means that some firms may have delayed strategic decisions about imports. Hinz et al. (2026) have found that 96 percent of tariff costs have fallen on firms and consumers in the U.S., and Cavallo, Llamas and Vazquez (2026) found that by October 2025, 43 percent of tariff costs were passed through to consumer prices, implying that the majority of costs were borne by businesses. In the longer run, this may not be tenable, and firms that cannot raise prices profitably could be forced to find alternative suppliers abroad or domestically. Even if tariff policy were to remain unchanged from now on, the effects of previously implemented changes could continue to unfold for years. This underscores the importance of continually monitoring international flows to gauge how midsize firms and other agents within the economy are responding.
A decline in flows to China, coupled with higher flows to other Asian countries, suggest possible substitution in input sourcing. One of the only countries for which we see a clear decline in outflows is China, where payments are 20 percent lower than in October 2024. Of all major U.S. trade partners, China has been hit hardest and earliest by tariffs, so it would make sense for any effects of tariffs to be seen most clearly here. The increase in flows to other parts of Asia by firms that have previously traded with China could indicate that firms are finding alternative suppliers for production inputs in countries less affected by tariffs. However, we cannot observe if transactions in our data represent payment for a specific good, so we are unable to say with certainty if these changes represent supply chain restructuring. As tariff policy continues to develop, and as importing firms obtain more clarity on the long-run policy path, clearer effects on flows may become apparent. Continued monitoring of country-level flows can help us understand the consequences of tariff policy in detail.
For policymakers, these findings suggest that evaluating trade policy requires attention to how higher tariffs are distributed across firms, particularly midsize businesses that lack the scale to absorb sustained increases in import costs. Firm-level indicators, such as tariff payments and country-level transaction patterns, can help policymakers assess whether trade policy is meeting its objectives or imposing costs that may shape business behavior, and subsequently consumer behavior, over time, especially as uncertainty around the long-run policy environment persists.
In this section, we provide more details on how we constructed the samples of midsize firms and their transactions that we analyzed in this report. We imposed some universal conditions that apply to our full sample, and then added further restrictions for certain individual figures, as described below.
For our full sample of firms, we used data for midsize (also known as middle market) business clients of JPMorganChase. However, we excluded clients in the government, healthcare, higher education and nonprofit sectors. We also excluded certain firms that are likely to serve as financial intermediaries. This is because we cannot easily distinguish if transactions made by midsize firms within these sectors are done on their own behalf, or on behalf of their customers. On this background, we excluded the following NAICS codes: 541214, 561330, 561320, 561599, 459920, as well as all NAICS codes starting with 52.
We also dropped some individual transactions from our full sample. First, in the case of domestic transfers, we excluded all intra-company transactions. However, we kept international transactions between entities in the same corporate group, as these might still represent intra-company international trade or financing flows. Second, our data include some transactions that are extremely large, and which would cause the time series of total transaction amounts over time to become very volatile if they were included and be potentially misleading. To stabilize payment series and reduce month-to-month volatility, we dropped a very small number of these extreme outlier transactions. Specifically, we excluded a transaction by firm f in month m to country c if the transaction was both:
These calculations are based on transaction amounts in real dollars, deflated by the Consumer Price Index, to make amounts comparable across time periods. Through these adjustments, we dropped 0.4 percent of total transaction volume and less than 0.0001 percent of all transactions by count.
Finally, we applied a filter to ensure that we only included active firms in our sample. For any given month, a firm is considered active if it has had a monthly total of at least 10 outgoing transactions with a total outflow volume of at least $5000 (domestic or international) during the current month as well as the two preceding months. The vast majority of midsize firms have transaction amounts well above this limit, but the condition helps filter out firms that have inactive accounts.
The basic activity filter allows for firms to enter and leave the sample. However, as most of our figures track transaction amounts or firm counts over time,20 allowing for entry and exit could bias trends over time. For these figures, we therefore only included firms that satisfy the activity filter in every month depicted in the figure, such that we have a balanced panel of firms across all months.
Figure A1: Larger firms transact with a higher number of countries.
In Appendix Figure A1, we examine how this number of transaction destination countries covaries with firm size, as measured by total in- and outgoing annual transactions, both domestic and international. Unsurprisingly, the larger firms are, the more countries they tend to transact with. While over half of firms in the smallest quintile have no international transactions, this is only true for 17.5 percent of firms in the largest quintile. More than one-third of the largest firms transact with 10 or more countries.
Figure A2: International outflows are more skewed than domestic ones.
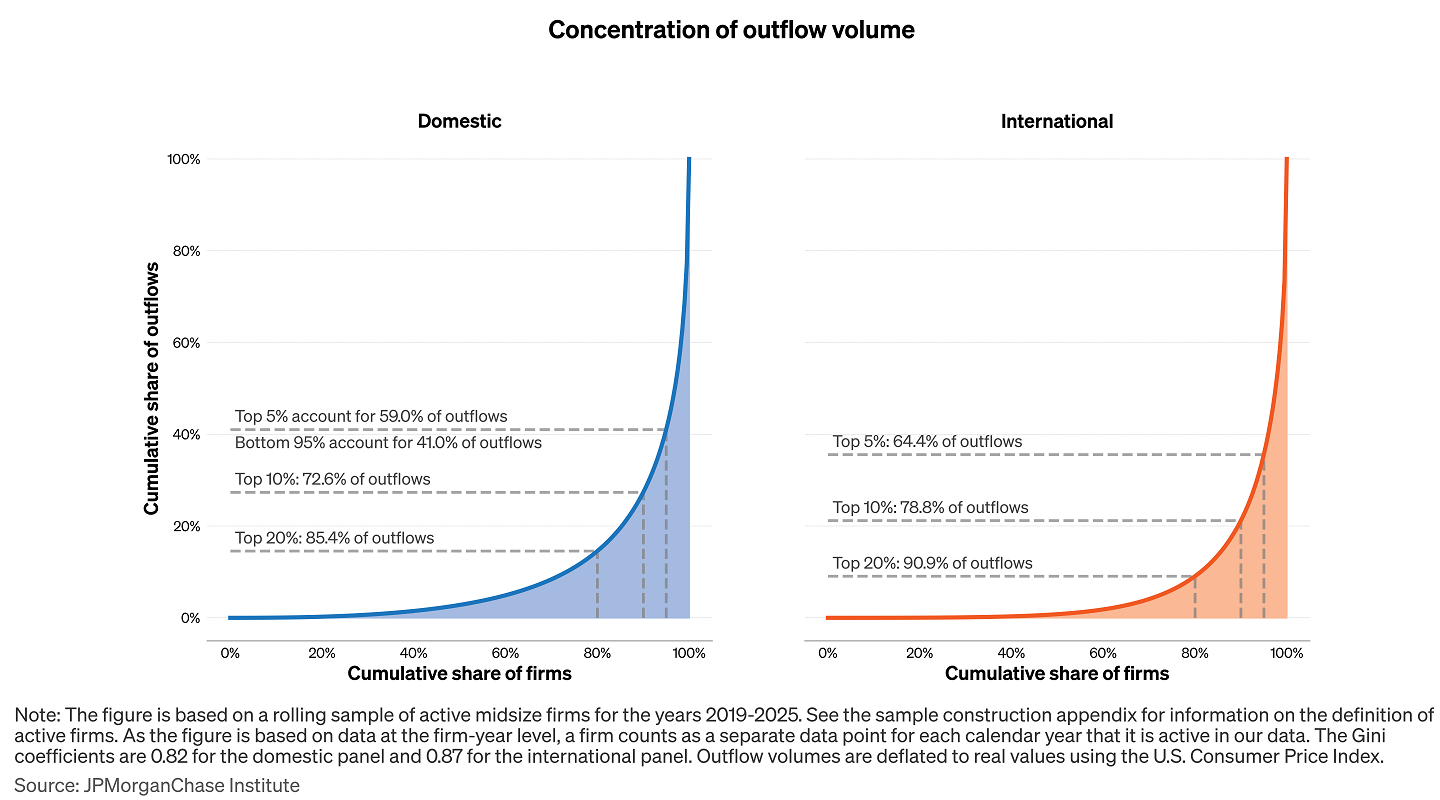
Although most midsize firms do have international outflows, they tend to be concentrated among a relatively small number of firms. Appendix Figure A2 shows the distribution of both domestic and international outflows by midsize firms in our sample through so-called Lorenz curves. This type of curve visualizes the concentration of flows by ordering firms along the horizontal axis by their total outflow amount, from smallest to largest. The height of the graph at a point shows the cumulative total outflows by all firms below a certain point. For example, in the left panel, we see that the smallest 80 percent of firms by domestic outflows are responsible for 14.6 percent of the total outflow amount – or conversely, that the largest 20 percent are responsible for the remaining 85.4 percent of domestic outflows. The concentration is even higher for international flows, though, as the top 20 percent drive 91 percent of outflows, and the top 5 percent of firms drive 64 percent.
Figure A3: Country shares of international payments are similar to import shares for midsize firms, but with more weight on Europe and less on Asia.
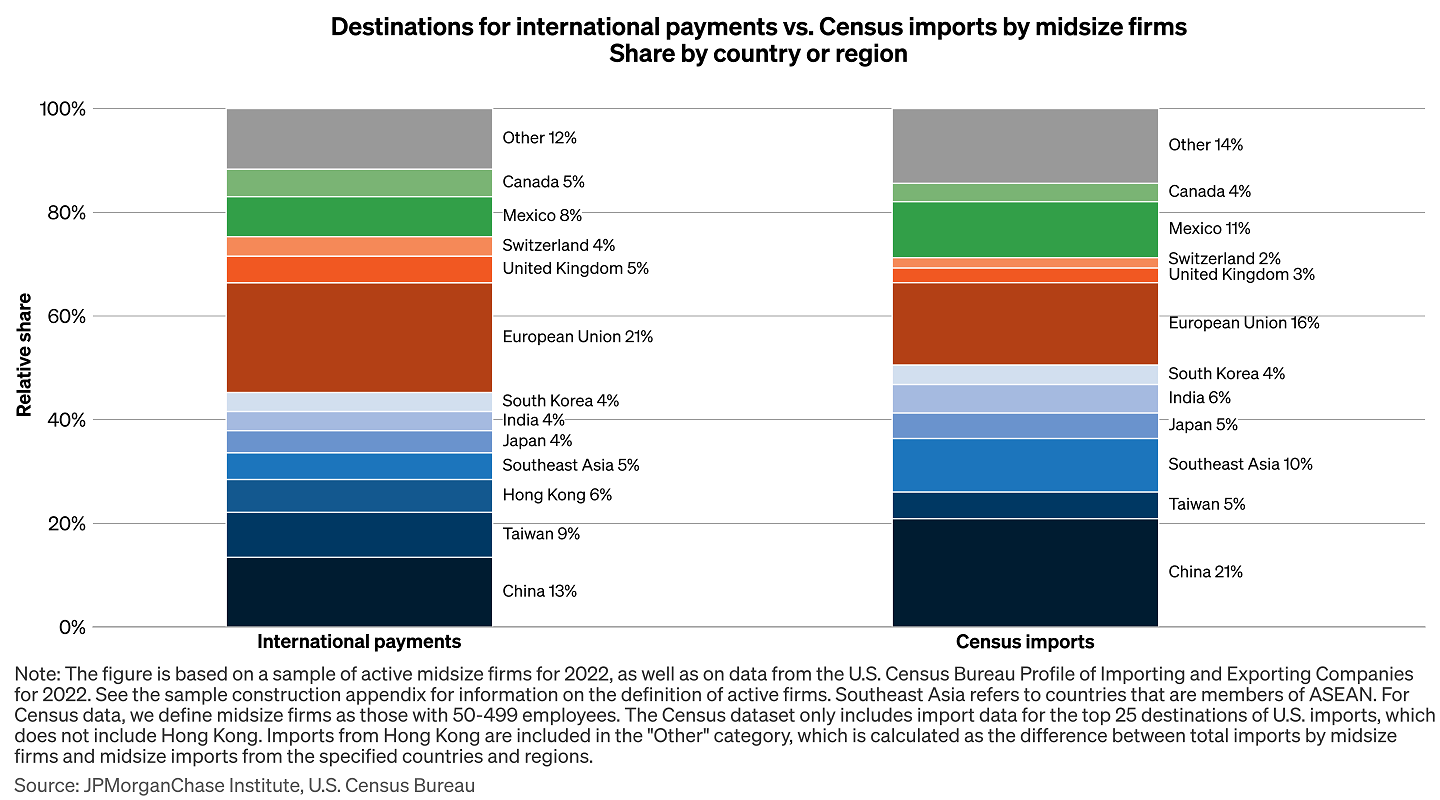
Appendix Figure A3 shows outgoing international payments in our sample by destination countries and regions, as well as the corresponding country-level breakdown of goods imports by midsize firms, which are available from the U.S. Census Bureau Profile of Importing and Exporting Companies. While our data represent total international payments and not just payments for goods trade, the two country-level distributions are similar, but with some distinct features. Relative to Census import data, payments in our data are less concentrated towards Asia, particularly with a lower weight on China and Southeast Asia, and with a relatively higher weight on Europe, especially the United Kingdom. These differences are likely to be driven partly by financing flows, which are also captured in our data, unlike the Census data. However, part of the difference could also be due to the composition of midsize firms in our sample relative to the full universe of midsize firms.
Figure A4: Individual firms have volatile international transaction patterns from year to year, but the overall distribution is relatively stable.
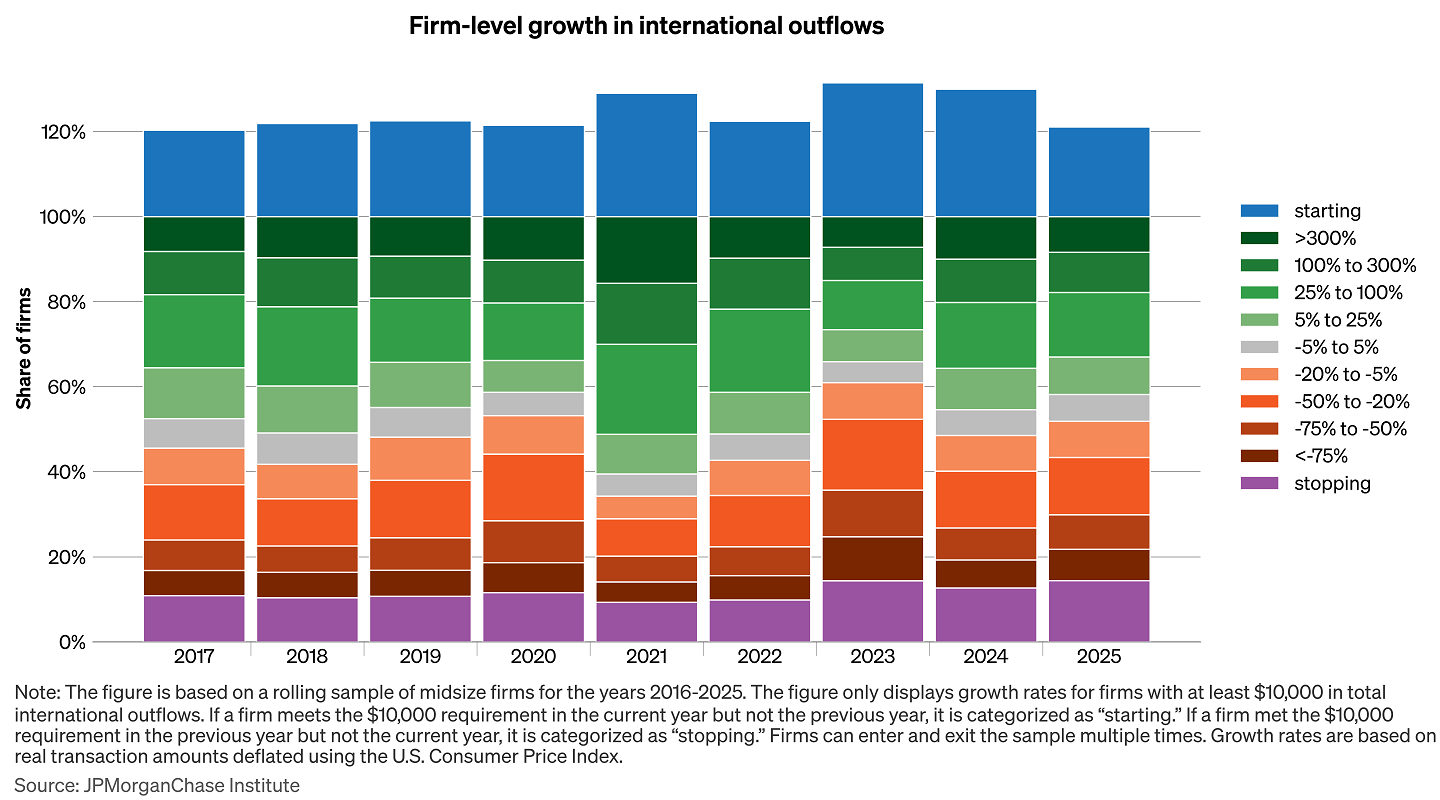
Appendix Figure A4 shows the composition of firm-level growth rates in international outflows across multiple years.21 The figure reveals that a large share of firms increases or decreases their international flows significantly each year, while it is fairly rare for firms to keep their international outflows more or less constant. However, even though individual firms tend to change their international transaction behavior significantly, the aggregate picture is more stable. While the distribution shifts somewhat from year to year, there are many firms each year within both the negative and positive growth bands. This highlights that although aggregate transaction patterns are a result of decisions at the firm level, these decisions are by no means uniform.
Bernard, Andrew B, J Bradford Jensen, Stephen J Redding, and Peter K Schott. 2007. "Firms in international trade." Journal of Economic Perspectives 105--130.
Burkhart, William F., and Keigh E. Hammond. 2026. Presidential 2025 Tariff Actions: Timeline and Status. CRS Report R48549, Congressonal Research Service. Accessed January 16, 2026. https://www.congress.gov/crs_external_products/R/PDF/R48549/R48549.12.pdf.
Cavallo, Alberto, Paola Llamas, and Franco M Vazquez. 2026. "Tracking the short-run price impact of US tariffs." Harvard Business School Pricing Lab. https://www.pricinglab.org/files/TrackingTariffs_Cavallo_Llamas_Vazquez.pdf
Federal Register. 2025a. "Further Amendment to Duties Addressing the Synthetic Opioid Supply Chain in the People's Republic of China as Applied to Low-Value Imports." Federal Register, April 7: 14899-14902. Accessed January 27, 2026. https://www.govinfo.gov/content/pkg/FR-2025-04-07/pdf/2025-06027.pdf.
—. 2025b. "Modifying Reciprocal Tariff Rates Consistent With the Economic and Trade Arrangement Between the United States and the People's Republic of China." Federal Register, November 7: 50729-50731. Accessed January 27, 2026. www.govinfo.gov/content/pkg/FR-2025-11-07/pdf/2025-19826.pdf.
—. 2025c. "Modifying the Scope of Tariffs on the Government of Brazil." Federal Register, November 26: 54467-54516. Accessed January 27, 2026. www.govinfo.gov/content/pkg/FR-2025-11-26/pdf/2025-21417.pdf.
Gopinath, Gita, and Brent Neiman. 2025. The Incidence of Tariffs: Rates and Reality. Working Paper No. 2025-151, Chicago: University of Chicago Becker Friedman Institute for Economics. https://bfi.uchicago.edu/wp-content/uploads/2025/12/BFI_WP_2025-151.pdf.
Hinz, Julian, Aaron Lohmann, Hendrik Mahlkow, and Anna Vorwig. 2026. America’s Own Goal: Who Pays the Tariffs? Kiel Policy Brief No. 201, Kiel Institute for the World Economy. http://kielinstitut.de/fileadmin/Dateiverwaltung/IfW-Publications/fis-import/92fb3f30-07b8-4dcf-b2bc-fbefb831f1a1-KPB201_EN.pdf.
International Trade Administration, U.S. Department of Commerce. 2026. Methods of Payment. Accessed January 16, 2026. https://www.trade.gov/methods-payment.
Kouvelis, Panos, Xiao Tan, and Sammi Tang. 2023. "Flexibility Value of Reshoring Capacity under Policy Uncertainty and Domestic Competition." University of Miami Business School Research Paper No. 4497854. https://ssrn.com/abstract=4497854.
Luo, Wanling, Lysle Boller, and Xiaoyue Sun. 2025. Import Surges and Tariff Avoidance: The Short-Term Impact of the Trump Administration’s Trade Policies. The Penn Wharton Budget Model.
Monarch, Ryan, and Tim Schmidt-Eisenlohr. 2016. "Learning and the Value of Relationships in International Trade." U. S. Census Bureau Center for Economic Studies Paper No. CES-WP-16-11.
Monarch, Ryan, and Tim Schmidt-Eisenlohr. 2023. "Longevity and the value of trade relationships." Journal of International Economics 103842.
National Center for the Middle Market. 2016. Winning in the Americas -- Middle Market Trade and Investment in North, Central, and South America. National Center for the Middle Market. https://www.middlemarketcenter.org/Media/Documents/us-middle-market-company-barriers-and-opportunities-in-north-central-and-south-america_NCMM_Export_Flagship_FINALr_web.pdf.
National Center for the Middle Market. 2025. Year-End 2024 Middle Market Indicator. National Center for the Middle Market. Accessed January 16, 2026. https://www.middlemarketcenter.org/Media/Documents/MiddleMarketIndicators/2024-Q4/FullReport/NCMM_MMI_YEAR-END_2024_web.pdf.
Supreme Court of the United States. 2025. Argument Transcript--Learning Resources, Inc. v. Trump, President of U.S. November 5. Accessed January 16, 2026. https://www.supremecourt.gov/oral_arguments/argument_transcripts/2025/24-1287_b07d.pdf.
—. 2026. Opinions of the Court - 2025. January 14. Accessed January 16, 2026. https://www.supremecourt.gov/opinions/slipopinion/25.
The Penn Wharton Budget Model. 2026. Effective Tariff Rates and Revenues. January 15. Accessed January 16, 2026. https://budgetmodel.wharton.upenn.edu/issues/2026/1/15/effective-tariff-rates-and-revenues-updated-january-15-2026.
The White House. 2025. Suspending Duty-Free De Minimis Treatment for All Countries. July 30. Accessed January 16, 2026. https://www.whitehouse.gov/presidential-actions/2025/07/suspending-duty-free-de-minimis-treatment-for-all-countries/.
U.S. Census Bureau. 2024. A Profile of U.S. Importing and Exporting Companies. April 4. Accessed January 16, 2026. https://www.census.gov/foreign-trade/Press-Release/edb/edbrel2022.pdf.
Wheat, Chris, Chi Mac, Ole Agersnap, and Nick Niers. 2025b. Exposure to tariffs for midsize firms by country of origin and industry. JPMorganChase Institute. https://www.jpmorganchase.com/content/dam/jpmorganchase/institute/documents/exposure-to-tariffs-for-midsize-firms-by-country-and-industry.pdf.
Wheat, Chris, Chi Mac, Ole Agersnap, and Nick Niers. 2025a. Exposure to tariffs for midsize firms by metro area. JPMorganChase Institute. https://www.jpmorganchase.com/content/dam/jpmorganchase/institute/documents/exposure-to-tariffs-for-midsize-firms-by-metro-area.pdf.
Zirpoli, Christopher T. 2025. Court Decisions Regarding Tariffs Imposed Under the International Emergency Economic Powers Act (IEEPA). CRS Legal Sidebar LSB11332, Congressional Research Service. https://www.congress.gov/crs-product/LSB11332.
We are thankful to the many people who made essential contributions to this research. We are indebted to our internal partners and colleagues who support delivery of our agenda in a myriad of ways, and we acknowledge their contributions to all of our work.
This material is a product of JPMorganChase Institute and is provided to you solely for general information purposes. Unless otherwise specifically stated, any views or opinions expressed herein are solely those of the authors listed and may differ from the views and opinions expressed by J.P. Morgan Securities LLC (JPMS) Research Department or other departments or divisions of JPMorgan Chase & Co. or its affiliates. This material is not a product of the Research Department of JPMS. Information has been obtained from sources believed to be reliable, but JPMorgan Chase & Co. or its affiliates and/or subsidiaries (collectively J.P. Morgan) do not warrant its completeness or accuracy. Opinions and estimates constitute our judgment as of the date of this material and are subject to change without notice. No representation or warranty should be made with regard to any computations, graphs, tables, diagrams or commentary in this material, which is provided for illustration/reference purposes only. The data relied on for this report are based on past transactions and may not be indicative of future results. J.P. Morgan assumes no duty to update any information in this material in the event that such information changes. The opinion herein should not be construed as an individual recommendation for any particular client and is not intended as advice or recommendations of particular securities, financial instruments, or strategies for a particular client. This material does not constitute a solicitation or offer in any jurisdiction where such a solicitation is unlawful.
Footnotes
Burkhart and Hammond (2026) provide a timeline and summary of tariff-related actions.
For example, certain agricultural products from Brazil, including beef and coffee, were excluded from tariffs in Executive Order 14361 of November 20, 2025 (Federal Register 2025c).
See Zirpoli (2025) for a summary. The Supreme Court heard oral arguments on November 5, 2025 (Supreme Court of the United States 2025). The most recent Supreme Court opinions issued in January 2026 did not include either tariff case (Supreme Court of the United States 2026).
For example, on November 4, 2025, Executive Order 14358 extended the truce between the U.S. and China (Federal Register 2025b).
National Center for the Middle Market (2025).
U.S. Census Bureau, A Profile of U.S. Importing and Exporting Companies (2024).
We use October 2024 as the index month to minimize any anticipatory effects of future tariffs on international payments. An expectation of future tariffs might induce firms to increase international payments in the short term in an attempt to front-run the tariffs and build inventory before they take effect.
Total domestic outflows by the sample of midsize firms used in Figure 2 were about seven times larger than total international transfers.
See International Trade Administration, U.S. Department of Commerce (2026) for details.
See Luo, Boller and Sun (2025).
While tariffs on China, Canada and Mexico were announced in February 2025, only a 10 percent tariff on Chinese imports went into effect that month, with the remainder postponed until March. Tariff increases implemented in March would likely be seen in our data from April onwards.
The Penn Wharton Budget Model (2026).
While even higher, so-called reciprocal tariffs were also announced for many countries at the same time, these were paused shortly afterwards and in many cases never took effect. However, the 10 percent baseline tariff rate continued to apply to most product categories from most countries.
See: Federal Register (2025a).
See: The White House (2025).
See: The Penn Wharton Budget Model (2026).
Ibid.
Note that Figure 7 displays aggregate flows among midsize firms that have previously transacted with China. While substitution might be more reliably measured through within-firm changes, this is difficult to do in practice since firm-level international transactions are very volatile over time. Each year, a large share of midsize firms materially increases their international flows, while many other firms significantly reduce them. However, despite this volatility within individual firms, the aggregate picture is more stable. See Appendix Figure A4 for details.
Specifically, Figures 2-7 in the main text.
Note: The figure only considers firms that have at least $10,000 of outgoing transactions in a year, in order to eliminate extreme growth rates due to small base amounts. Firms are denoted as “starting” if their transactions in a given year exceed $10,000 but were below this threshold the previous year, and as “stopping” if their transactions fall below $10,000. In each year, the share of firms in each growth band is calculated as the number of firms in that growth band divided by the total number of firms that had over $10,000 of international transactions the previous year. The size of the “starting” group is calculated in the same way, although the firms in this group are not part of the denominator, and are thus added in excess of the 100 percent, as they represent (gross) growth in the number of firms.
Authors

Chris Wheat
President, JPMorganChase Institute

Chi Mac
Business Research Director

Ole Agersnap
Middle Market Business Research Lead

Nick Niers
Research Associate
Media Contact
Shelby Wagenseller,
Shelby.Wagenseller@jpmchase.com