
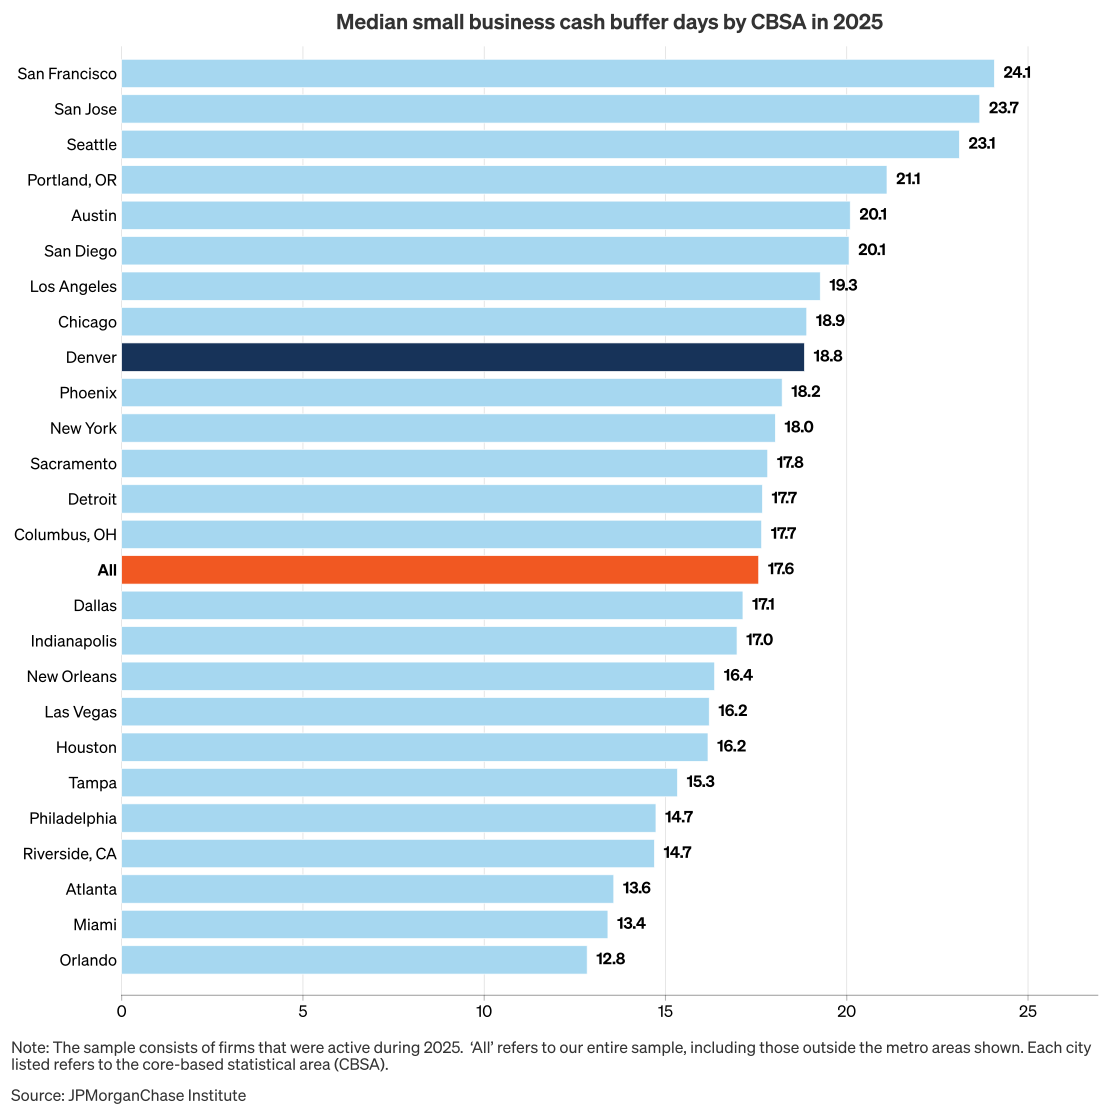
Figure 1: Denver small businesses held larger cash buffers than the overall median firm.
Creating thriving communities together
See how our clients and partners—from small business owners to workforce training leaders—work with JPMorganChase to drive meaningful impact and economic growth where they live and work.
Learn moreLatest news

Veteran’s Unconventional Path to Landing her Dream Job in Tech
U.S. Army Veteran Ashley Wigfall transitioned to a civilian role and charted her path to technologist through mentorship and skills training at the JPMorgan Chase tech hub in Plano, Texas.
Learn more
Research
May 27, 2026
Colorado is home to more than 730,000 small businesses, and over half of these are in the metropolitan Denver area. Small businesses accounted for 45.2 percent of employment in the Denver area, with the largest number of employees in the accommodation and food services industry (U.S. Small Business Administration 2025b, 2025c).1
We analyzed 2.1 million small businesses with Chase Business Banking accounts operating during 2025,2 including 28,000 in the Denver metro area,3 to provide a snapshot of their financial health. The typical small business in Denver exhibits financial health measures—nearly 19 cash buffer days and $126,400 in annual revenues—that are more robust than those of a typical small business in the U.S. Although there are differences across industries, professional services and restaurants appear to be particularly strong in Denver.
Cash buffer days: Small businesses may differ along many dimensions, such as size, industry, location, and growth trajectories, but they all need to manage their cash flows. Cash reserves can be used not only to absorb unexpected shortfalls in revenue or increases in expenses but also to invest in growth opportunities. We use cash buffer days to measure how long a small business could maintain its average outflows in the event of a complete disruption to inflows.4
Figure 1 shows the median cash buffer days for small businesses across 25 metro areas. The typical firm in our nationwide sample held 17.6 cash buffer days in 2025, indicating that its cash reserves could sustain its average outflows for over 17 days. The typical small firm in Denver held nearly 19 cash buffer days, suggesting a slightly greater ability to absorb economic shocks compared to the overall median.
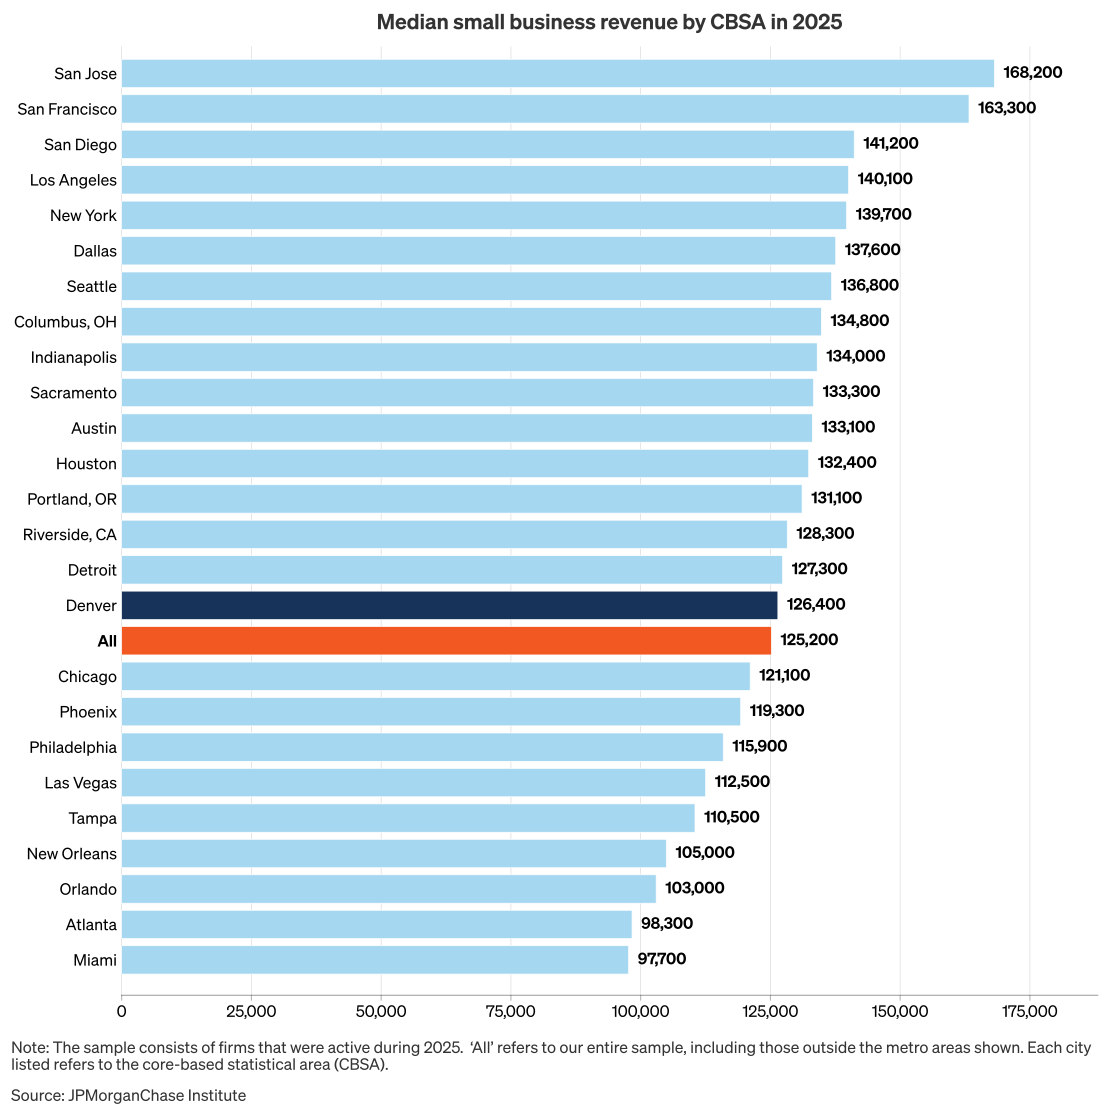
Revenues: Revenue is another important measure of firm financial health. Figure 2 shows the median annual revenues for 25 metro areas. Across our sample, the median small business generated $125,200 in revenues during 2025. In the Denver metro area, median revenue was slightly higher, at $126,400. Typical revenues may vary by industry, so the composition of the small business sector within a metro area could affect the median.
In the Denver metro area, professional services had the most small businesses, while accommodation and food services employed the most people. A larger share of Denver’s small businesses is engaged in professional services: 18 percent in Denver compared to 13 percent nationwide.5
There were 68,107 small businesses in professional services in Denver, out of a total of 378,321. Nationwide, there were 4,881,738 small businesses in professional services, out of a total of 36,186,089 small firms (U.S. Small Business Administration 2025a, 2025c). This industry corresponds to two-digit NAICS code 54 and is also known as professional, scientific, and technical services.
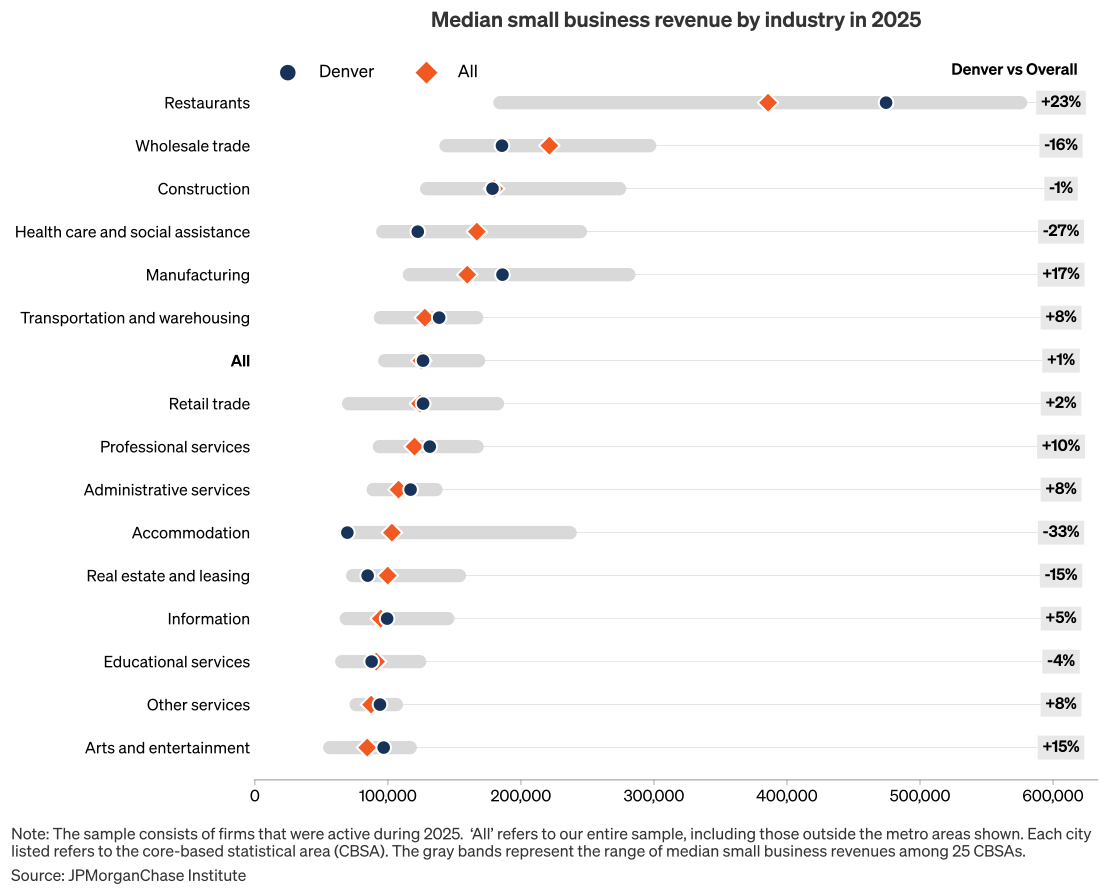
Figure 3 shows the median annual revenues in 2025 by industry for Denver, relative to the median in our overall sample, as well as the range of median revenues across 25 metro areas. Small professional service firms in Denver earned revenues that were 10 percent higher than those in our overall sample. In accommodation and food services, the industry with the most small business employment in Denver, median revenue was higher than the overall for restaurants but lower for accommodation.6 Revenues at Denver restaurants were 23 percent higher than the overall sample. However, small businesses in the accommodation sector had median revenues that were 33 percent lower than overall. Moreover, accommodation in Denver had median revenues that were at the low end of the range among 25 metro areas.
Taken together, the median cash buffer days and revenues suggest that small businesses in Denver exhibit slightly higher measures of financial health than the typical small firm elsewhere in the U.S. Denver appears particularly strong in professional services and food services, two of its largest sectors.
Farrell, Diana, Chris Wheat, Chi Mac, and Bryan Kim. 2020. “Small Business Expenses during COVID-19.” JPMorganChase Institute. https://www.jpmorganchase.com/institute/all-topics/business-growth-and-entrepreneurship/report-small-business-expenses-during-COVID-19.
U.S. Small Business Administration, Office of Advocacy. 2025a. “2025 Small Business Profile, United States.” Accessed April 8, 2026. https://advocacy.sba.gov/wp-content/uploads/2025/06/United_States_2025-State-Profile.pdf.
U.S. Small Business Administration, Office of Advocacy. 2025b. “2025 Small Business Profile, Colorado.” Accessed April 8, 2026. https://advocacy.sba.gov/wp-content/uploads/2025/06/Colorado_2025-State-Profile.pdf.
U.S. Small Business Administration, Office of Advocacy. 2025c. “Small Business Profiles for Major Metropolitan Areas of the West 2025.” Accessed April 8, 2026. https://advocacy.sba.gov/wp-content/uploads/2025/10/West_2025_FINAL.pdf.
This material is a product of JPMorganChase Institute and is provided to you solely for general information purposes. Unless otherwise specifically stated, any views or opinions expressed herein are solely those of the authors listed and may differ from the views and opinions expressed by J.P. Morgan Securities LLC (JPMS) Research Department or other departments or divisions of JPMorgan Chase & Co. or its affiliates. This material is not a product of the Research Department of JPMS. Information has been obtained from sources believed to be reliable, but JPMorgan Chase & Co. or its affiliates and/or subsidiaries (collectively J.P. Morgan) do not warrant its completeness or accuracy. Opinions and estimates constitute our judgment as of the date of this material and are subject to change without notice. No representation or warranty should be made with regard to any computations, graphs, tables, diagrams or commentary in this material, which is provided for illustration/reference purposes only. The data relied on for this report are based on past transactions and may not be indicative of future results. J.P. Morgan assumes no duty to update any information in this material in the event that such information changes. The opinion herein should not be construed as an individual recommendation for any particular client and is not intended as advice or recommendations of particular securities, financial instruments, or strategies for a particular client. This material does not constitute a solicitation or offer in any jurisdiction where such a solicitation is unlawful.
We are thankful to the many people who made essential contributions to this research, especially Michael Vaden for exceptional research assistance. We are also indebted to our internal partners and colleagues, who support delivery of our agenda in a myriad of ways and acknowledge their contributions to each release.
JPMorganChase Institute. 2026. “Small business snapshot: Denver.” https://www.jpmorganchase.com/institute/all-topics/business-growth-and-entrepreneurship/denver-small-business-snapshot
There were 378,321 small businesses in the Denver metropolitan area and 730,887 small businesses in Colorado. Denver area data is reported for the Denver-Aurora-Centennial metropolitan area in 2022, the most recent available from the U.S. Census Bureau.
Our sample includes small firms with no more than three deposit accounts that were open during the entire 2025 calendar year and active, with at least 10 transactions and $500 in outflows, in at least three months. To ensure that these firms were small, we limited the sample to firms operating in one ZIP code and one industry.
Throughout this brief, we use the Core Based Statistical Area (CBSA) for Denver but may refer to the area simply as Denver for brevity.
During times of distress, small businesses may pull back expenses, possibly to preserve liquidity. For example, during the COVID-19 pandemic, expense growth mirrored the reduced revenue growth small businesses experienced due to operating restrictions and lower demand (Farrell et al. 2020).
There were 68,107 small businesses in professional services in Denver, out of a total of 378,321. Nationwide, there were 4,881,738 small businesses in professional services, out of a total of 36,186,089 small firms (U.S. Small Business Administration 2025a, 2025c). This industry corresponds to two-digit NAICS code 54 and is also known as professional, scientific, and technical services.
Small businesses in accommodation and food services employed 82,616 people in Denver in 2022 (U.S. Small Business Administration 2025c). In Figure 3, we split out restaurants (food services) and accommodation to highlight differences in these sectors.
Media Contact
Shelby Wagenseller,
shelby.wagenseller@jpmchase.com