
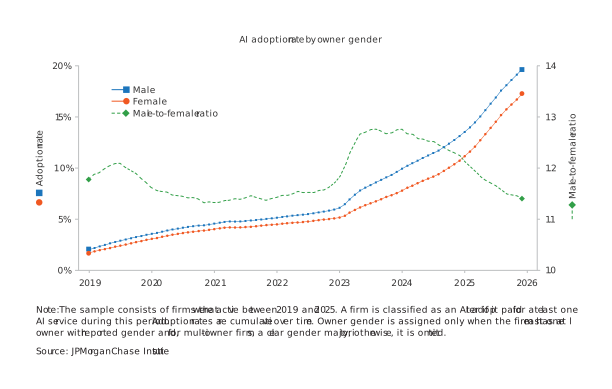
Figure 1: Male owners consistently adopted AI at a higher rate, with the gap widening post-2023.

Creating thriving communities together
See how our clients and partners—from small business owners to workforce training leaders—work with JPMorganChase to drive meaningful impact and economic growth where they live and work.
Learn moreLatest news

Veteran’s Unconventional Path to Landing her Dream Job in Tech
U.S. Army Veteran Ashley Wigfall transitioned to a civilian role and charted her path to technologist through mentorship and skills training at the JPMorgan Chase tech hub in Plano, Texas.
Learn more
Research
May 28, 2026
Artificial intelligence is rapidly becoming embedded in everyday business operations, and small businesses have accelerated their adoption as AI tools grow more accessible and easier to deploy. However, this democratization has not uniformly reached all business owners. Longstanding differences in technology adoption across gender and age appear to be extending into the AI era, raising questions about who will capture the productivity gains of this new technology.
This report examines differences in AI adoption across business owner demographics using Chase Business Banking transaction data from 2019 through 2025. Our transaction-based approach tracks AI-related purchasing behavior across business owner gender and generational cohorts, providing a unique lens on AI adoption across these demographics. We find:
These findings reveal substantial variation in AI adoption across business owner demographics. The widening gender gap among younger business owners is particularly concerning. As Generation Z represents a growing share of business owners, gender differences in access to AI-driven productivity gains may widen over time.
For policymakers, these trends indicate that supporting broader adoption may require specific interventions, such as AI literacy and skills training targeted at underrepresented groups, particularly younger female entrepreneurs. Community-based networks and peer mentorship programs could also help business owners navigate AI adoption challenges, ensuring technological advances reduce rather than widen existing disparities in small business outcomes.
In Wheat, Mac, and Passalacqua (2026), we documented dramatic increases in AI adoption among small businesses, though significant gaps persisted across employer status, revenue size, and industry. Existing research has documented systematic differences in technology adoption across business owner demographics, with gender and age emerging as significant predictors of digital technology uptake (Orser, Riding, and Li 2019).1 Recent studies have begun examining these patterns also in AI adoption, though primarily through consumer surveys and self-reported data. They document gender gaps in generative AI usage (Deloitte 2024; Otis et al. 2024) and age-related differences in generative AI adoption (Meyer 2011; BPC 2023). However, evidence on actual business purchasing behavior remains limited, as most research relies on self-reported adoption rather than observed transactions and focuses predominantly on generative AI.
This report addresses this gap using transaction data from de-identified Chase Business Banking deposit accounts spanning 2019 through 2025. By tracking payments made to AI services rather than relying on self-reported data, we observe how adoption has evolved by business owner gender and four generational cohorts: Baby Boomers, Generation X, Millennials, and Generation Z. Our approach captures the broad landscape of AI services, including but not limited to generative AI tools.
Women-owned businesses have been documented to generate lower revenues and face greater capital constraints than male-owned businesses. These factors can shape decisions regarding investment in emerging technologies. We assess whether this extends to AI adoption by examining adoption rates by business owner gender.
Figure 1 shows the evolution of AI adoption rates by business owner gender from 2019 to 2025, as well as the ratio of their adoption rates. Male business owners consistently adopted AI services at higher rates than female owners, though the magnitude of this gap varied considerably over time. The gender adoption gap also holds consistently across industries, as shown in Figure A1, suggesting that the disparity is not driven by sectoral composition effects. One potential explanation for the gender gap is the lower share of female employer firms compared to female nonemployer firms.2 In 2019, adoption rates remained low for both groups, with male-owned businesses at approximately 2 percent and female-owned businesses at 1.7 percent, representing a modest 0.3 percentage point gap. This relatively narrow disparity persisted through early 2023, when male owners reached 6.1 percent adoption while female owners approached 5.2 percent. However, 2023 appears to mark an inflection point where the trajectories began diverging more substantially. By the end of 2025, male-owned businesses reached 19.7 percent adoption while female-owned businesses reached 17.2 percent, creating a 2.5 percentage point gap, more than eight times larger than the initial disparity observed in 2019.
The ratio of male-to-female adoption provides a measure of the relative magnitude of the adoption gap. In 2019, male-owned businesses adopted at a rate 1.18 times (or 18 percent) higher than female-owned businesses. This ratio reached 1.28 in 2023 and then by the end of 2025, it fell to 1.14. This means that female-owned businesses are catching up proportionally as overall adoption rises, even if the absolute gap is widening.
Taken together, these results suggest that while female business owners are responding to increased AI accessibility, there may be structural barriers that prevent them from closing the absolute gap despite the increase in overall AI adoption.
These patterns align with broader evidence on gender differences in technology adoption and business outcomes. Consumer-level research on generative AI adoption shows similar gender gaps, with women's overall adoption rates trailing men's by substantial margins despite recent acceleration (Deloitte 2024). A Harvard Business School meta-analysis examining 18 studies covering over 140,000 individuals found women had 22 percent lower odds of using generative AI than men (Otis et al. 2024). Research examining gender disparities more broadly has documented several factors affecting technology adoption: women entrepreneurs face distinct barriers including limited access to capital, time constraints from caregiving responsibilities, and knowledge gaps about information and communication technology tools (Orser, Riding, and Li 2019; OECD 2025). If women-owned businesses systematically lag in adopting productivity-enhancing technologies like AI, existing performance gaps could potentially widen rather than narrow over time.
Over half of small business owners are age 55 or older, even as Millennials and Generation Z represent a growing share of new business formation (U.S. Census Bureau 2020). As younger generations typically demonstrate greater digital familiarity and faster uptake of new technologies,3 we examine whether these patterns hold for AI adoption by analyzing adoption rates across four generational cohorts. These demographic trends in adoption could meaningfully influence how quickly AI becomes integrated into small business operations.
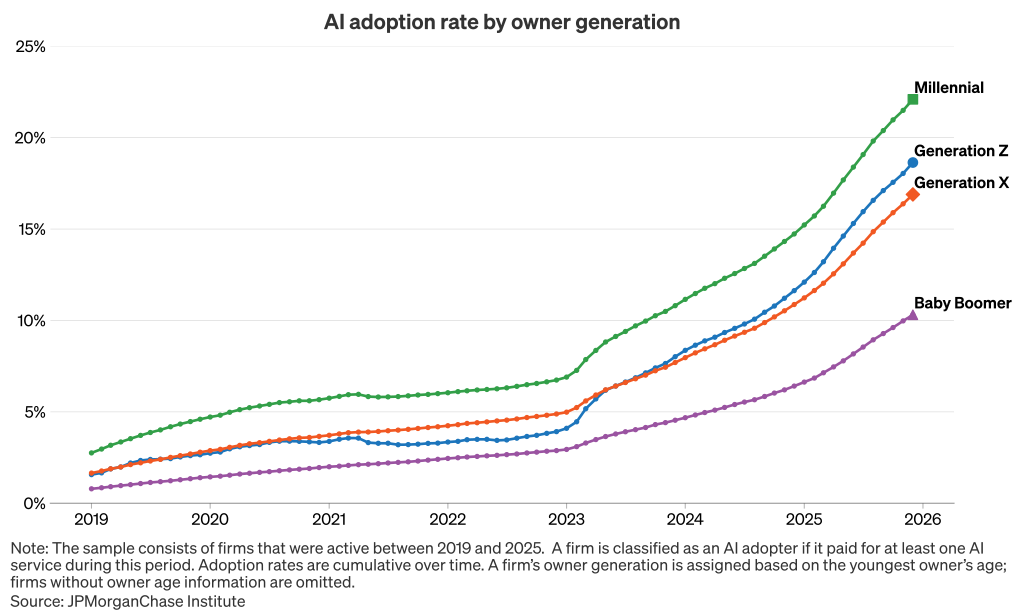
Figure 2 shows AI adoption rates by business owner generation from 2019 to 2025. Millennial owners experienced the highest adoption rates throughout the period, starting at approximately 2.8 percent in 2019 and reaching 22.1 percent by the end of 2025. Generation Z owners, who began the period with adoption rates comparable to other generations, experienced a sharp acceleration and overtook Generation X by mid-2023, reaching approximately 18.6 percent adoption by 2025. While still lagging behind Millennials, as more members of Generation Z reach the typical age for business ownership, this cohort's high adoption rates may increasingly influence overall small business AI adoption patterns. Generation X owners showed moderate adoption rates, reaching approximately 16.9 percent by 2025. Baby Boomer owners showed notably lower adoption, reaching only 10.3 percent by 2025, less than half the adoption rate of Millennials. While all generations accelerated adoption after 2022, the gap between Millennials and Baby Boomers widened from approximately 2 percentage points in 2019 to 11.8 percentage points by 2025, suggesting that younger business owners are adopting AI at substantially faster rates than their older counterparts.
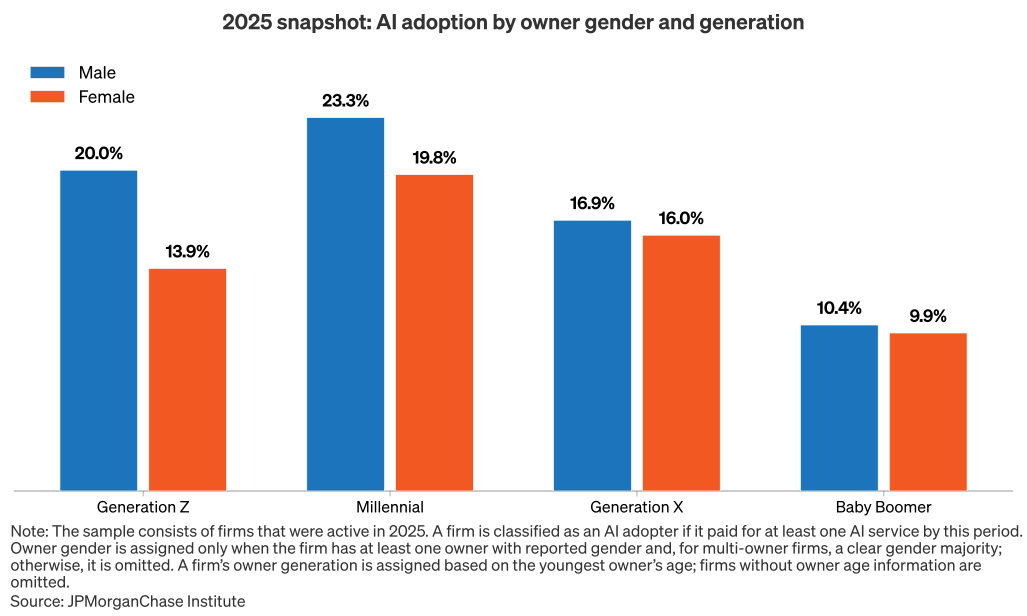
Figure 3 examines the intersection of business owner gender and generation in 2025 AI adoption rates. The gender gap in AI adoption varied substantially across generations, with the largest disparity observed among Generation Z owners: 20 percent of firms owned by men adopted AI by 2025 compared to 13.9 percent of those owned by women, a gap of 6.1 percentage points. This gender gap narrowed considerably for older generations, with Baby Boomers showing only a 0.5 percentage point gap (10.4 percent vs. 9.9 percent).
These generational differences in AI adoption align with survey evidence. For instance, a 2024 Gusto survey of over 1,300 small business owners found that about two-thirds of Millennial and Gen Z owners have tried generative AI, compared to lower rates among Baby Boomer and Gen X entrepreneurs (Tremper 2024).4 More generally, these results complement evidence on age-related patterns in technology adoption. For instance, prior research has found that younger entrepreneurs are more likely to adopt digital technologies than older ones, with workforce age showing a negative relationship to technology adoption probability (Meyer 2011). As AI represents one of the newest and fastest growing technologies entering the business landscape, generational patterns in technology adoption and factors affecting them may be particularly relevant for understanding differences in productivity and competitiveness across small businesses.5
Lower barriers to entry have enabled the rapid acceleration of AI adoption among small businesses. However, this democratization has not reached all business owners. Substantial gaps persist across generational cohorts and between male and female business owners.
As policymakers consider how to support small business competitiveness in an economy where AI plays a growing role, addressing these persistent adoption gaps could help ensure broad-based access to the technology's benefits. We offer two key implications:
Our sample consists of the same small business panel constructed in Wheat, Mac, and Passalacqua (2026) with the same activity, industry, and location filters.
To perform disaggregated analyses by business owner gender and generation, we first assigned gender and age information to firm owners in our sample. We use authorized signers on business accounts as a proxy for business owners.6
For gender classification, we assigned a gender to each firm only if it had at least one owner and a clear gender majority, defined as more than 50 percent of owners being either male or female. This resulted in 52 percent of sample firms classified as male-owned or female-owned.
For generational classification, we derived four generational cohorts based on the youngest owner’s year of birth. These generational cohorts are the following: Generation Z (1997–2013), Millennials (1980–1996), Generation X (1965–1979), and Baby Boomers (1946–1964). Firms whose youngest owner belonged to the Silent Generation or had missing age data were excluded from this classification, yielding generation classifications for 90 percent of sample firms.
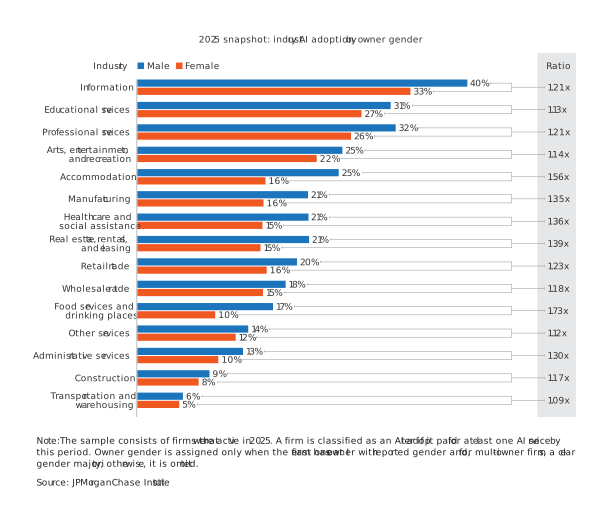
Figure A1 shows that in 2025, male business owners maintained higher AI adoption rates across industry categories. The ratio of male-to-female adoption rates ranged from 1.21x in information (where female owners adopted at 33 percent versus male owners at 40 percent) to 1.73x in food services and drinking places. Knowledge-intensive sectors such as professional services showed male adoption rates of 32 percent compared to 26 percent for female owners (a 1.21x ratio), while more capital-intensive industries like manufacturing demonstrated larger gaps (21 percent male versus 16 percent female, a 1.35x ratio). Notably, even in industries with relatively high female representation such as educational services and health care, male owners adopted at rates 1.13x and 1.36x higher respectively. This consistent pattern across diverse sectors suggests that the gender differences may reflect systematic barriers in adoption rather than industry-specific factors.
Barna. 2024. “Hesitant & Hopeful: How Different Generations View Artificial Intelligence. ” https://www.barna.com/research/generations-ai/.
Bipartisan Policy Center. 2023. “Artificial Intelligence Usage Among Small Business Owners.” https://bipartisanpolicy.org/wp-content/uploads/2024/03/Google-survey-analysis.pdf.
Deloitte. 2024. “Women and Generative AI: The Adoption Gap Is Closing Fast, but a Trust Gap Persists.” www.deloitte.com/us/en/insights/industry/technology/technology-media-and-telecom-predictions/2025/women-and-generative-ai.html.
Farrell, Diana, Chris Wheat, and Chi Mac. 2019. “Gender, Age, and Small Business Financial Outcomes.” JPMorganChase Institute. https://www.jpmorganchase.com/content/dam/jpmc/jpmorgan-chase-and-co/institute/pdf/institute-report-small-business-financial-outcomes.pdf.
Meyer, Jenny. 2011. “Workforce age and technology adoption in small and medium-sized service firms.” Small Business Economics 37, no. 3: 305-324.
OECD/GWEP. 2025. “Bridging the Finance Gap for Women Entrepreneurs: Insights from Academic and Policy Research.” OECD Studies on SMEs and Entrepreneurship. OECD Publishing, Paris.
Orser, Barbara, Riding, Allan, and Li, Yanhong. 2019. “Technology adoption and gender-inclusive entrepreneurship education and training.” International Journal of Gender and Entrepreneurship 11, no. 3: 273-298.
Otis, Nicholas G., Katelyn Cranney, Solene Delecourt, and Rembrand Koning. 2024. “Global Evidence on Gender Gaps and Generative AI.” Working Paper 25-023. Harvard Business School.
Tremper, Nicholas. 2024. “The State of Small Business: Small Business Owners Rely on AI & Want Action on Taxes and Healthcare Policies.” Gusto. https://gusto.com/resources/gusto-insights/state-of-small-business-2024.
U.S. Census Bureau. 2020. “Business Owners' Ages: Over Half of U.S. Business Owners Were Age 55 and Over.” https://www.census.gov/library/visualizations/2020/comm/business-owners-ages.html.
Vogels, Emily A. 2019. “Millennials stand out for their technology use, but older generations also embrace digital life.” Pew Research Center. https://www.pewresearch.org/short-reads/2019/09/09/us-generations-technology-use.
Wheat, Chris, Chi Mac, and Andrea Passalacqua. 2026. “Understanding the use of AI among small businesses.” JPMorganChase Institute.
https://www.jpmorganchase.com/institute/all-topics/business-growth-and-entrepreneurship/understanding-ai-use-by-small-businesses.
We are thankful to the many people who made essential contributions to this research. We owe particular thanks to Michael Vaden for exceptional research assistance, and we are also grateful to Sarwari Das for her valuable research support.
We are indebted to our internal partners and colleagues, who support delivery of our agenda in a myriad of ways and acknowledge their contributions to each and all releases.
This material is a product of JPMorganChase Institute and is provided to you solely for general information purposes. Unless otherwise specifically stated, any views or opinions expressed herein are solely those of the authors listed and may differ from the views and opinions expressed by J.P. Morgan Securities LLC (JPMS) Research Department or other departments or divisions of JPMorgan Chase & Co. or its affiliates. This material is not a product of the Research Department of JPMS. Information has been obtained from sources believed to be reliable, but JPMorgan Chase & Co. or its affiliates and/or subsidiaries (collectively J.P. Morgan) do not warrant its completeness or accuracy. Opinions and estimates constitute our judgment as of the date of this material and are subject to change without notice. No representation or warranty should be made with regard to any computations, graphs, tables, diagrams or commentary in this material, which is provided for illustration/reference purposes only. The data relied on for this report are based on past transactions and may not be indicative of future results. J.P. Morgan assumes no duty to update any information in this material in the event that such information changes. The opinion herein should not be construed as an individual recommendation for any particular client and is not intended as advice or recommendations of particular securities, financial instruments, or strategies for a particular client. This material does not constitute a solicitation or offer in any jurisdiction where such a solicitation is unlawful.
Wheat, Christopher, Chi Mac, and Andrea Passalacqua. 2026. "The AI adoption gap: Gender and generation among small business owners." JPMorganChase Institute.
https://www.jpmorganchase.com/institute/all-topics/business-growth-and-entrepreneurship/ai-adoption-gap-gender-generation-among-small-business-owners.
This gap is not limited to technology adoption. For instance, Farrell, Wheat, and Mac (2019) found that female-owned firms start with revenue levels 34 percent lower than male-owned firms and experience slower revenue growth over time. Small businesses with older owners are more likely to survive compared to younger generations.
For instance, in January 2025 employer firms accounted for 17 percent of all female-owned firms, compared with 23.5 percent among male-owned firms. Wheat, Mac, and Passalacqua (2026) showed that employer firms adopted AI at a higher rate over 2019–2025.
For instance, according to a survey conducted by the Pew Research Center, 93 percent of Millennials own smartphones compared to 90 percent of Generation X, 68 percent of Baby Boomers, and 40 percent of the Silent Generation, and 86 percent of Millennials use social media compared to smaller shares among older generations (Vogels 2019).
A recent survey conducted by the Bipartisan Policy Center (BPC) in collaboration with Morning Consult highlights notable demographic gaps in AI familiarity among small business owners. According to the survey, 36 percent of male small business owners reported being very familiar with AI, compared to only 30 percent of female small business owners, indicating a gender gap in AI adoption. The survey also revealed significant generational differences: 49 percent of owners aged 18–34 reported being very familiar with AI, followed by 43 percent of those aged 35–44, 21 percent of those aged 45–64, and just 20 percent of those over 65 (BPC 2023).
One potential driver of generational differences in adoption is trust in the technology: 45 percent of Baby Boomers say they do not trust AI, compared to only 18 percent of Generation Z and 21 percent of Millennials (Barna 2024).
Sixty-one percent of the firms in our data have only one signer, and 24 percent have two signers. Some businesses do not have any identified signer: these account for 9 percent of our sample.
Authors

Chris Wheat
President, JPMorganChase Institute

Chi Mac
Business Research Director

Andrea Passalacqua
Small Business and LED Research Lead
Media Contact
Shelby Wagenseller,
shelby.wagenseller@jpmchase.com