Mary Callahan Erdoes

Investor Reports

Asset & Wealth Management

Mary Callahan Erdoes, Letter to Shareholders

April 7, 2025

Topics

Mary Callahan Erdoes

As we look to the future, we are committed to driving innovation and consistent growth, ensuring that we continue to meet and exceed your expectations.

Mary Callahan Erdoes

CEO, Asset & Wealth Management

Read more

J.P. Morgan has a proud fiduciary history spanning nearly two centuries of managing client assets. Throughout each decade, we have consistently delivered valuable insights and strong performance to a distinguished clientele worldwide, including governments, major institutions, central banks, sovereign wealth funds, CEOs, founders and individuals. Our steadfast commit­ment to delivering strong and consistent results has solidified our position as a leader in industry growth. Whether supporting a first-time saver seeking cash management solutions or retire­ment options at a Chase branch or serving a major state pension plan in need of tactical asset allocation overlay strategies, our franchise continues to strengthen with each new relationship, earning the trust of our clients. 

Having had the privilege of working for Jamie Dimon for over two decades, I am reminded every day that success is not accidental and should never be taken for granted. Sustainable growth requires constant innovation, extraordinary focus, intensity and drive, coupled with a fortress mindset – always preparing for the toughest challenges while remaining poised to seize new opportunities. We are in a fiercely competitive race to identify the best opportunities for our clients and for our future growth while simultaneously maintaining our unwavering focus on cutting waste and achieving operational excellence.

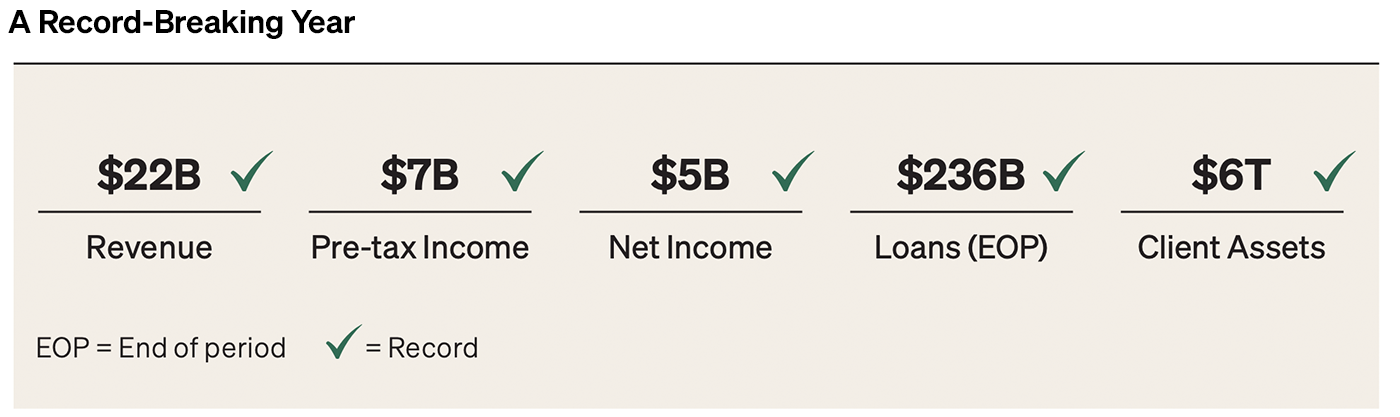
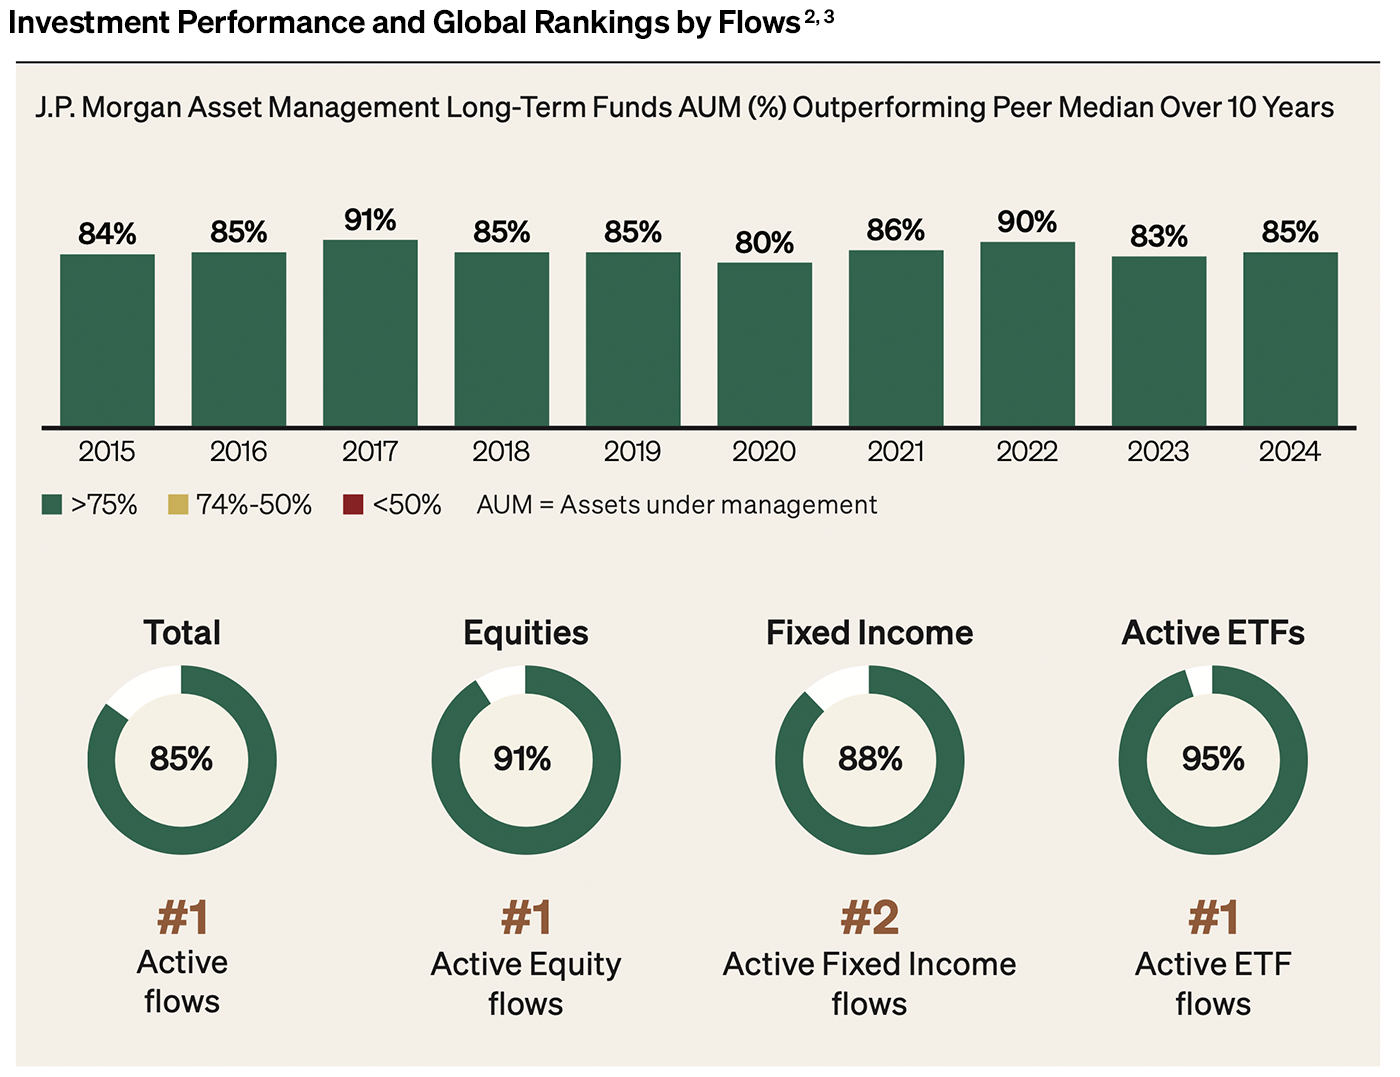
In Asset & Wealth Management (AWM), my partners and I work tirelessly to optimize client portfolios and future-proof them for what lies ahead. We achieve this by delivering leading investment performance, leveraging what I believe is the most exceptional talent in the industry and executing our most ambitious investment agenda to date. Our focus on investing in cutting-edge technology and our elite talent, while driving out inefficiencies, has led us to highly profitable growth for our shareholders.

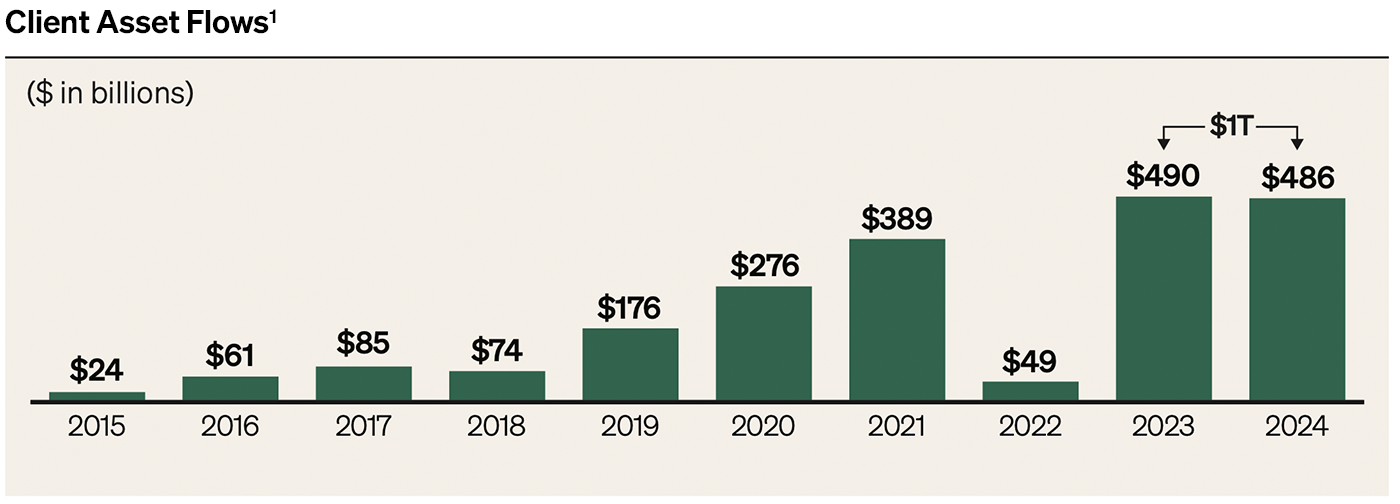
Our clients vote daily on our success with their consistent contribution of new assets. They have demonstrated their ongoing confidence in our strategy by entrusting us with an additional $486 billion in net new assets, bringing the total to nearly $1 trillion of inflows over the past two years. This remark­able achievement stands as the ultimate testament to the strength and effectiveness of our business.

Client asset flows from 2015 to 2024

The image titled "Client Asset Flows" displays a bar chart representing the annual client asset flows from 2015 to 2024, measured in billions of dollars. The values for each year are as follows:

- 2015: $24 billion

- 2016: $61 billion

- 2017: $85 billion

- 2018: $74 billion

- 2019: $176 billion

- 2020: $276 billion

- 2021: $389 billion

- 2022: $49 billion

- 2023: $490 billion

- 2024: $486 billion

The chart highlights a significant increase in client asset flows over the years, with a notable peak in 2023 and 2024, where the combined flows reach $1 trillion.

Building on this tremendous momen­tum, we have achieved record results across nearly all financial metrics, reaching all-time highs in five key performance indicators.

Record-Breaking Year

The image titled "A Record-Breaking Year" presents financial metrics with corresponding values and indicators of record achievements. The metrics are as follows:

1. Revenue: $22 billion, marked with a check indicating a record achievement.

2. Pre-tax Income: $7 billion, marked with a check indicating a record achievement.

3. Net Income: $5 billion, marked with a check indicating a record achievement.

4. Loans (EOP): $236 billion, marked with a check indicating a record achievement. (EOP stands for End of Period)

5. Client Assets: $6 trillion, marked with a check indicating a record achievement.

Each metric is accompanied by a check mark, signifying that it has reached a record level.

01

 Actively managing our clients’ assets

Over the past two decades, we have focused on and invested in the industry’s leading active management platform, even as many of our peers double down on passive strategies. In today’s market environment, where having fundamental insights is critical, we believe our responsibility is to proactively seek opportunities that are not yet reflected in backward-looking benchmark weightings. We have responded swiftly and adeptly to various market cycles, consistently achieving world-class investment performance. Our peer-leading performance has enabled us to deliver positive outcomes for our inves­tors, strengthening our clients’ trust in us as their long-term partner and attracting more clients than ever before.

Investment Performance and Global Rankings by Flows

The image titled "Investment Performance and Global Rankings by Flows" presents data on J.P. Morgan Asset Management's long-term funds' assets under management (AUM) outperforming peer median over 10 years, along with global rankings by flows in different categories. The information is as follows:

Bar Chart: J.P. Morgan Asset Management Long-Term Funds AUM (%) Outperforming Peer Median Over 10 Years

- 2015: 84%

- 2016: 85%

- 2017: 91%

- 2018: 85%

- 2019: 85%

- 2020: 80%

- 2021: 86%

- 2022: 90%

- 2023: 83%

- 2024: 85%

2024 Investment Performance and Global Rankings by Flows

1. JPMAM investment performance: 85%
Active Flows Ranking: #1

2. Equity investment performance: 91%
Active Equity Flows Ranking: #1

3. Fixed Income investment performance: 88%

Active Fixed Income Flow: #2

4. Active ETFs investment performance: 95%

Active ETF Flows: #1

The image highlights J.P. Morgan Asset Management's strong performance and leading positions in active flows across various investment categories.

A key component of our strategy to be the industry’s leading active manager is our substantial investment in our research capabilities. In 2024, we employed 490 proprietary research analysts across various asset classes, underscoring our commitment to mak­ing informed decisions and embedding research into our culture and business ecosystem. In the past year alone, our research team provided coverage on approximately 4,700 companies and conducted nearly 11,000 company visits and engagements. These real-time, on-the-ground insights from around the world, infused with JPMorganChase’s dominant technology, empower our teams to adeptly navigate complex global markets for our clients. 

By harnessing and leveraging advanced technologies – such as artificial intelligence (AI), machine learning and proprietary data science – we enhance all aspects of our business, significantly improving our risk management capa­bilities, streamlining operations and boosting overall efficiency. Our recent launch of GPT-Insights exemplifies this commitment, streamlining the research process for Asset Management (AM) investors. This proprietary generative AI tool creates comprehensive company reports from multiple sources, high­lighting both internal and external perspectives in an easily digestible format. Since its December 2024 launch, GPT-Insights has reduced research task times by up to 85%, guiding investors on where to delve deeper. Our dedication to leveraging state-of-the-art technology not only strengthens our competitive edge but also aligns with our broader goal of delivering superior value to our clients – from pilot to production to profitabil­ity. We are setting a new standard of innovation in the banking industry, driving sustainable growth and long-term shareholder value.

Lastly, in recent years we have made significant investments in our exchange-traded funds (ETF) platform. The combination of top active manage­ment performance and ETF expertise has positioned us as a leader in the rapidly expanding field of active ETFs. In 2024, we were the leader in inflows in both active management and active ETFs across the industry.

01

Best-in-class advisory teams

Over the past five years, we have strategically invested in expanding and elevating our global advisor teams to enhance our capabilities and meet clients’ diverse and evolving needs. This includes both hiring new advisors and expanding our comprehensive training programs to equip them with the latest knowledge and skills, ensuring they remain at the forefront of industry trends. With over 9,500 advisors, our Wealth Management network reflects a 6% growth in 2024 – a notable achievement given industry stagnation – demonstrating the scale of our global platform and our commitment to first-class service and expertise. We aim to build future-ready advisory teams in Wealth Management, Institutional and Retail/Funds, setting a standard that is admired by our competitors.

Advisor Growth and Client Coverage

The image titled "Advisor Growth and Client Coverage" provides information on the growth of wealth management advisors and client coverage metrics. The details are as follows:

Wealth Management Advisors (in thousands)

- The chart shows an increase in the number of wealth management advisors from 6.6 thousand to 9.5 thousand, representing a growth factor of +1.4x.

- The advisors are divided into two categories:

- Global Private Bank (represented in dark green)

- U.S. Wealth Management (represented in gray)

Client Coverage Metrics

1. 57%: Represents the percentage of the largest pensions and sovereign wealth funds that are clients.

2. 70%+: Indicates that over 70% of U.S. financial advisors' opportunities are covered.

3. 680+: Refers to the number of global billionaires as clients, with 23 Wall clients managing approximately $3 trillion in wealth.

The image highlights the significant growth in the number of wealth management advisors and the extensive client coverage achieved by the organization.

In addition to hiring and training, we equip our advisors with cutting-edge AI tools like Connect Coach and Sales Assist, significantly enhancing their productivity and scope. With over 80% of AWM Front Office utilizing our J.P. Morgan Large Language Model (AI) Suite, each day we uncover oppor­tunities to eliminate “no joy” work and repetitive tasks, allowing our teams to focus on higher-value activities. These initiatives are integral to deliver­ing exceptional service and driving sustainable growth.

How AI is being utilized to enhance business processes

The image titled "AI Use Case Examples" presents two examples of how AI is being utilized to enhance business processes: Connect Coach and Sales Assist. The details are as follows:

Connect Coach

- Purpose: Enhances customer experience through proactive engagement.

- Features:

- Utilizes client and market data to provide tailored recommendations.

- Boosts productivity with detailed call summaries.

- Impact: Approximately 95% quicker at locating relevant content to drive impactful conversations with clients.

Sales Assist

- Purpose: Supports sales processes by providing real-time information.

- Features:

- Transcribes calls and presents relevant information in real time.

- Supports discussions with key product information and thought leadership.

- Summarizes calls and tags client data for consistent entry and analysis.

- Impact: Approximately 20% higher gross sales supported by Sales Assist year-over-year (YoY), enhanced by focusing on high-impact client work.

The image highlights the significant improvements in efficiency and effectiveness achieved through the use of AI in these specific business functions.

01

Highly customized solutions for each individual

Our vision for personalized advice focuses on empowering both clients and advisors to make choices tailored to each unique situation. To enhance our capabilities, we made two import­ant acquisitions: 55ip (in 2020) and OpenInvest (in 2021). Our technology teams leverage these acquisitions, alongside continuous proprietary devel­opments, to equip every portfolio team with the most modern and advanced tools and resources. This enables them to customize preferences and concen­trations, adapt to tax considerations and create portfolios that are aligned with their specific needs. We don’t believe any fiduciary manager should dictate choice or preferences for a client’s investment portfolio. Instead, we empower clients to specify criteria important to them, and J.P. Morgan teams execute accordingly.

We believe our fiduciary voice should be leveraged to influence the compa­nies we invest in, drawing on our two centuries of collective knowledge to enhance long-term shareholder value creation. Our in-house stewardship teams operate independently, without relying on external proxy advisors to vote for us. In fact, we have taken major steps to minimize the influence of proxy advisory firms on our teams and no longer incorporate their research into the governance decisions made by our stewardship and investment profes­sionals. We take pride in the active role our fundamental investors play in the governance process, utilizing their expertise and insights to ensure strong oversight for client portfolios.

01

Alternatives

Alternatives have always been a key differentiator in our clients’ portfolios, as we are among the leading providers and investors globally. Recently, this asset class has emerged as one of the industry’s largest and fastest-growing areas, primarily driven by the open-ended structure now available to individual investors. In response, we have strategically restructured our coverage into two distinct pillars: AWM Alternative Solutions and AM Private Markets. This new structure is designed to broaden our coverage and enable meaningful growth, leveraging our rich history of over 60 years and our extensive experience across various investment types. With these enhancements, we are poised to expand our coverage and unlock our deep expertise in this area, ultimately providing our clients with innovative and tailored investment solutions across the board – from third-party strategies to funds managed by our own teams. By aligning our resources and capabilities with the evolving needs of the market, we are well-equipped to navigate the complexities of the finan­cial landscape and drive sustainable growth in this important area.

Growth in assets under supervision from 2019 to 2024

The image titled "Alternative Asset" displays a bar chart representing the growth in assets under supervision from 2019 to 2024, measured in billions of dollars. The details are as follows:

Assets Under Supervision ($ in billions)

- 2019: $265 billion

- 2024: $504 billion

The chart indicates a growth of 90% in assets under supervision over this period.

Asset Categories for 2024:

- Liquid Alternatives/Other

- Hedge Funds

- Private Credit

- Private Equity

- Real Assets

The image highlights the significant increase in alternative assets under supervision, with a detailed breakdown of asset categories for the year 2024.

01

Global footprint

As a business within a firm with hun­dreds of years of history, we possess a deep understanding of the complex economic and geopolitical landscape that shapes our industry. Today, AWM maintains client coverage in over 150 countries, underscoring our commit­ment to serving a diverse range of clients globally. In recent years, we have invested in opening new offices in Athens, Jacksonville, Manchester, Munich, Salt Lake City and Scottsdale. Additionally, we have increased our number of advisors by more than 10% in other key offices, including Austin, Fort Lauderdale and Frankfurt. In China, we have one of the largest teams of research analysts covering Chinese stocks among foreign-owned asset managers. These investments build a strong foundation for AWM for decades to come.

In addition to expanding our geographic footprint, we cultivate a culture of excellence through talent mobility, ensuring our teams are not only adept in local market dynamics but also aligned with our cohesive global culture. This combination allows us to remain agile and responsive, position­ing us to capitalize on emerging trends and to deliver a consistent experience to our clients worldwide. Lastly, in most of AWM locations around the world, we co-locate with our Consumer & Community Banking and Commercial & Investment Bank partners, significantly amplifying our impact on clients and communities.

01

Evidence that this strategy is working: strong roe for our firm and shareholders

Our results are not only strong compared with every major competitor but are also crucial for the broader success of JPMorganChase. Our ability to deliver industry-leading return on equity (ROE) stems from our disci­plined approach to managing every dollar on our balance sheet, contribut­ing to a robust blended ROE for our shareholders. These results, achieved while maintaining significant invest­ment in our business, speak to the strength of our franchise and the focus of our strategic investment agenda. 

2024 Return on Equity (ROE) for the 10 largest asset and wealth managers

The image titled "Peer-Leading Performance" presents a bar chart showing the 2024 Return on Equity (ROE) for the 10 largest asset and wealth managers. The details are as follows:

- Peer #1: 12%

- Peer #2: 13%

- Peer #3: 15%

- Peer #4: 15%

- Peer #5: 17%

- Peer #6: 21%

- Peer #7: 23%

- Peer #8: 28%

- Peer #9: 28%

- JPM AWM (J.P. Morgan Asset and Wealth Management): 34%

J.P. Morgan Asset and Wealth Management (JPM AWM) leads the group with the highest return on equity at 34%, significantly outperforming its peers. The chart highlights JPM AWM's strong performance in comparison to other major asset and wealth managers.

01

Conclusion

Our fiduciary commitment to our clients serves as our north star, guiding every aspect of our work. I am proud of how we have successfully guided our clients and shareholders through the challenges and volatility of recent years, all while making significant investments in the future.

As each of the three lines of business at JPMorganChase strives every day to excel in our respective areas, we are acutely aware that our collective strength surpasses the sum of our individual parts. Together with my Operating Committee partners in AWM, we work relentlessly to maximize the firm’s value to every client, delivering investment advice, liquidity manage­ment, capital markets expertise, credit, payments, custody and full-service banking. Clients benefit from being part of the broader JPMorganChase ecosystem, as does each line of business, with access to unparalleled resources and scale that set us apart from the competition.

We are deeply grateful for the trust our clients and shareholders place in us and remain dedicated to delivering excellence every day. By leveraging the strengths of JPMorganChase, we are confident in our ability to deliver exceptional value and maintain our leadership position in the industry. As we look to the future, we are committed to driving innovation and consistent growth, ensuring that we continue to meet and exceed your expectations.

Mary Callahan Erdoes

Mary Callahan Erdoes

CEO, Asset & Wealth Management

Read more

References

1. In the fourth quarter of 2020, the Firm realigned certain wealth management clients from AWM to CCB. Prior-period amounts have been revised to conform with the current presentation.

2. Percentage of active exchange-traded funds (ETF) assets under management (AUM) in funds ranked in the 1st or 2nd quartile (one, three and five years): All quartile rankings, the assigned peer categories and the asset values used to derive these rankings are sourced from the fund rating providers. Quartile rankings are based on the net-of-fee absolute return of each fund. Where applicable, the fund rating providers redenominate asset values into U.S. dollars. The percentage of AUM is based on fund performance and associated peer rankings at the share class level for U.S.-domiciled funds, at a primary share class level to represent the quartile ranking for U.K., Luxembourg and Hong Kong SAR funds, and at the fund level for all other funds. The performance data may have been different if all share classes had been included. Past performance is not indicative of future results. “Primary share class” means the C share class for European funds and ACC share class for Hong Kong SAR and Taiwan funds. If these share classes are not available, the oldest share class is used as the primary share class. Due to a methodology change effective September 30, 2023, prior results include all long-term mutual fund assets and exclude active ETF assets.

3. Source: Public filings, company website, Morningstar.

4. Alternatives assets include Private Equity, Private Credit, Real Assets, Hedge Funds, Liquid Alternatives, and other nontraditional assets. Assets calculated using net asset value of investments (except for certain Real Asset strategies, which use gross asset value) plus undrawn, committed capital. AUM only for 2005. 2023 restated due to product reclassification.

5. Source: Public filings; return on equity (ROE) or comparable metric is based on as reported figures, where available. For peers that do not report ROE or a comparable metric, calculations were derived from reported net income attributable to common shareholders and the reported average common shareholders’ equity.

CEO Letters

  • Jamie Dimon

    Chairman and Chief Executive Officer

    View Letter
  • Marianne Lake

    CEO, Consumer & Community Banking 

    View Letter
  • Douglas B. Petno and Troy Rohrbaugh

    Co-CEOs, Commercial & Investment Banking

    View Letter
  • Mary Callahan Erdoes

    CEO, Asset and Wealth Management 

    View Letter
  • Tim Berry

    Global Head, Corporate Responsibility

    View Letter
  • Jennifer Piepszak

    Chief Operating Officer

    View Letter