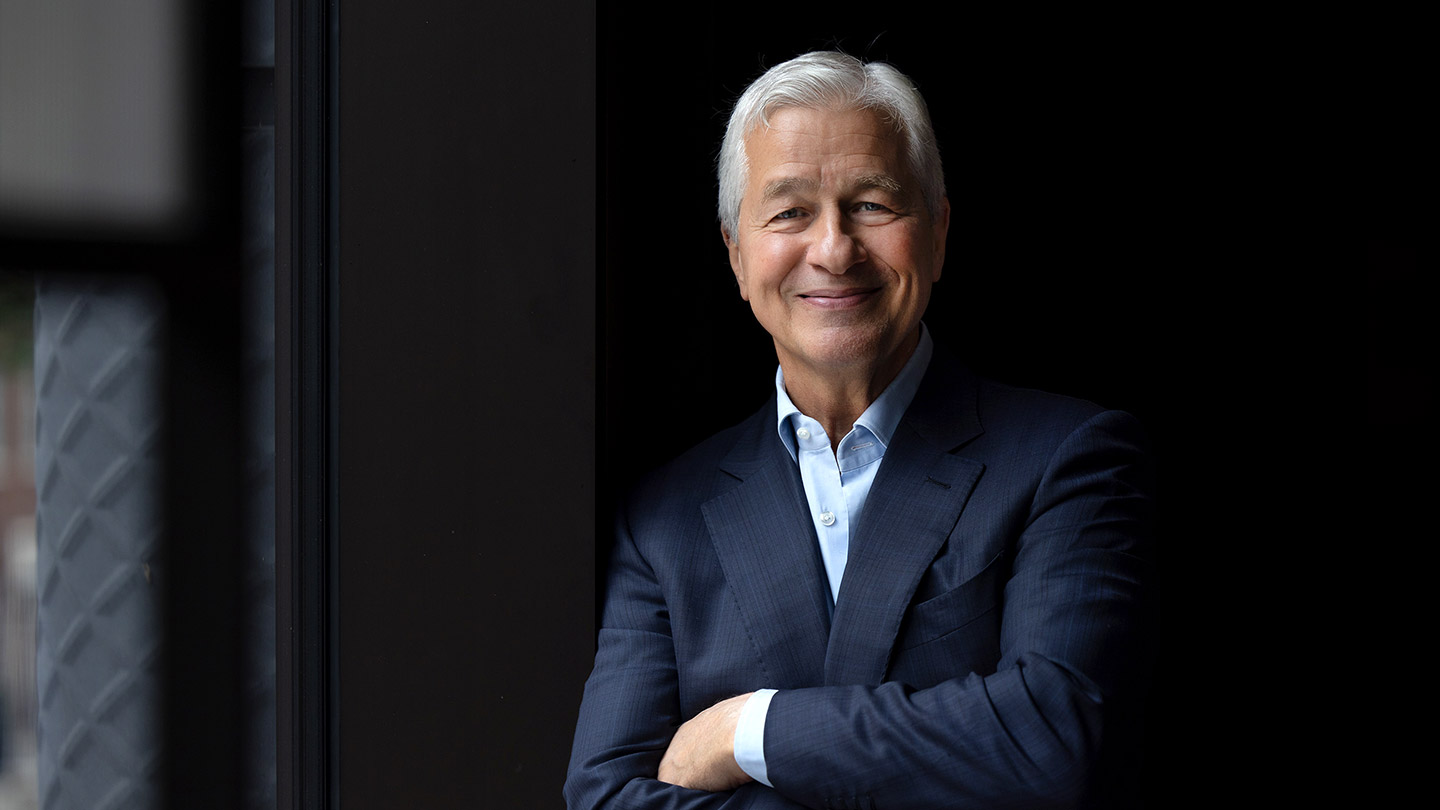
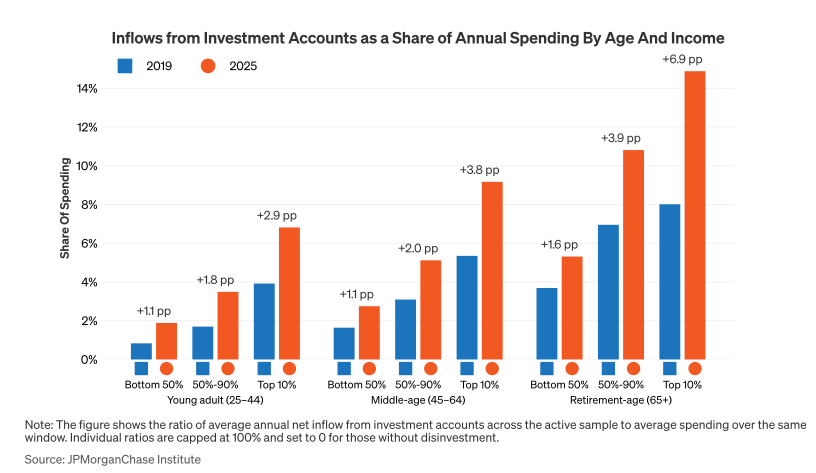
High earners and older individuals have seen the biggest increases among groups using investment wealth to support spending.

Creating thriving communities together
See how our clients and partners—from small business owners to workforce training leaders—work with JPMorganChase to drive meaningful impact and economic growth where they live and work.
Learn moreLatest news

Veteran’s Unconventional Path to Landing her Dream Job in Tech
U.S. Army Veteran Ashley Wigfall transitioned to a civilian role and charted her path to technologist through mentorship and skills training at the JPMorgan Chase tech hub in Plano, Texas.
Learn more
Research
September 17, 2026
Household stock holdings hit all-time highs in late 2025, making up about a third of all household assets as investment accounts have become a more active part of everyday financial life rather than a place where wealth just sits. JPMC Institute analysis tracks the money people are moving from investment accounts into checking, where it becomes available to spend.
Topline: Since 2019, individuals are twice as likely to move money from investment to checking accounts. These investment withdrawals now fund roughly 7 percent of total spending, nearly double their 2019 share, with growth across every income and age group.
This page provides a summary of key insights (3 min read). You can read the full report with additional figures and methodologies here.
Role of retirees: More than one in three top earners 65 and over now draw on investment accounts, up from roughly one in four in 2019, and those flows are now covering about 15 percent of their spending.
The income split: Nearly one in five top earners now tap investment accounts to fund spending on a quarterly basis, compared with roughly one in 25 of those below the median income.
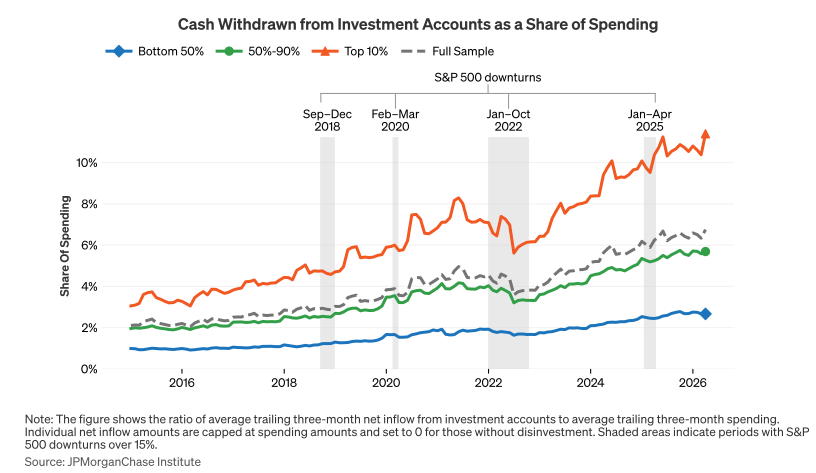
Takeaway: Increasing two-way cash flows—with younger individuals leading growth in investing and older individuals leading growth in tapping those assets—suggest a deepening role for investing in an individual's financial health across the entire lifecycle.
Read the full report to see how age and income patterns are reshaping the link between investing and spending.
Chris Wheat
President, JPMorganChase Institute

George Eckerd
Wealth and Markets Research Director, JPMorganChase Institute

Melissa O’Brien
Research Vice President for Wealth and Markets, JPMorganChase Institute
Media Contact
Shelby Wagenseller, Shelby.Wagenseller@jpmchase.com