
Figure 1: Low-income student loan borrowers are less likely to be overdue today relative to 2019 while high-income borrowers are more likely
Latest news

An Ohio-based company is protecting first responders around the world
With support from JPMorganChase, Fire-Dex is providing protective equipment to firefighters in 100 countries and all 50 states.
Learn moreLatest news

Veteran’s Unconventional Path to Landing her Dream Job in Tech
U.S. Army Veteran Ashley Wigfall transitioned to a civilian role and charted her path to technologist through mentorship and skills training at the JPMorgan Chase tech hub in Plano, Texas.
Learn more
Research
December 9, 2025
As of October 2024, the government began reporting past-due student debt payments to credit bureaus again. The number of officially delinquent borrowers naturally surged as all past-due borrowers were reported at once. But the share of people overdue on their loans did not revert to pre-pandemic levels, they are now higher than pre-pandemic levels. If current trends continue, student loan defaults could soon reach record highs. The Department of Education projects the default rate could climb to as much as 25 percent.1 Some evidence suggests that poor communication between loan servicers and borrowers may be contributing to this rise in overdue payments. Are more borrowers falling behind because of confusion or miscommunication, or are borrowers simply in a weaker financial position than before the pandemic? The Department of Education has also announced plans to resume wage garnishment for borrowers in default, raising questions about how this will affect their financial security.
Our findings show that:
Overall, these findings suggest that the rise in overdue payments above pre-pandemic levels is not due to greater financial hardship. Instead, other factors, such as confusion about repayment, may be playing a role. However, for borrowers who remain in default, wage garnishment could create a significant financial strain.
Key findings
After a pause that began March 2020, student loan payments resumed for most borrowers in October 2023, followed by a one-year on-ramp period before missed payments were reported to credit bureaus. Once the on-ramp ended, delinquency rates jumped, since all borrowers who had fallen behind on payments since October 2022 were reported as past due at the same time. However, the share of overdue (delinquent or in default) borrowers is now slightly higher than before the pandemic2 and expected to rise even more as additional temporary forbearances unwind.3 This may suggest that student debt borrowers are more financially vulnerable than before the pandemic.
However, the period since the start of the pandemic has been a tumultuous time for student loan borrowers, and other factors might be affecting their repayment behavior. Beyond the payment pause itself, many other aspects of debt repayment changed. Many of these changes were later reverted, and new changes continue to be introduced.4 This ongoing uncertainty may create confusion among borrowers as to what they should do and may affect how borrowers prioritize their debt.5 In particular, media has reported that many borrowers are not aware that payments have resumed.6 It is possible that the share of borrowers who cannot afford their payments may be roughly the same as before the pandemic, and these non-financial factors have driven the overdue payment rate above historical levels.
At the same time, the Department of Education has announced that they will resume collections efforts on defaulted debt.7 How might these borrowers adjust their financial behavior to accommodate garnishment? It is hard to draw firm conclusions without understanding why more borrowers are overdue today—are student borrowers more financially strained in 2025, or are they having trouble navigating the post-COVID policy changes? This distinction has significant implications for the dynamics of other debt delinquencies, the macroeconomy, and the effects of any future wage garnishment.
This report attempts to answer these questions. Using de-identified, administrative banking and credit bureau data from 1.1 million households with student debt in 2019 and 1 million in 2025, we find that:
Our first three findings suggest that part of the surge in overdue borrowers above historical levels is driven by factors other than financial hardship, such as administrative difficulties. If it is true that many households have the ability to repay their debts, then the number of overdue borrowers may return to historic levels in the near future, and these borrowers may not be affected by garnishment. However, the number of overdue borrowers will probably surge again with the end of IDR forbearance, and a portion of those borrowers may also be “administrative” delinquencies rather than hardship delinquencies. Additional communication from loan servicers may be highly effective in eliminating these excess delinquencies.
Our fourth finding suggests that wage garnishment will likely exacerbate the financial vulnerability of many households.
These insights can help policymakers and lenders anticipate the broader economic effects of repayment trends and design policies that promote both borrower financial stability and economic resilience.
The increase in overdue payments above historical levels is largely driven by high-income borrowers: the highest earning borrowers are 45 percent more likely to be overdue compared to 2019.
To assess how overdue borrowers today are different than overdue borrowers before the pandemic, we compare the fraction of borrowers who are overdue, by income group, in 2019 to the fraction who are overdue in the 12-month period ending June 2025. Throughout this report, we use these two 12-month periods to measure income and other consumer variables, while delinquency and default status is taken from the last month of each period (December 2019 and June 2025, respectively). To measure spending, we use average spending by the household in the last six months of these time periods. All information on student debt holdings, payments, delinquency, and default is taken from credit bureau records while income and spending come from Chase bank account data.8
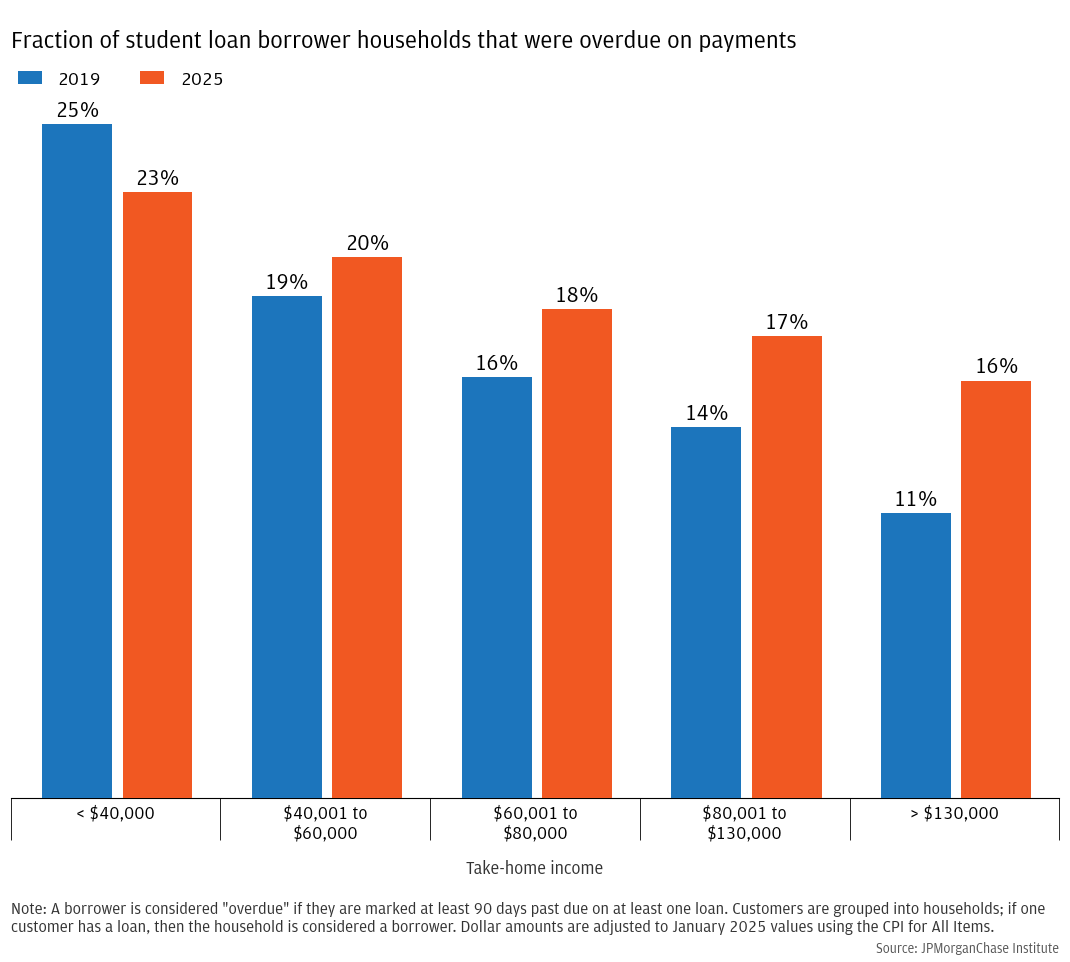
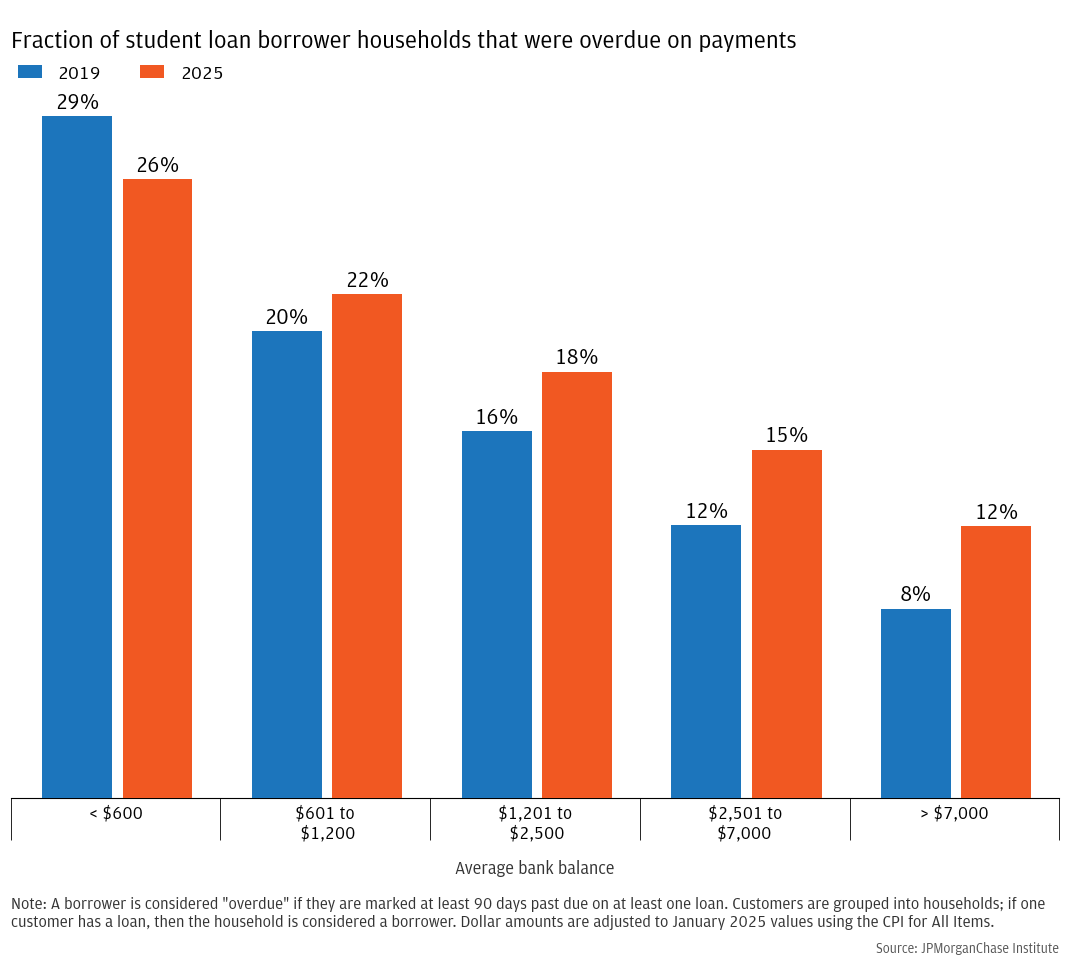
Figure 1 shows that a smaller share of the lowest-income borrowers were overdue in 2025 than in 2019, and a higher share were overdue in all other income groups , with the highest-income borrowers showing the greatest increase . Part of this may be driven by IDR borrowers still being in forbearance due to court action around the Biden administration’s SAVE plan. IDR borrowers tend to have lower incomes, and it is likely that without this forbearance many of these lower-income borrowers would have missed payments by June 2025 along with the rest of the current wave. However, this does not explain why the share of the highest-income borrowers who are overdue has gone up by almost 50 percent, from 10.7 percent in 2019 to 15.6 percent in 2025. Figure 2 shows a similar pattern by bank balances, which comprise a significant portion of households’ liquid wealth.
Figure 1: Low-income student loan borrowers are less likely to be overdue today relative to 2019 while high-income borrowers are more likely
Figure 2: As with income, borrowers with low bank balances are about as likely to be overdue today as in 2019, while borrowers with high bank balances are more likely to be overdue
Is this surge in overdue payments among higher-income borrowers driven by a decrease in their financial security? We look next at financial security directly to answer this question.
Compared to 2019, overdue borrowers today need a smaller share of their discretionary income to make their monthly payments, and they are less likely to be delinquent on other debts.
If borrowers are less financially resilient today than pre-pandemic, that could explain an increase in overdue borrowers. We assess the overall financial resilience of overdue borrowers in several ways.
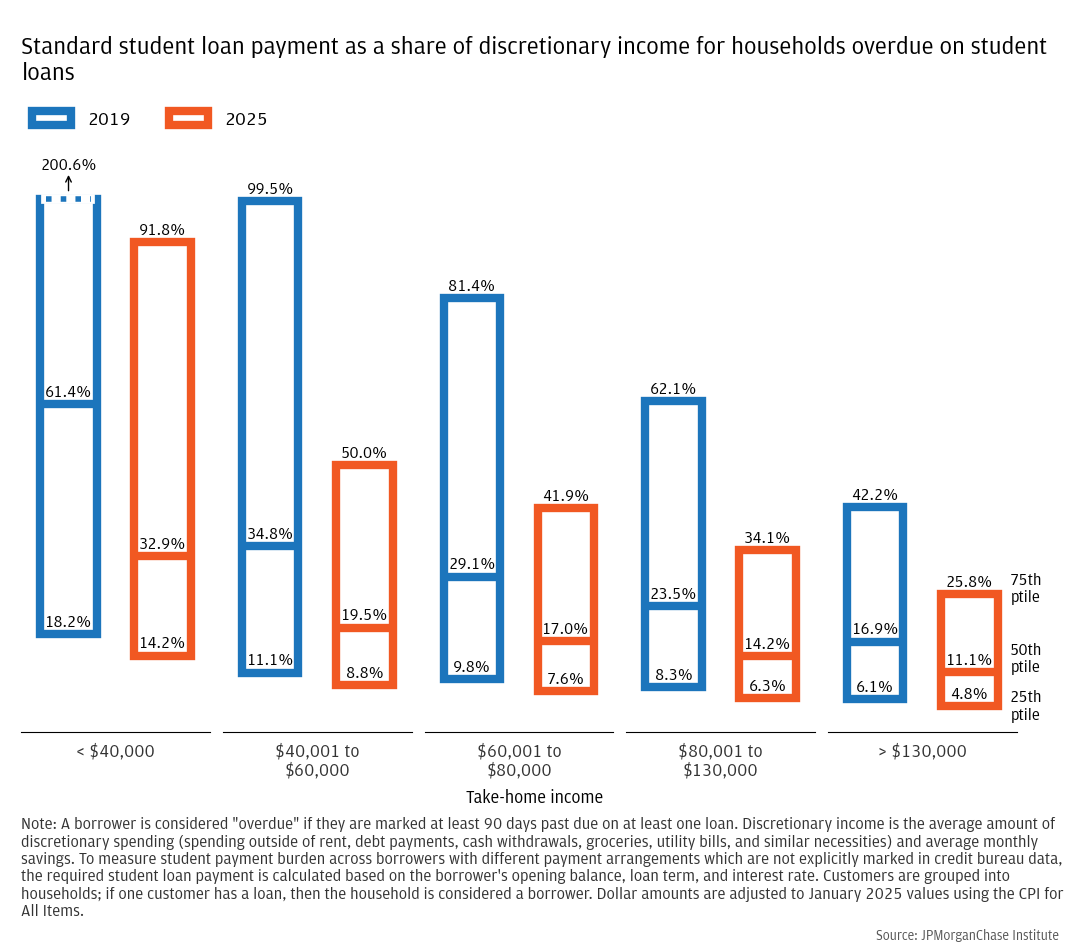
First, we compare borrowers’ monthly student debt payments to their discretionary income, which is the average amount of money each household uses for discretionary spending (expenditures other than rent, debt payments, and necessities like medicine and groceries) and savings. The larger a borrower’s monthly student debt payments are relative to their discretionary income, the more burdensome those payments are likely to be. Figure 3 shows that, among overdue households, student debt payments are less burdensome today than in 2019. To cover their debt payment, the typical low-income household who was overdue needed to spend the equivalent of 61 percent of their discretionary income in 2019 versus 33 percent in 2025. Other income groups also saw marked decreases. Figure A1 shows an alternative metric of burden using only the household’s leisure spending and finds a similar result.
Figure 3: Monthly payments are a lower share of discretionary income in 2025 than in 2019
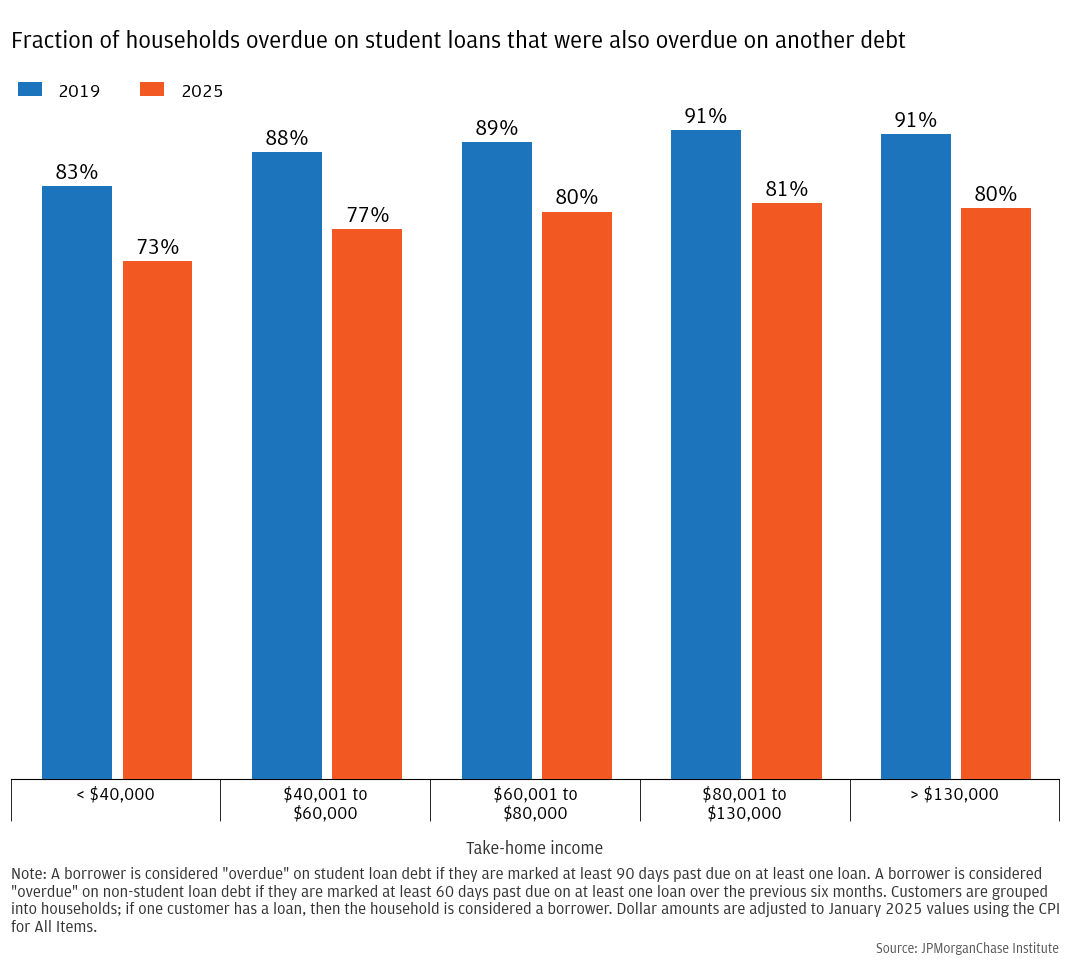
Another way to assess whether the composition of overdue borrowers has changed is to look at missed payments on debts other than student loans such as credit cards, auto loans, or mortgages. A household having trouble paying its student loans is probably having difficulty with other debts as well. If more households that are overdue on student debt are current on their other debts as of 2025, it would suggest that this cohort of overdue borrowers is in a better financial position than past cohorts. Figure 4 shows the share of households in each income bin that were also at least 60 days past due on some debt that is not a student loan in the last 6 months of each sample period. The missed payment rate on non-student debt is high in both years, with rates higher for higher-income borrowers. These higher delinquency rates for higher income households are somewhat counterintuitive and are due to lower-income households holding less debt generally. A household can’t be delinquent on a debt it doesn’t have, and higher-income borrowers are more likely to qualify for and have other debts like credit cards, auto loans, and mortgages. More relevant for our assessment is the fact that non-student debt delinquencies are markedly lower for all income groups. It is much more likely in 2025 for a borrower to be overdue on their student loans, but current on all other debts. This suggests that borrowers are not more vulnerable today than in 2019.
Figure 4: Among overdue student loan holders, delinquency on other types of debt is significantly lower in 2025 than it was in 2019
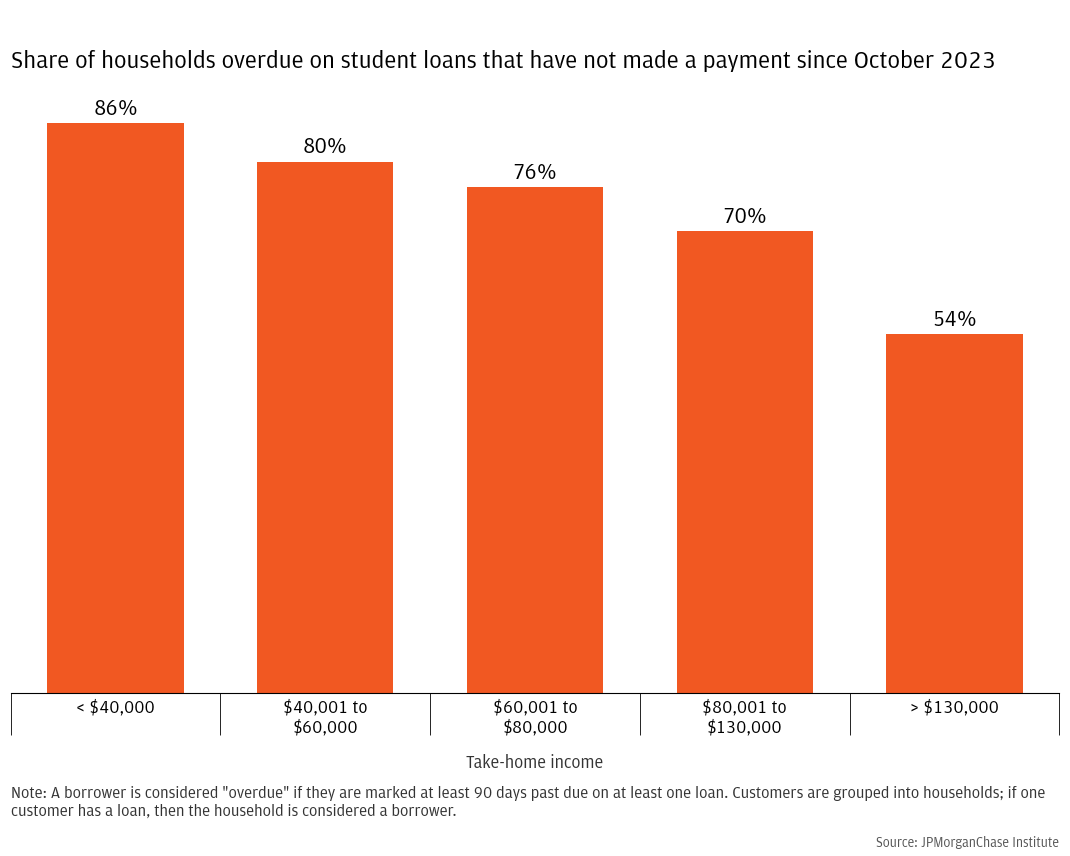
More than 75 percent of overdue households, including 54 percent of the highest-income overdue households, have not made any payments since the COVID pause ended.
Another way to assess whether borrowers might be unaware that payments were supposed to resume is to look at when borrowers last made a payment. If a borrower made some payments after the end of COVID forbearance and then stopped making payments, that would suggest that they knew payments had resumed but were unable to continue making payments due to financial hardship. If most overdue borrowers had resumed making payments at some point after October 2023, it would be much harder to believe a story where current delinquencies are driven by borrowers not knowing that the payment pause ended. Conversely, if most borrowers never resumed making payments, it’s possible—though not necessarily true—that many current delinquencies are caused by insufficient communication between servicers and borrowers.
Figure 5 shows how many overdue borrowers never made payments after the end of the COVID pause in October 2023. Even among the highest-income borrowers who were the most likely to have made a payment since the end of the pause, a majority (54 percent) never resumed payments. The large difference in “never payers” between low- and high-income groups could be driven by differences in financial hardship (low-income households may have more difficulty repaying their loans) or differences in information access or financial literacy.9 While the presence of many high-income “never payers” is far from definitive proof that some borrowers were unaware that the pause ended or forgot to restart their payments, it leaves the possibility open.
Figure 5: A majority of overdue borrowers in every income group has not made any student debt payments since the end of COVID forbearance
If their wages are garnished, the typical overdue borrower would lose about half of their discretionary income, and 8 percent would need to reduce essential spending or debt payments.
Whether recent delinquencies are driven by economic hardship or communication difficulties, borrowers that continue to be delinquent will eventually default on their loans. For federal student loans, default officially occurs once a borrower is 270 days past due. At that point, they may have up to 15 percent of their after-tax wages garnished. Historically, very few defaulted borrowers have had their wages garnished. De Fusco et al. (2024) found that 0.4 percent of workers had their wages garnished for student debt in 2019, which corresponds to roughly 1.5 percent of student debt borrowers.10 In April, the Department of Education (ED) announced it would be resuming garnishment in May; however, the wave of delinquencies that started in October 2024 will not be classified as in default until late 2025 at the earliest. If all borrowers delinquent in mid-2025 default, ED statistics suggest that almost 25 percent of borrowers—roughly 10 million people—will be subject to garnishment.
We assess how burdensome garnishment might be for borrowers in our sample by estimating each overdue household’s garnishment amount (15 percent of take-home payroll income) and comparing it to the borrower’s average monthly budget allocation—savings, leisure spending, non-leisure discretionary spending, and non-discretionary spending.11 We define “leisure” spending as the portion of discretionary spending that goes toward restaurants, entertainment, travel, and miscellaneous non-clothing retail shopping. These categories are likely to be more discretionary than other kinds of discretionary spending and more likely to be delayed indefinitely without significant hardship. For example, clothing spending can sometimes be delayed without significant hardship, but all clothing spending cannot be delayed permanently. So while households have more discretion in their clothing expenditures than with groceries or utility bills, clothing expenditures are still less discretionary than, for example, vacation spending. In our calculation of garnishment cost, we focus on payroll income because it is administratively much harder to garnish self-employment income.
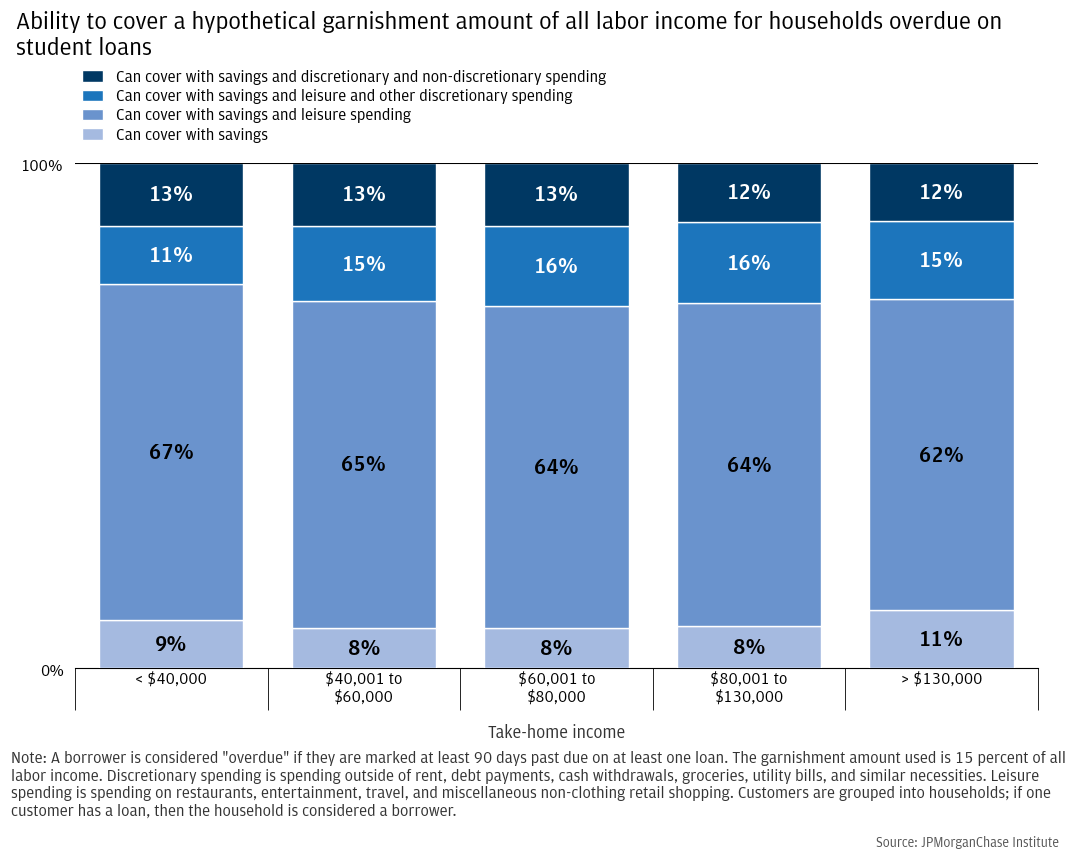
Figure 6 shows how households will have to adjust their budgets to account for the 15 percent drop in take-home payroll income. (Appendix Figure A2 repeats this exercise for all kinds of income, in case some of that income is also subject to garnishment. It shows similar results.) These budgetary adjustments are similar across income groups, likely driven by several factors. First is that garnishment mechanically scales with income because it is a fraction of income. Second is that higher-income households are more likely to take advantage of pre-tax spending and saving programs like 401(k) retirement accounts and employer sponsored health insurance. This makes high-income households’ take-home income appear artificially low in our data and will understate their ability to adjust to garnishment. Third, consumption of many essential goods scales with income—higher-income households buy larger houses and nicer cars and so the share of their budget used on “essential” spending is fairly similar to that of lower-income households (Schanzenbach et al. 2016).
While many borrowers will be able to adjust without significant hardship, a significant portion will have to reduce their non-discretionary spending. This could lead to significant hardship and an increase in non-payment of other bills and debt obligations. Between 14 and 21 percent of households (depending on income group) will not have to adjust their spending at all—the income lost to garnishment is less than or equal to the amount the household adds to its savings every month. Roughly 65 percent of overdue borrowers might be able to reduce their leisure spending enough to leave their other spending untouched. However, 10 to 13 percent of households will have to reallocate all their monthly savings, leisure spending, and at least some of their non-leisure discretionary spending, while 7 to 9 percent will have to reallocate their entire discretionary budget as well as some of their non-discretionary spending, which includes groceries, utility bills, rent, and payments on other debts like auto loans.
Figure 6: Many borrowers will have significant difficulty adjusting to a 15 percent wage garnishment

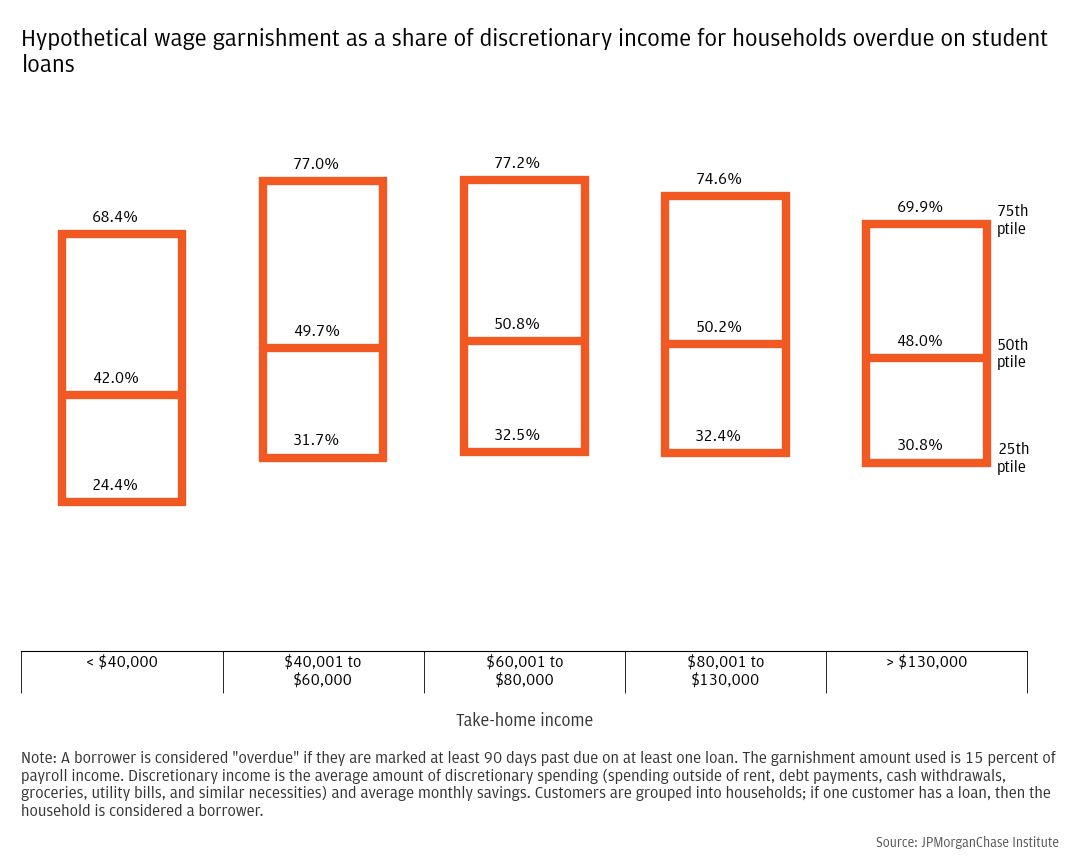
Even those that will not have to decrease their non-discretionary spending will have to make significant adjustments. Figure 7 shows that the typical overdue household in all income groups would need to give up roughly 50 percent of their discretionary income (savings plus discretionary spending) in response to wage garnishment.
Figure 7: Wage garnishment would require significant spending reductions for most overdue borrowers
Overall, our findings suggest the current share of borrowers overdue on their student debt is not higher than it was in 2019 because of increased financial vulnerability among overdue households. We find that, compared to 2019, the share of overdue borrowers has risen most among high-income households, the share of discretionary income households need to cover their monthly payments is lower, and the likelihood that households are delinquent on other debts is lower. At the same time, most borrowers are financially vulnerable, and wage garnishment would require a significant portion of their discretionary income. These two sets of findings have significant implications for the student debt landscape going forward.
Figure A1:
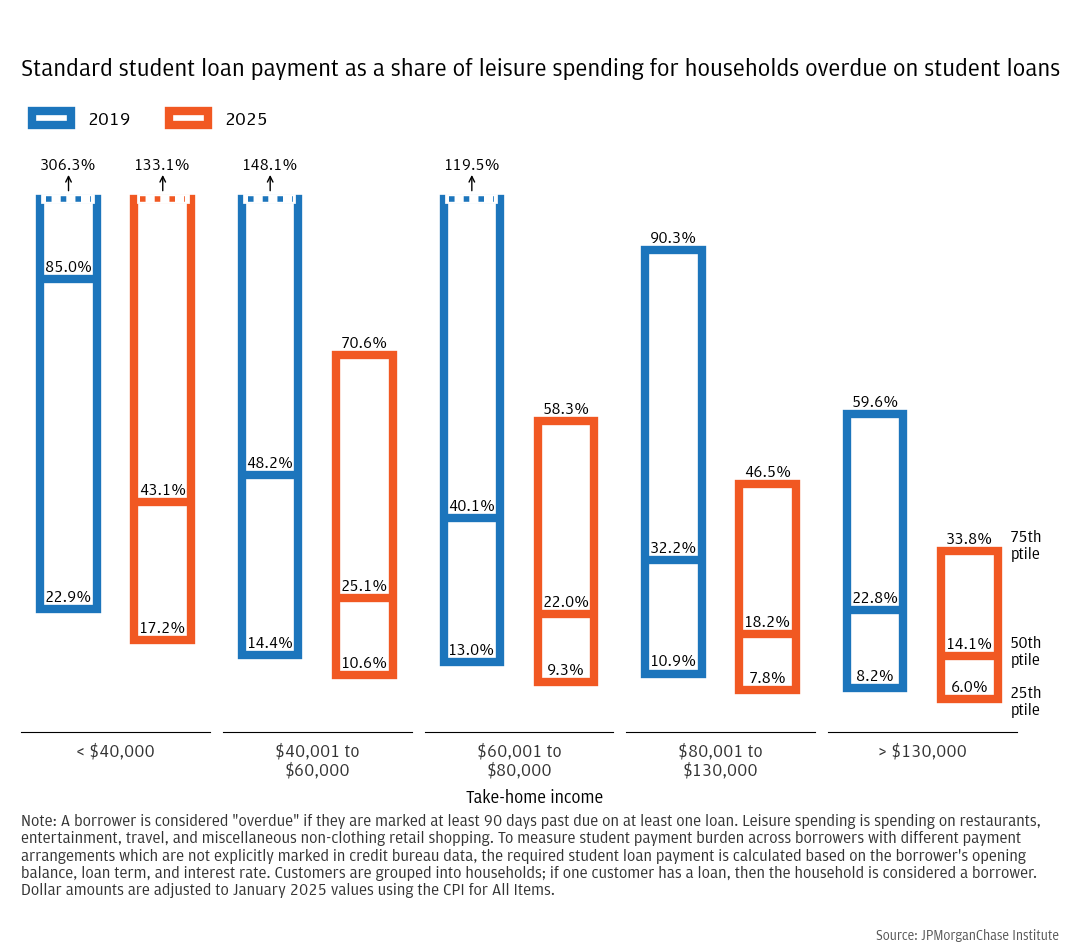
Figure A2:
Caldwell, Isabelle, Thomas Conkling, West Garrett, Christa Gibbs, Cooper Luce, and Michael Murto. 2024. “Insights from the 2023–2024 Student Loan Borrower Survey.” Consumer Financial Protection Bureau Report. https://files.consumerfinance.gov/f/documents/cfpb_Insights-from-the-2023-2024-Student-Loan-Borrower-Survey_Report.pdf
De Fusco, Anthony, Brandon Enriquez, and Maggie Yellen. 2024. “Wage Garnishment in the United States: New Facts from Administrative Payroll Records.” American Economic Review: Insights 6(1): 38–54.
Kaiser, Tim, and Annamaria Lusardi. 2024. “Financial Literacy and Financial Education: An Overview.” NBER Working Paper No. 32355. http://www.nber.org/papers/w32355
Schanzenbach, Diane Whitmore, Ryan Nunn, Lauren Bauer, and Megan Mumford. 2016. “Where Does All the Money Go: Shifts in Household Spending Over the Past 30 Years.” The Hamilton Project, Brookings Institution, Washington DC. https://www.hamiltonproject.org/wp-content/uploads/2023/01/where_does_all_the_money_go.pdf
U.S. Bureau of Labor Statistics. 2020. “The Employment Situation — December 2019 (USDL-20-0034)”. https://www.bls.gov/news.release/archives/empsit_01102020.pdf
U.S. Department of Education, Federal Student Aid. 2019. Portfolio Summary [Data file]. https://studentaid.gov/data-center/student/portfolio
We are thankful to the many people who made essential contributions to this research. We are indebted to our internal partners and colleagues, who support delivery of our agenda in a myriad of ways and acknowledge their contributions to each and all releases.
This material is a product of JPMorganChase Institute and is provided to you solely for general information purposes. Unless otherwise specifically stated, any views or opinions expressed herein are solely those of the authors listed and may differ from the views and opinions expressed by J.P. Morgan Securities LLC (JPMS) Research Department or other departments or divisions of JPMorgan Chase & Co. or its affiliates. This material is not a product of the Research Department of JPMS. Information has been obtained from sources believed to be reliable, but JPMorgan Chase & Co. or its affiliates and/or subsidiaries (collectively J.P. Morgan) do not warrant its completeness or accuracy. Opinions and estimates constitute our judgment as of the date of this material and are subject to change without notice. No representation or warranty should be made with regard to any computations, graphs, tables, diagrams or commentary in this material, which is provided for illustration/reference purposes only. The data relied on for this report are based on past transactions and may not be indicative of future results. J.P. Morgan assumes no duty to update any information in this material in the event that such information changes. The opinion herein should not be construed as an individual recommendation for any particular client and is not intended as advice or recommendations of particular securities, financial instruments, or strategies for a particular client. This material does not constitute a solicitation or offer in any jurisdiction where such a solicitation is unlawful.
Wheat, Chris, Daniel M. Sullivan, and Samantha Anderson. 2025. "Overdue student loans on the rise: Potential causes and implications for wage garnishment." JPMorganChase Institute. https://www.jpmorganchase.com/institute/all-topics/financial-health-wealth-creation/overdue-student-loans-and-wage-garnishment.
Footnotes
Department of Education press release, April 21, 2025.
Roughly 16 percent of all borrowers are in administrative forbearance due to court injunctions on the income-driven repayment plan SAVE. These borrowers tend to have lower incomes.
For example, processing of forgiveness under the Public Service Loan Forgiveness program will resume as of mid-October 2025. See reporting here.
For example, Caldwell et al. (2024) found that in a survey of student loan borrowers, 31 percent said they didn’t know they could choose a repayment plan different from the one they were currently on.
For example, see reporting in the Washington Post and USA Today.
Department of Education press release, April 21, 2025.
We also implement several activity screens on our sample of Chase administrative data to ensure that we observe the full picture of a household’s finances. First, we require that households have an active checking account in all months of the given sample period and conduct at least 5 transactions in every month. Additionally, we require at least $8,000 of non-transfer deposits (ACH, paper check, and cash deposits as opposed to transfers between checking and savings accounts) per year. A “household” is a group of accounts that share joint account relationships, e.g., if Account 1 is owned by Person A, Account 2 is owned by Person B, and Account 3 is jointly owned by Person A and Person B, Person A and Person B are considered a single household, and all of their accounts and debts are grouped jointly.
There are very strong correlations between income, wealth, and financial literacy (Kaiser and Lusardi 2024).
The Bureau of Labor Statistics reported a civilian labor force of 163.1 million workers in December 2019 (BLS 2020). According to the Department of Education, there were 42.9 million student loan recipients in 2019Q4 (ED 2019). These two estimates result in a scalar of 3.8 - the number of labor force participants divided by student loan recipients. This scalar can then be applied to the De Fusco et al. (2024) garnishment rate estimate of 0.4%. An estimated garnishment rate amongst student loan recipients is therefore 0.4% multiplied by 3.8, which is 1.5%.
We only designate a transaction as discretionary or leisure if it can be affirmatively identified as such based on the industry of the merchant. Expenditures that cannot be definitively classified, including cash and paper checks, are classified as non-discretionary.
Authors

Chris Wheat
President, JPMorganChase Institute
Daniel M. Sullivan
Consumer Research Director, JPMorganChase Institute

Samantha Anderson
Consumer Research Associate, JPMorganChase Institute
Media Contact
Shelby Wagenseller,
Shelby.Wagenseller@jpmchase.com