
Figure 1: IDR eligibility under RAP will remain roughly constant at 25 percent of households
Latest news

An Ohio-based company is protecting first responders around the world
With support from JPMorganChase, Fire-Dex is providing protective equipment to firefighters in 100 countries and all 50 states.
Learn moreLatest news

Veteran’s Unconventional Path to Landing her Dream Job in Tech
U.S. Army Veteran Ashley Wigfall transitioned to a civilian role and charted her path to technologist through mentorship and skills training at the JPMorgan Chase tech hub in Plano, Texas.
Learn more
Research
December 9, 2025
The federal student loan system is entering a new phase. In July 2025, the One Big Beautiful Bill Act (OBBB) created a new income-driven repayment (IDR) program called the Repayment Assistance Program (RAP). RAP changes how student loans will be repaid and will become available to borrowers in 2026. By 2028, it will replace all other IDR options. Although RAP could have far-reaching effects on borrowers and the broader student debt loan system, limited data make it difficult to know exactly what those impacts will be. This report, drawing on administrative income and loan balance data, fills a critical gap by providing a much needed initial look at RAP’s potential effects on borrowers and government revenue. We find that:
Key findings
Income-Driven Repayment (IDR) has long been an important resource for student debt borrowers. IDR allows borrowers to decrease their monthly loan payments while their incomes are low, with required payments increasing or decreasing year-to-year with the borrower’s income. This is especially helpful for borrowers who aren’t able to find high-paying jobs right after leaving school when their loans come due. And if the borrower makes enough on-time IDR payments (usually 20 years), any remaining loan balance is forgiven.
While IDR has provided short-term payment relief for many borrowers, the long-term structure of the program has posed some challenges. For example, loan balances increase over time for many borrowers because, under current IDR programs, monthly payments are less than monthly interest charges, so unpaid interest accrues every month. These balances can eventually be forgiven, but most borrowers have to wait 20 years for that relief.
The passage of H.R. 1 (“One Big Beautiful Bill Act”) in July 2025 significantly reformed IDR. It created a new program, the Repayment Assistance Plan (RAP) which will replace most IDR programs going forward. RAP changes how monthly payments are calculated from a borrower’s income, adds monthly subsidies to pay down principal and unpaid interest, and increases the number of on-time payments required to receive forgiveness to 30 years.
This report uses administrative banking data on 1.1 million households to analyze how RAP will change borrowers’ experience in repaying their student debt, as well as how it will change government revenues. Our data, unique in their ability to compare both the loan balances and current incomes of borrowers, show that:
Overall, our results suggest that RAP’s largest effect will be to reduce borrower balances gradually, month-by-month, instead of suddenly when a borrower reaches the 20 or 30 years required for loan forgiveness. Federal government revenue is projected to increase slightly despite the added monthly subsidies because much of the principal and interest that RAP forgives monthly would also have been forgiven under older IDR programs, but at the end of the 20-year repayment term instead of piecemeal every month. It is possible that the payment increases for lower-income borrowers, while small, may nevertheless be unmanageable for the lowest-income borrowers.
Income-driven repayment is currently a collection of different programs which, while details differ by program, lower a borrower’s monthly payments and forgive the remaining loan balance after a set number of on-time payments are made. In all programs, a borrower’s monthly payments are determined by their income. Up to 2023, the two most popular IDR programs were the similarly defined PAYE and REPAYE programs. In 2023, the Biden administration modified REPAYE significantly and renamed it SAVE. With the passage of OBBB, a new program, Repayment Assistance Plan (RAP), will be available starting 2026 and the only option starting 2028. RAP also offers to reduce monthly payments with the promise of balance forgiveness if enough on-time payments are made. However, RAP departs somewhat in how monthly payments are calculated, in how many on-time payments must be made to receive balance forgiveness (30 years instead of 20), and in how unpaid interest is handled. The parameters of these policies are outlined in the table below.
Throughout this report, we will primarily compare the new RAP program to REPAYE rather than SAVE. Even though SAVE is technically the most common IDR program today, SAVE borrowers are still in forbearance and it is unlikely that any borrowers would have made a significant number of payments under SAVE even if RAP had not been implemented.1 Therefore, when assessing how RAP will change household and government finances in the long run, we compare it to behavior under REPAYE, which is the most likely counterfactual IDR program given the legal and political realities faced by SAVE.
Until 2023 (PAYE/REPAYE) | Implemented 2023, Paused 2024 (SAVE) | Option starting 2026; Mandatory 2028 (RAP) | |
Required monthly payment | 10% of disposable income (up to standard 10-year payment amount) | 5% of disposable income | Depends on income: $10 if making <$10k, 1% of income if income is $10-$20k; 2% of $20-30k, etc., up to 10% for income of at least $100k . Minimum of $10 per month. |
Disposable income definition | Gross income less 150 percent of the Federal Poverty Level | Gross income less 225 percent of the Federal Poverty Level | None. |
Maximum repayment period before forgiveness of remaining debt | 20 years for all undergraduate borrowers; 25 years for graduate borrowers under REPAYE. | 10 years for low-balance undergraduate borrowers; 20 years for other undergraduate borrowers; 25 years for graduate borrowers | 30 years. |
Unpaid interest treatment | Generally, unpaid interest accrues to be paid down later or forgiven. Unpaid interest is waived for a short time for certain loans. | Unpaid interest is forgiven every month | Unpaid interest is forgiven every month |
Principal subsidy | None | None | Up to $50. |
Enrollment and recertification | Borrowers must proactively apply for IDR and then recertify their income and household size every year. | Borrowers will be automatically enrolled if they become 75 days delinquent; proactive enrollment will still be required in other cases. Annual recertification will be automatic. | Borrowers choose a standard repayment plan or RAP when they enter their repayment period.
|
Eligibility for IDR will not change significantly: 5 percent of previously eligible borrowers lose IDR eligibility, while a nearly equal number of low- and middle-income borrowers gain eligibility.
Because RAP changes how monthly payments are calculated for IDR enrollees, it is possible that the number of households who would benefit from IDR will change.
Before RAP, IDR enrollment was generally limited to borrowers who would have their monthly payments lowered by enrolling, and monthly IDR payments would never exceed non-IDR payments. RAP does not have this barrier to enrollment and monthly payments are not capped—borrowers are free to enroll in RAP even if it would increase their monthly payments. For our analyses, we assume that a borrower will not enroll in RAP if doing so would raise their monthly payment.2 We will say that borrowers are “eligible” for enrollment as shorthand to mean that the borrower will have their monthly payments lowered by enrollment, even though all borrowers are technically eligible to enroll in RAP.
We use a combination of Chase banking data and credit bureau data to determine whether a household is eligible for IDR.3 Using the income we observe deposited into their bank accounts, we apply the appropriate income calculation to determine the borrower’s monthly payments under IDR. We compare that to the sum of the borrower’s standard amortization payments across all student loans, based on each loan’s term, origination balance, and interest rate.4
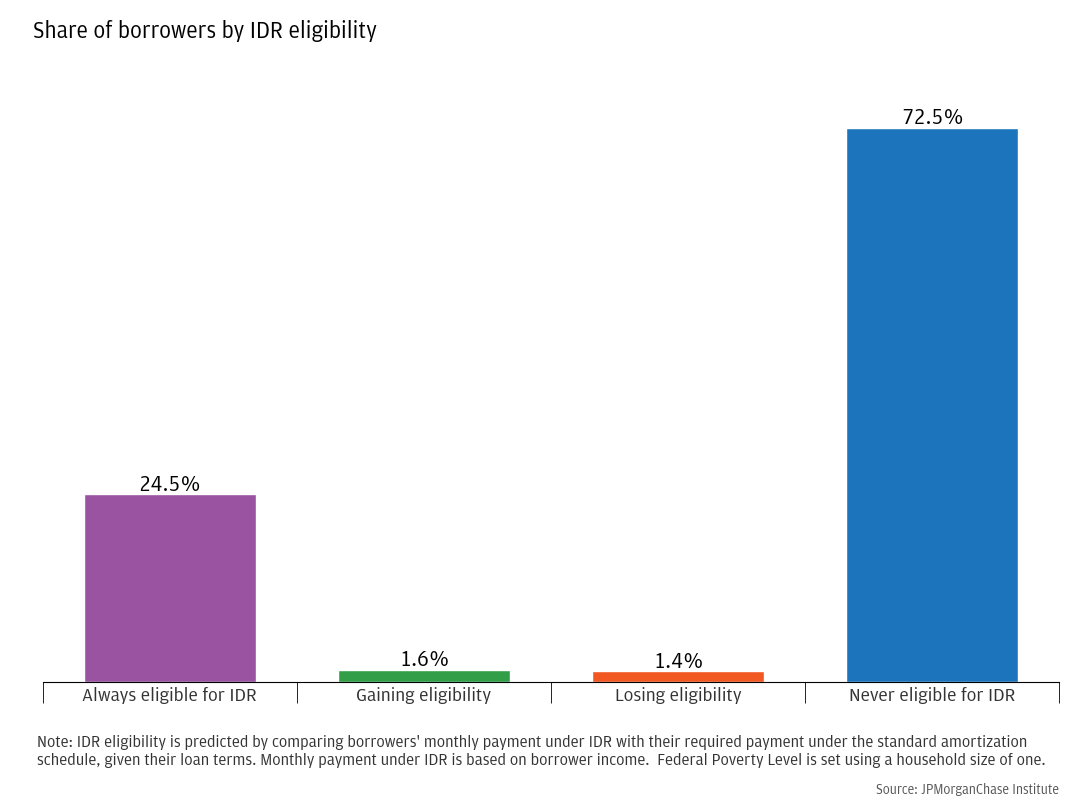
Figure 1 shows that the share of households who are eligible for IDR will not change significantly with the introduction of RAP. Roughly 25 percent of households would be eligible for IDR under both pre- and post-OBBB policies, while 72.5 percent of households with student debt are not eligible under either set of policies. Of the remainder, 1.6 percent of borrowers become eligible for IDR thanks to RAP’s lower monthly payments for middle-income borrowers, while 1.4 percent of households were eligible under older IDR programs but will not have their payments lowered under RAP. Figure A1 replicates this breakdown for debt balances rather than by borrowing households and shows a similar pattern.
Figure 1: IDR eligibility under RAP will remain roughly constant at 25 percent of households
IDR eligibility is determined jointly by a borrower’s income and their standard monthly payment (which depends on how much they originally borrowed). For any income, there is a debt balance that is large enough that borrower would qualify for IDR. Figure 2 illustrates this point by showing the joint relationship of income and monthly loan payments. It shows that low-income/high-balance borrowers (top left of graph) are eligible under both old IDR rules and RAP, while high-income/low-balance borrowers (bottom right of graph) are never eligible. Borrowers on the boundary between these two groups may gain or lose eligibility, depending on their income and balances.
Figure 2: Some low-income/low-balance borrowers will lose IDR eligibility, while some middle-income borrowers will gain eligibility
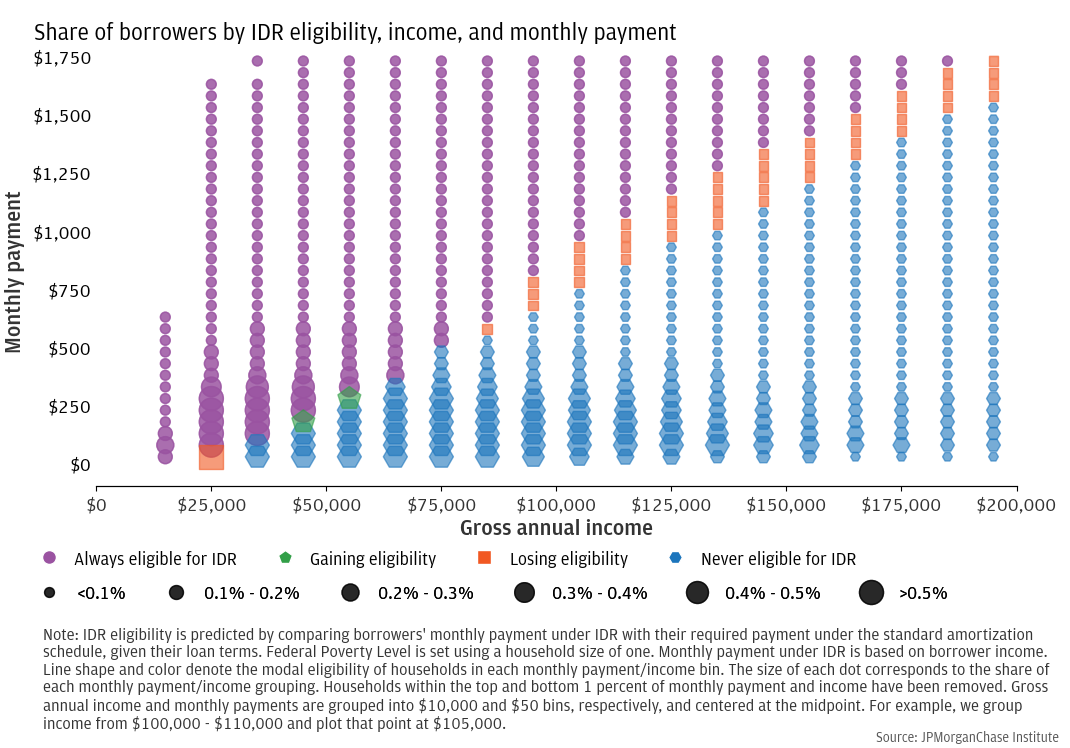
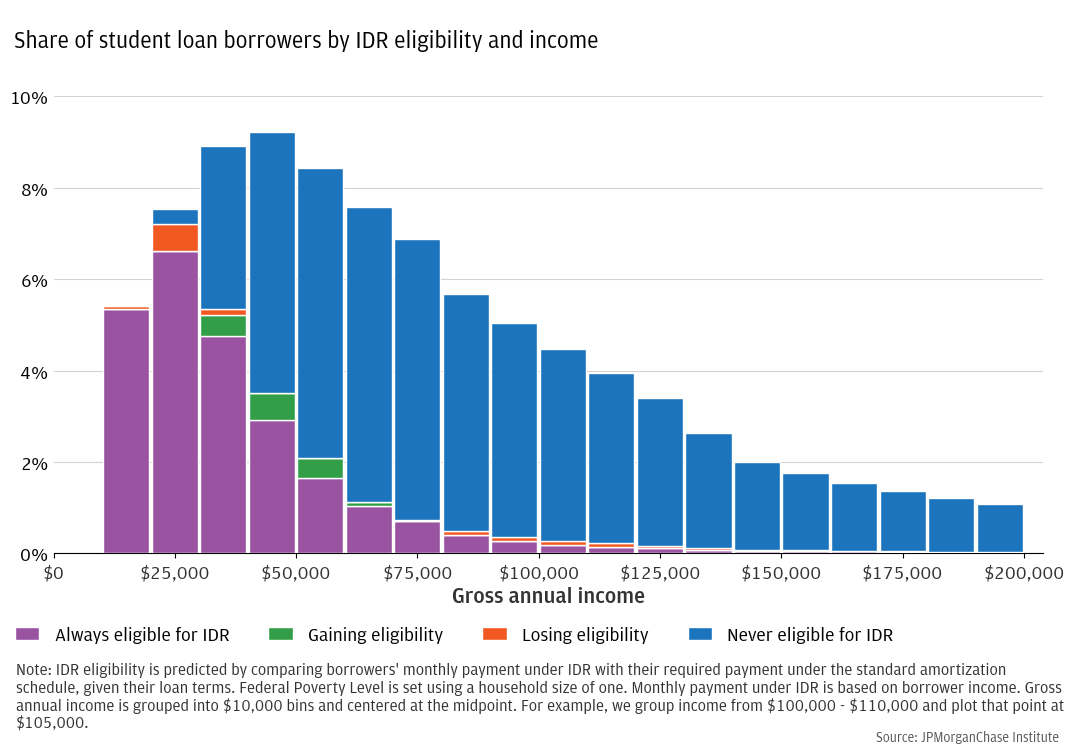
Figure 3 shows eligibility before and after OBBB by income alone. Most borrowers in our lowest income group are “always eligible,” though a few with very low monthly payments will lose eligibility, largely because of the removal of the disposable income deduction from gross income. Unlike prior IDR programs, RAP calculates monthly payments on adjusted gross income with no allowance for essential spending. Borrowers with incomes below 150 percent of the Federal Poverty Level could have $0 monthly payments, which is no longer possible under RAP and its $10 minimum monthly payment.
Figure 3: Most lower-income households will maintain their IDR status, with a small number of low- and high-income households losing eligibility
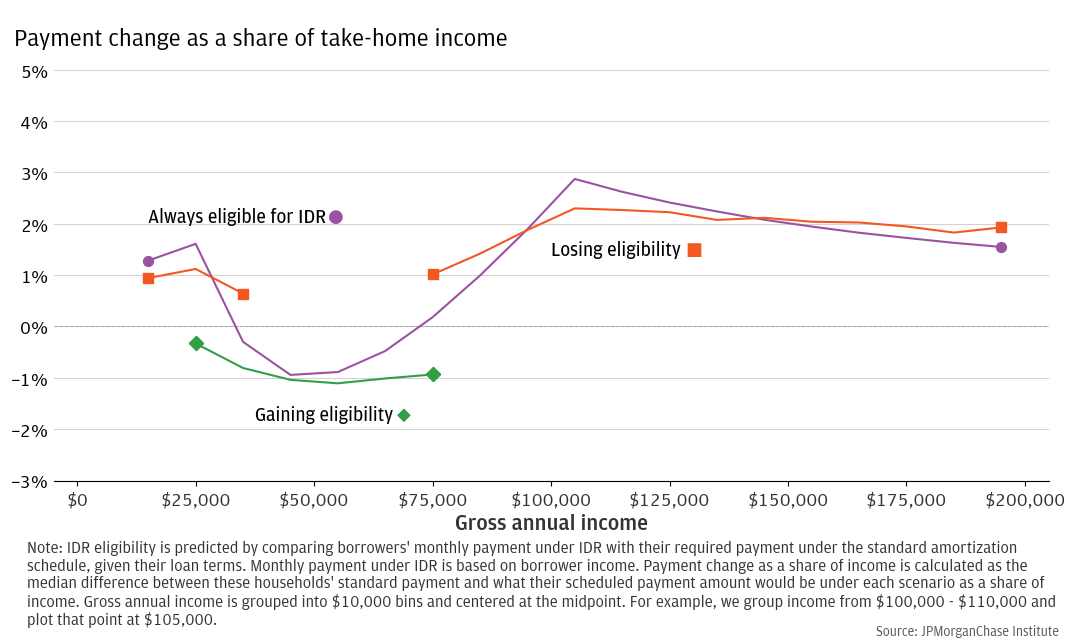
Payments for low- and high-income borrowers will increase by about 2 percent of income, while payments for middle-income borrowers will change by no more than 1 percent of income in either direction.
While overall eligibility for IDR will not change significantly under RAP, borrowers may see their payments change significantly from what they were under prior programs. We calculate the median of total monthly payment changes under RAP by income and present the results in Figure 4.
Changes in monthly payments under RAP vary by income: lower-income borrowers generally face small increases, middle-income borrowers mostly see modest decreases, and higher-income borrowers experience the largest increases. The lowest-income borrowers see their monthly payments increase by roughly 1.5 percent of their income. Low-income borrowers who lose IDR eligibility do not see their payments increase as much because their balances and non-IDR monthly payments are relatively low—if their non-IDR monthly payments were higher, they would still be eligible for IDR. Middle-income borrowers, roughly between $30,000 and $60,000 per year, see their monthly payments go down by as much as 1 percent of income. As a borrower’s income rises, the share of each additional dollar they must put toward their loans increases until their gross income reaches $100,000. Borrowers with $100,000 in income see the largest increases in monthly payments, almost 3 percent of their take-home income. Above $100,000, the share of income that is required to be paid to student loans rate is 10 percent under both REPAYE and RAP, so the increased monthly payment is constant (roughly $200), caused by the removal of the discretionary income deduction. Thus, as income increases, the fraction of income this fixed amount represents to the borrower decreases mechanically.
Figure 4: Households with gross income between $30,000 and $70,000 will generally see their payments go down, while others’ payments will increase by up to 3 percent of take-home income.
These changes in monthly payments are primarily driven by the changes in the share of income that must be paid toward student debt and in how that income is measured. Prior to RAP, all IDR programs based the required monthly payments off a borrower’s “discretionary income,” which the borrower’s total income minus an allowance for basic necessities like groceries. Under REPAYE, this allowance was 150% of the Federal Poverty Level (FPL). If a borrower’s income was less than the FPL, their discretionary income was $0 and their required monthly payment was $0, regardless of what their non-IDR monthly payment was. Under RAP, there is no discretionary income deduction and the monthly payment is based on adjusted gross income (AGI). This uniformly increases in the amount of income that is used in calculating a borrower’s monthly IDR payment, and so, absent any other changes, would increase the monthly payments of all borrowers.
However, RAP also changes what fraction of income is owed toward student debt payments. Under older programs like PAYE and REPAYE, student debt payments for the year equaled 10 percent of disposable income. Under RAP, that amount is 1 percent for borrowers whose income is $10,000 or less, 2 percent for incomes between $10,000 and $20,000, and so on up to 10 percent for incomes $100,000 and above. This lowers the marginal rates for borrowers with income below $100,000, which offsets some or all of the removal of the disposable income deduction.
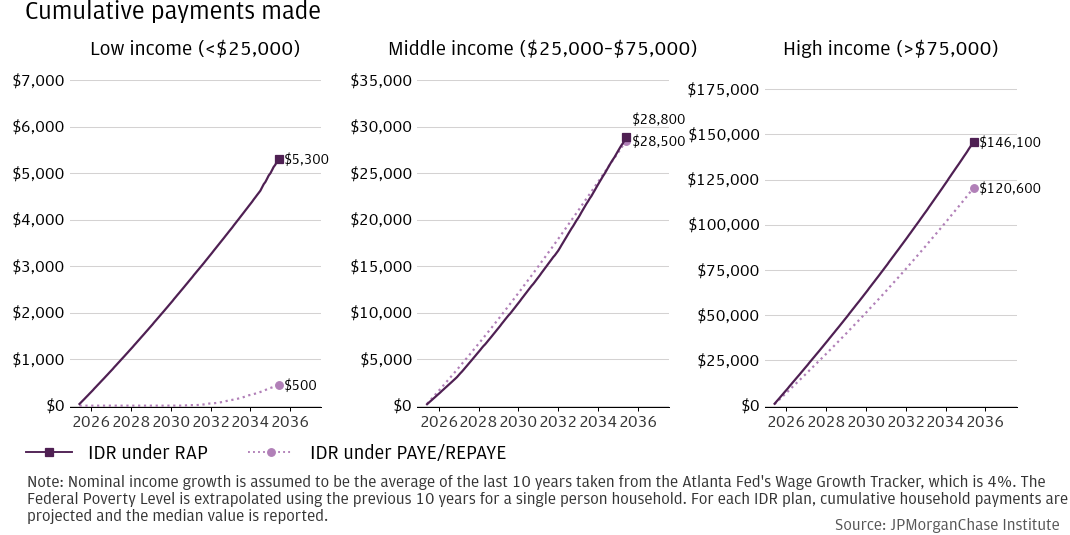
How does RAP affect the total amount of payments borrowers make in the long run? This is of particular interest for lower-income borrowers who will pay more per month and are the most likely to be unable to handle the additional required payments. As borrowers’ income increase over time, their required monthly payments also increase, but payments increase at different rates under RAP and REPAYE. To estimate total long-run payments, we suppose that borrowers will experience 4 percent nominal wage growth per year, which is the average nominal growth found for the last 10 years in the Atlanta Fed Wage Tracker.5 We re-calculate borrowers’ required monthly payments given their increased income and sum the cumulative amount paid toward principal and interest over ten years.
Figure 5 shows hypothetical cumulative payments for low-, middle-, and high-income borrowers that follow from both old (PAYE/REPAYE) rules and RAP. For simplicity of comparison, we restrict this analysis to borrowers who are eligible for IDR before and after the policy change. (Appendix Figure A4 shows total payments for borrowers of all eligibility groups.) Middle-income borrowers have very little change in their overall payments, which are initially lower under RAP but are ultimately higher as their income grows over time. High-income borrowers pay moderately more in every year. Low-income borrowers pay significantly more in every year, largely due to the fact that they have $0 monthly payments until their income rises above the Federal Poverty Level. With 4 percent annual nominal income growth, the median low-income borrower will pay $5,300 over ten years under RAP versus $450 under the prior policy.
Figure 5: Total payments made increase significantly for low-income IDR borrowers, most of whom made $0 monthly payments before RAP
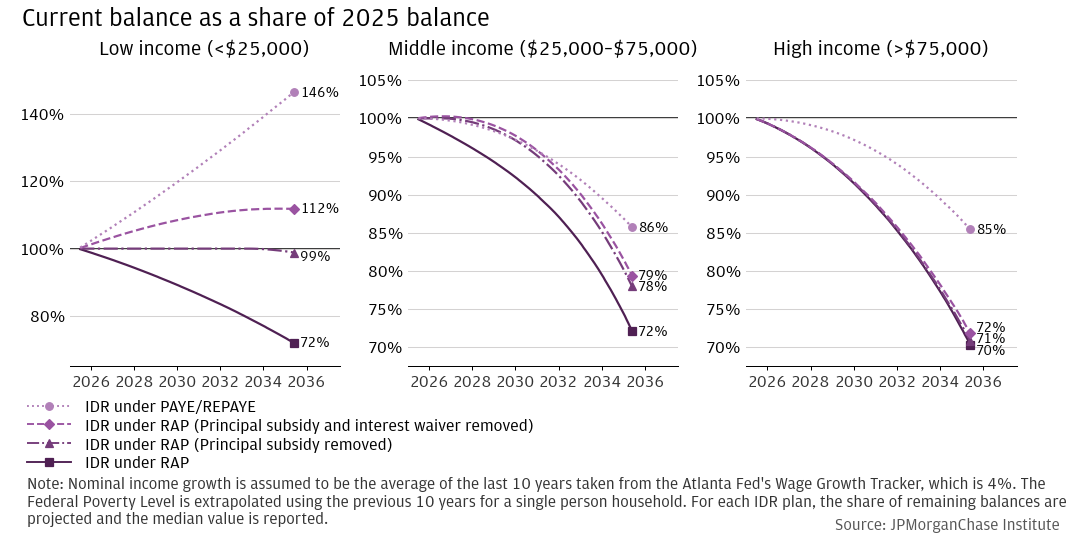
Low-income borrowers’ balances will decrease much faster under RAP, mostly thanks to the interest waiver and balance subsidy: the typical low-income borrower’s balances will decrease by 28 percent after 10 years, versus increasing by 46 percent under pre-2023 policy.
Because most borrowers ultimately pay more toward their loans and RAP introduces principal and interest subsidies not present in REPAYE, we would expect balances to decrease much faster under RAP. Figure 6 shows just that, with balances after 10 years being significantly lower for lower-income borrowers under RAP than under REPAYE.
Are borrowers’ loan balances falling because they’re paying more themselves, or because of the new principal and interest subsidies? Figure 6 also shows hypothetical versions of RAP, one with no principal subsidy and one with no subsidy of any kind. For high-income borrowers, the subsidies make little difference. For low- and middle-income borrowers, roughly half the decrease in balances is due to the principal and interest subsidies. Even with increased monthly payments, low-income borrowers would still not see their balances fall over 10 years without some kind of subsidy.
Figure 6: Even with higher monthly payments, low-income borrowers would still see their balances grow over time without principal or interest subsidies.
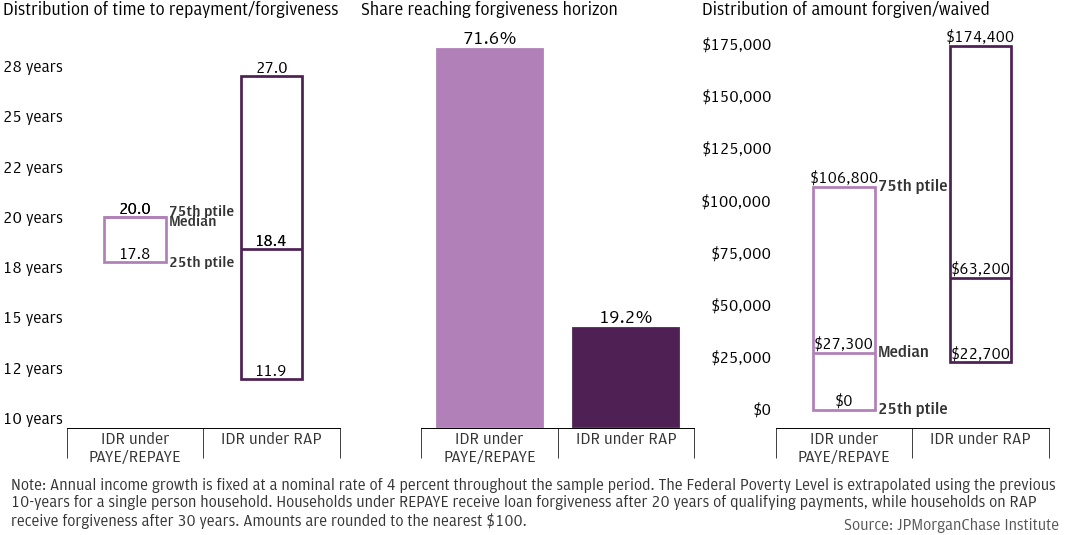
Because balances decrease much faster, most borrowers will close their loans (either pay off or reach forgiveness) more quickly under RAP than previous programs. Figure 8 shows how long borrowers will take to close their loans under the old and new IDR programs, how many households reach the forgiveness limit, and how much forgiveness borrowers receive. Under prior IDR programs (PAYE/REPAYE), 72 percent of borrowers would make payments on their loans for 20 years, the forgiveness limit under those programs, with a few households paying off their loans earlier. Under RAP, the typical household finishes repayment in 18.4 years, with many finishing more quickly. However, many borrowers will be in repayment longer than they would have been before RAP. A quarter of borrowers will be in repayment for at least 27 years, with roughly 19 percent reaching the 30-year limit for forgiveness.
However, despite higher monthly payments, borrowers generally have more debt forgiven under RAP than under prior IDR programs. Under old IDR, many borrowers receive no forgiveness at all—they pay off their loans completely before they reach the 20-year limit. In these cases, IDR is functionally a term extension on their loan. Such borrowers receive no forgiveness and ultimately pay more in interest over the life of the loan. Under RAP, borrowers receive forgiveness incrementally every month if their payments don’t cover interest and reduce their principal by at least $50.
Figure 7: The majority of IDR enrollees close their loans more quickly under RAP, but a significant minority will be in repayment beyond the previous 20-year horizon for loan forgiveness.
Gross revenue to the federal government will be 5 percent higher relative to before the pandemic and could increase by as much as 28 percent if universities repay the new balance and interest.
Because most households end up paying slightly more under RAP, and few new households are made eligible, we would expect total government revenue to increase. Figure 9 projects the total amount of gross revenue, principal and interest, that will be collected by the government under various IDR plans. Using pre-2023 PAYE/REPAYE as a baseline and assuming full take-up by eligible households, we estimate that SAVE would have decreased gross revenue by 25 percent had it been permanently implemented. In contrast, RAP is projected to increase gross revenue by almost 5 percent. Early discussions of RAP included the possibility of recovering some of the principal and interest subsidies from universities based on how many of their students eventually enrolled in IDR.6 Like linking unemployment insurance premiums to how often an employer lays off workers, giving universities a financial penalty when many of their students enroll in IDR would in theory encourage universities to avoid offering programs with low return on investment.7 If we consider a hypothetical version of RAP where the government recovers the full amount of principal and interest subsidies from universities, total gross revenue increases to 28 percent above PAYE/REPAYE levels.
Figure 8: Government revenues will increase slightly under RAP compared to pre-pandemic policy
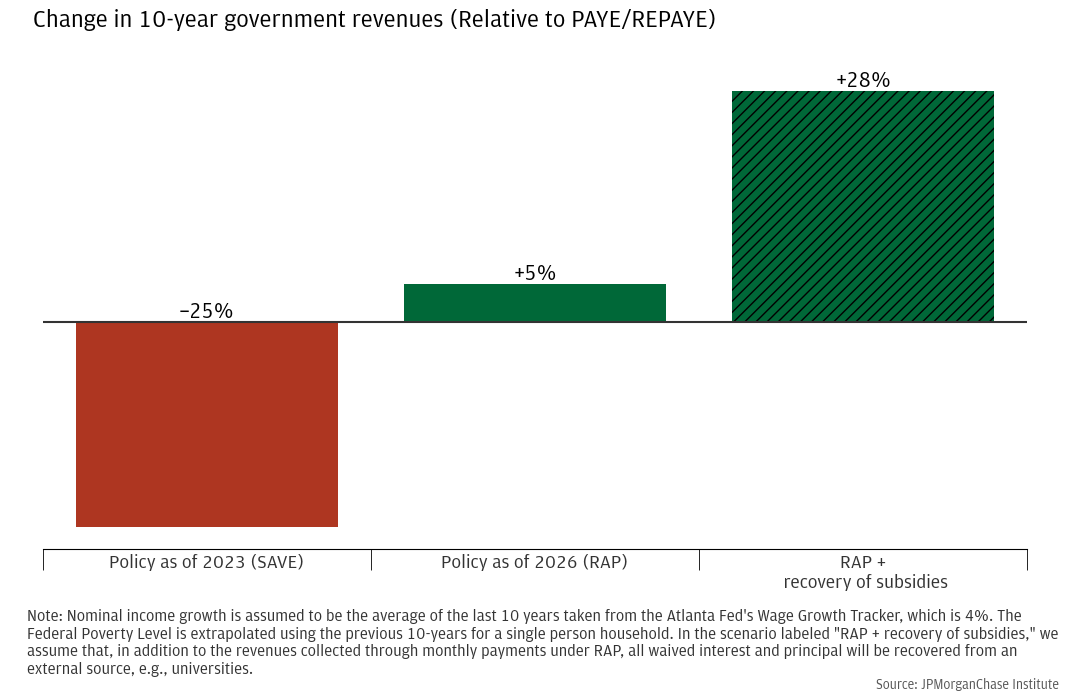
Figure A1:
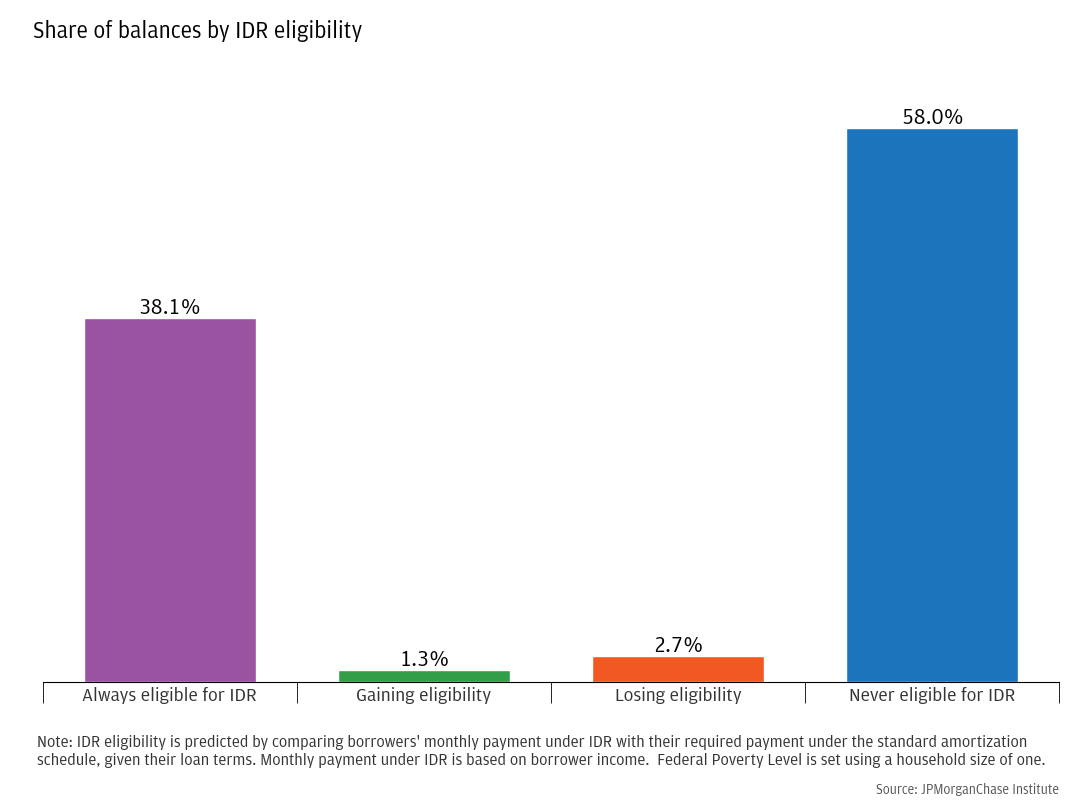
Figure A2:
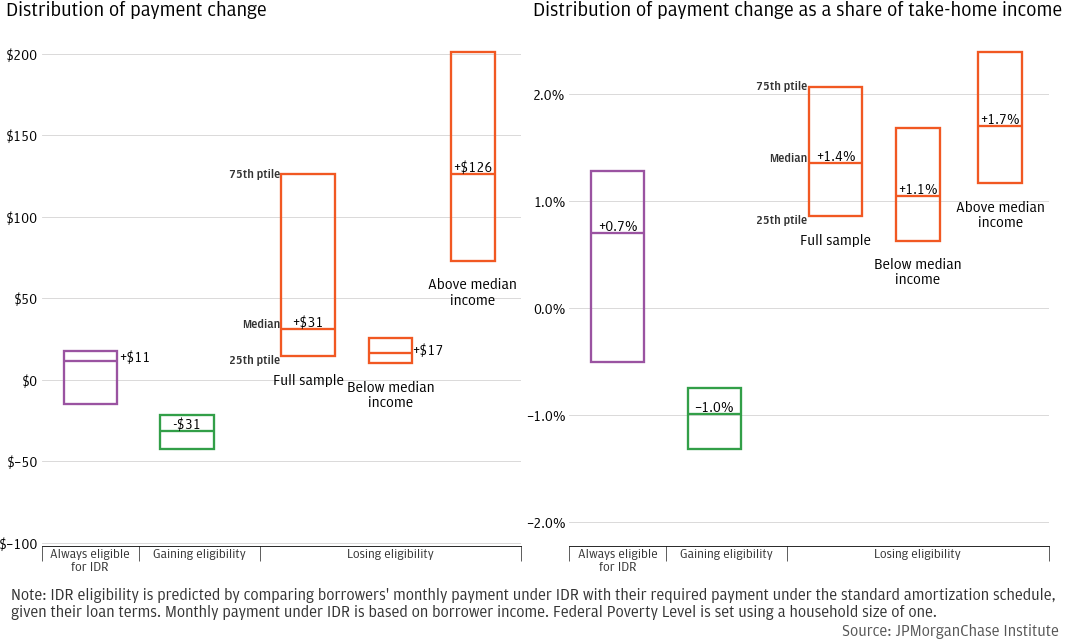
Figure A3:
Figure A4:

Figure A5:
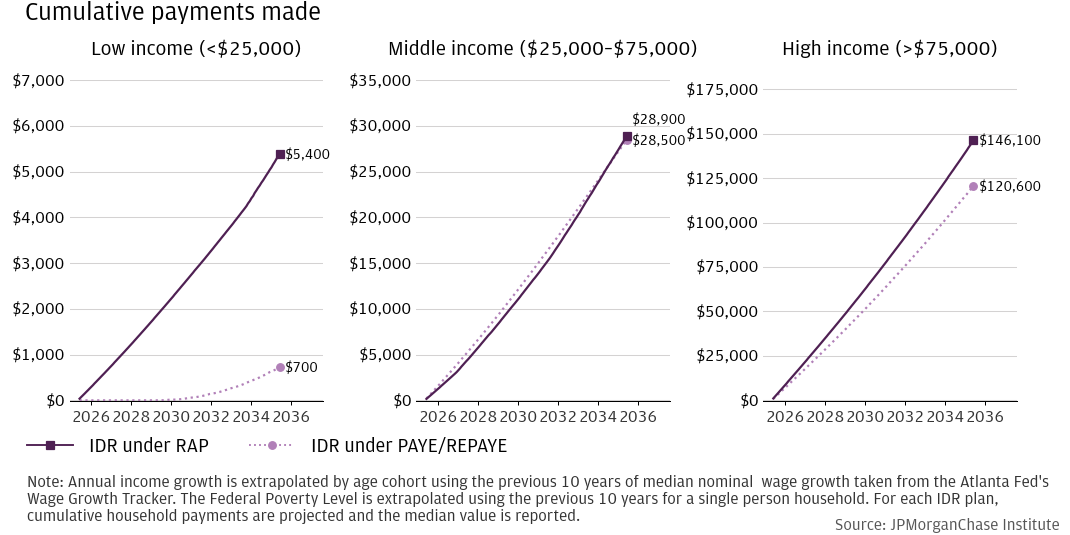
Figure A6:

Emrey-Arras, M., Clark, C. E., and Evans Jr, L. L., 2022. “Student Loans: Education Has Increased Federal Cost Estimates of Direct Loans by Billions Due to Programmatic and Other Changes.” Report to Congressional Requesters. GAO-22-105365. US Government Accountability Office.
We are thankful to the many people who made essential contributions to this research. We are indebted to our internal partners and colleagues, who support delivery of our agenda in a myriad of ways and acknowledge their contributions to each and all releases.
This material is a product of JPMorganChase Institute and is provided to you solely for general information purposes. Unless otherwise specifically stated, any views or opinions expressed herein are solely those of the authors listed and may differ from the views and opinions expressed by J.P. Morgan Securities LLC (JPMS) Research Department or other departments or divisions of JPMorgan Chase & Co. or its affiliates. This material is not a product of the Research Department of JPMS. Information has been obtained from sources believed to be reliable, but JPMorgan Chase & Co. or its affiliates and/or subsidiaries (collectively J.P. Morgan) do not warrant its completeness or accuracy. Opinions and estimates constitute our judgment as of the date of this material and are subject to change without notice. No representation or warranty should be made with regard to any computations, graphs, tables, diagrams or commentary in this material, which is provided for illustration/reference purposes only. The data relied on for this report are based on past transactions and may not be indicative of future results. J.P. Morgan assumes no duty to update any information in this material in the event that such information changes. The opinion herein should not be construed as an individual recommendation for any particular client and is not intended as advice or recommendations of particular securities, financial instruments, or strategies for a particular client. This material does not constitute a solicitation or offer in any jurisdiction where such a solicitation is unlawful.
Wheat, Chris, Daniel M. Sullivan, and Lucas Nathe. 2025. "The new income-driven repayment plan: Student debt outcomes and federal revenue implications." JPMorganChase Institute. https://www.jpmorganchase.com/institute/all-topics/financial-health-wealth-creation/new-income-driven-repayment-plan.
Footnotes
Borrowers began making payments under SAVE with the general resumption of student debt payments in October 2023. However, several states challenged the implementation of SAVE in court, and all borrowers in SAVE were put into forbearance following a court injunction in August 2024, pausing required payments and the accrual of interest. Those borrowers remain in forbearance until there is a change in the legal status of SAVE, they switch to a different currently active IDR plan (with parameters similar to REPAYE), they voluntarily switch to RAP once it becomes active in 2026, or they are forced to switch to RAP in 2028 when all other IDR programs other than IBR end. Furthermore, if RAP had not been introduced it, it is unclear whether SAVE would have ever been fully implemented. See, for example, https://www.cnbc.com/2025/04/26/what-student-loan-forgiveness-opportunities-still-remain-under-trump.html
For IDR plans other than RAP, a borrower’s eligibility for the plan is determined by whether enrolling in the plan lowers the borrower’s monthly payments. Suppose a borrower’s non-IDR monthly payment is $300. If the IDR income formula yields a monthly payment less than $300, the borrower is eligible to enroll. If the income calculation yields a monthly payment higher than $300, the borrower is not eligible to enroll. Once the borrower is enrolled, they may stay enrolled even if their income rises enough that their IDR payment would be higher than their non-IDR payment. For plans other than RAP, the borrower’s payment is capped at their standard payment: if your standard payment was $300 and you enroll in non-RAP IDR, your required payment will never exceed $300. This is not true for RAP. Under RAP, if your income increases enough, you will be required to pay more per month than if you had not enrolled in RAP. As such, there is also no limit on enrollment—borrowers are free to enroll in RAP and bind themselves to larger monthly payments.
We implement several activity screens on our sample of Chase administrative data to ensure that we observe the full picture of a household’s finances. First, we require that households have an active checking account in all months of the given sample period and conduct at least 5 transactions in every month. Additionally, we require at least $8,000 of non-transfer deposits (ACH, paper check, and cash deposits as opposed to transfers between checking and savings accounts) per year. A “household” is a group of accounts that share joint account relationships, e.g., if Account 1 is owned by Person A, Account 2 is owned by Person B, and Account 3 is jointly owned by Person A and Person B, Person A and Person B are considered a single household and all of their accounts and debts are grouped jointly.
We estimate the interest rates for each individual loan using monthly payments made and month to month changes in balances, relying on the fact that balances this month are equal to balances last month plus interest and less payments made.
Data can be found at https://www.atlantafed.org/chcs/wage-growth-tracker. Appendix Figure A5 reports results that assume higher growth for younger borrowers and lower growth for older borrowers. The results are qualitatively the same as reported here.
See, for example, reporting by NPR and Inside Higher Ed.
These incentives could also alter university behavior in many other ways, such as changing the kinds of students they admit.
Authors

Chris Wheat
President, JPMorganChase Institute

Daniel M. Sullivan
Consumer Research Director, JPMorganChase Institute

Lucas Nathe
Consumer Research Associate, JPMorganChase Institute
Media Contact
Shelby Wagenseller,
Shelby.Wagenseller@jpmchase.com