
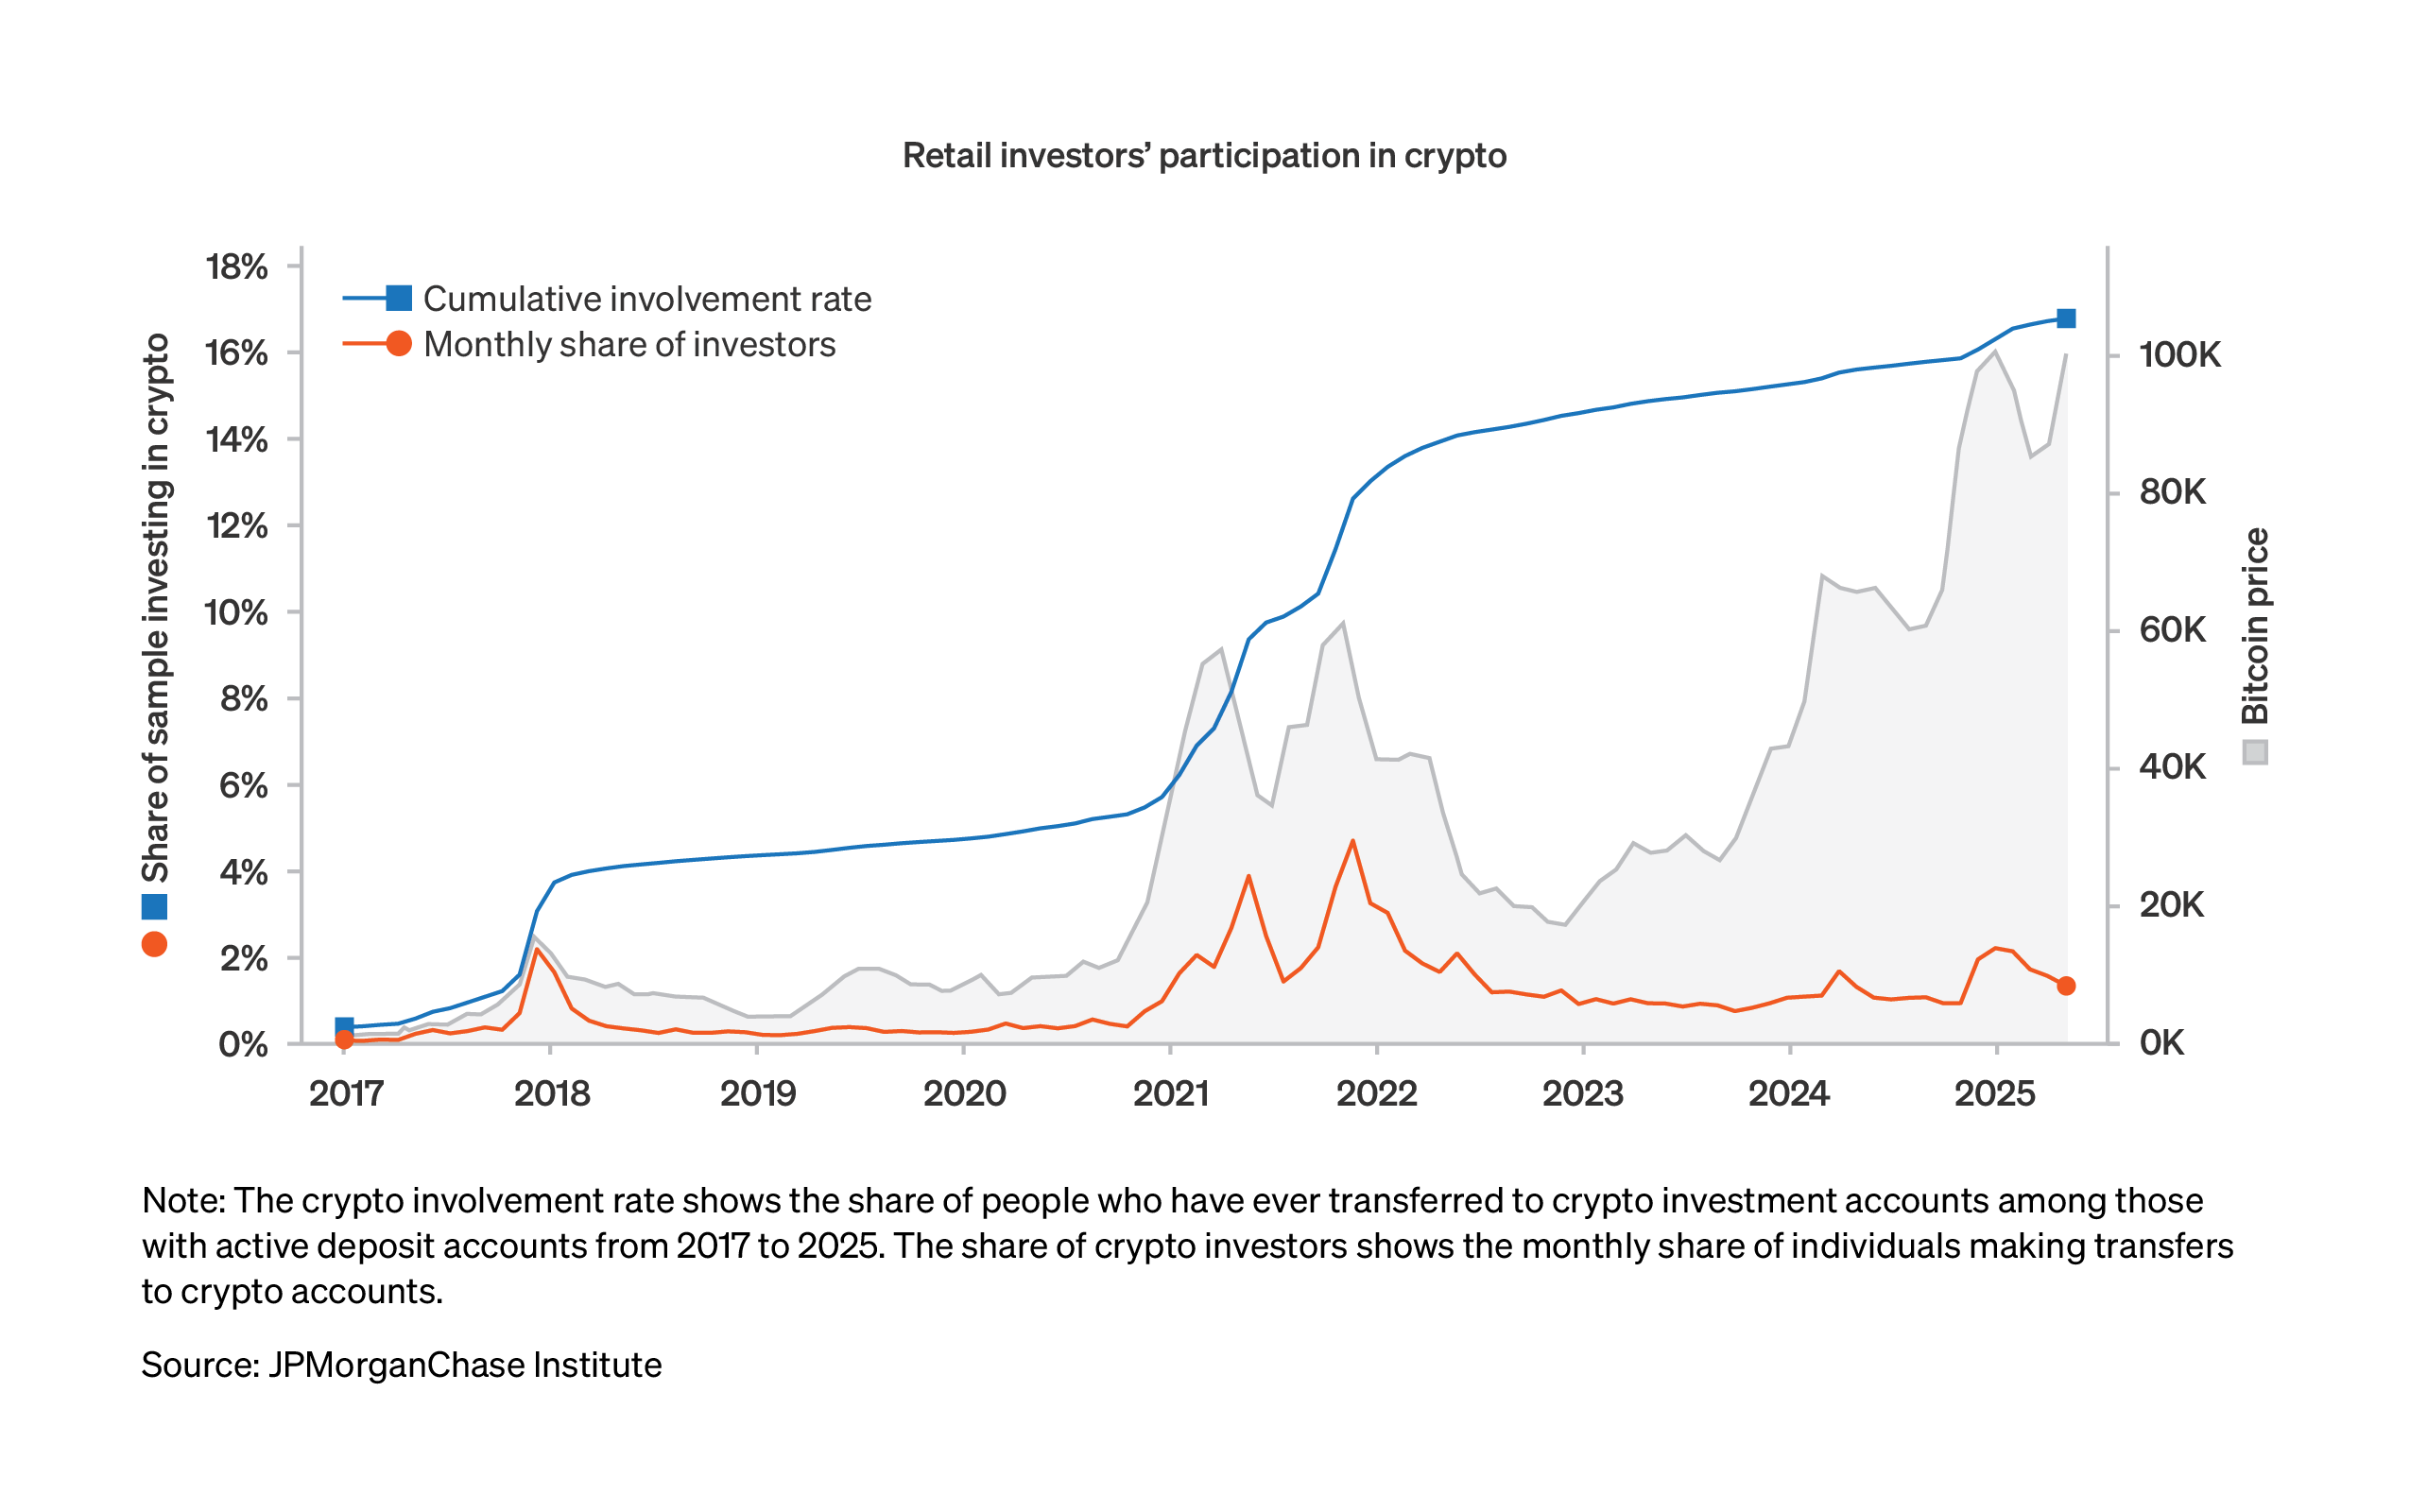
Figure 1: Investment activity in crypto since 2017 has spiked during bitcoin price surges.
Latest news

An Ohio-based company is protecting first responders around the world
With support from JPMorganChase, Fire-Dex is providing protective equipment to firefighters in 100 countries and all 50 states.
Learn moreLatest news

Veteran’s Unconventional Path to Landing her Dream Job in Tech
U.S. Army Veteran Ashley Wigfall transitioned to a civilian role and charted her path to technologist through mentorship and skills training at the JPMorgan Chase tech hub in Plano, Texas.
Learn more
Research
August 27, 2025
Crypto investing continued to spread across the population over the past few years, although adoption slowed aside from modest bursts that align with new all-time highs in the price of bitcoin. A new channel of crypto investing gained traction since early 2024 in the form of cryptocurrency-tracking exchange-traded funds (ETFs). Market involvement has broadened somewhat over time across age, gender, and income groups. Holdings, either direct or via ETFs, remain small for most people. This report offers a window into how U.S. households engage with crypto investments, who is participating, and how behaviors have evolved. As crypto becomes more accessible through traditional financial tools, understanding the demographics investing in crypto and their motivations to participate is essential for shaping policy that protects consumers.
These trends go beyond providing a snapshot of basic investment participation, as they also reveal how financial risk, access to financial assets, and behaviors about investments are concentrated among segments of the population. Our findings are especially relevant for policymakers and businesses today as digital assets move into more regulated financial channels and attract growing interest from institutional players. A clearer view of who is participating, how much is being invested, and key investment channels provides concrete context for the regulation and development of responsible crypto products.
Retail interest in crypto continues to follow movements in the price of bitcoin, but the emergence of regulated cryptocurrency ETFs and a recent slowing adoption of directly held crypto suggest that the market is entering a new phase. This report offers a window into how U.S. households engage with crypto investments, who is participating, and how behaviors have evolved. As crypto becomes more accessible through traditional financial tools, understanding investor demographics and motivations is essential for shaping policy that protects consumers.
We estimate that 17 percent of active Chase checking account users invested in crypto assets from January 2017 to May 2025, with recent upticks around March and November 2024, coinciding with new all-time highs in the price of bitcoin. Since early 2024, investors have made use of quickly growing crypto-tracking ETFs to add cryptocurrency to their portfolios—some of whom had no prior direct holdings through crypto platforms. To capture this new avenue of crypto investing, we supplement the lens on Chase checking account transfers with data covering self-directed investment accounts of JPMorgan Wealth Management.
The population of crypto holders remains concentrated among young men, who are about twice as likely to have such investments as same-aged women—a bigger difference than that observed for traditional investment accounts—although the gender gap in involvement has narrowed over time.1 The median size of direct investments is still relatively small, at less than a week’s worth of income. Among crypto ETF holders, the median allocation is less than 5 percent of total assets. These findings provide new context for policymakers designing a regulatory architecture for this evolving segment of the financial system, and the analysis implies additional scope for tailored investor education.
This analysis uses de-identified data covering 10 million active Chase checking account users. This lens provides direct insight into movements of money into crypto platforms along with demographic information. The data used here do not shed additional light on what happens to funds once they enter the crypto ecosystem. We rely on publicly available indicators of the overall market activity to make inferences about the nature of flows—namely, that bitcoin makes up a substantial share of trading volume and market value.
The report also uses a new perspective on the market using data covering one million retail investor portfolios held through self-directed JPMorgan Wealth Management accounts. This additional information expands our view to cover the growing market for crypto-related ETFs that followed an early 2024 rule change allowing the listing and trading of new products tracking certain cryptocurrencies.2
Households tend to move money into crypto accounts during periods of substantial increases in the price of bitcoin. The number of first-time investors is still positive outside of these episodes, but the pace of adoption is more gradual. Figure 1 shows the evolution in the participation rate over time. In a sample of individuals with active checking accounts over 2017−2025, the total share of individuals that ever transferred funds to crypto accounts was approximately 17 percent as of early 2025. This represents an increase of 2 percentage points since the start of 2024. The recent pace of expanding user base has been slow relative to the rapid adoption seen during the pandemic savings boom, 2020−2021.
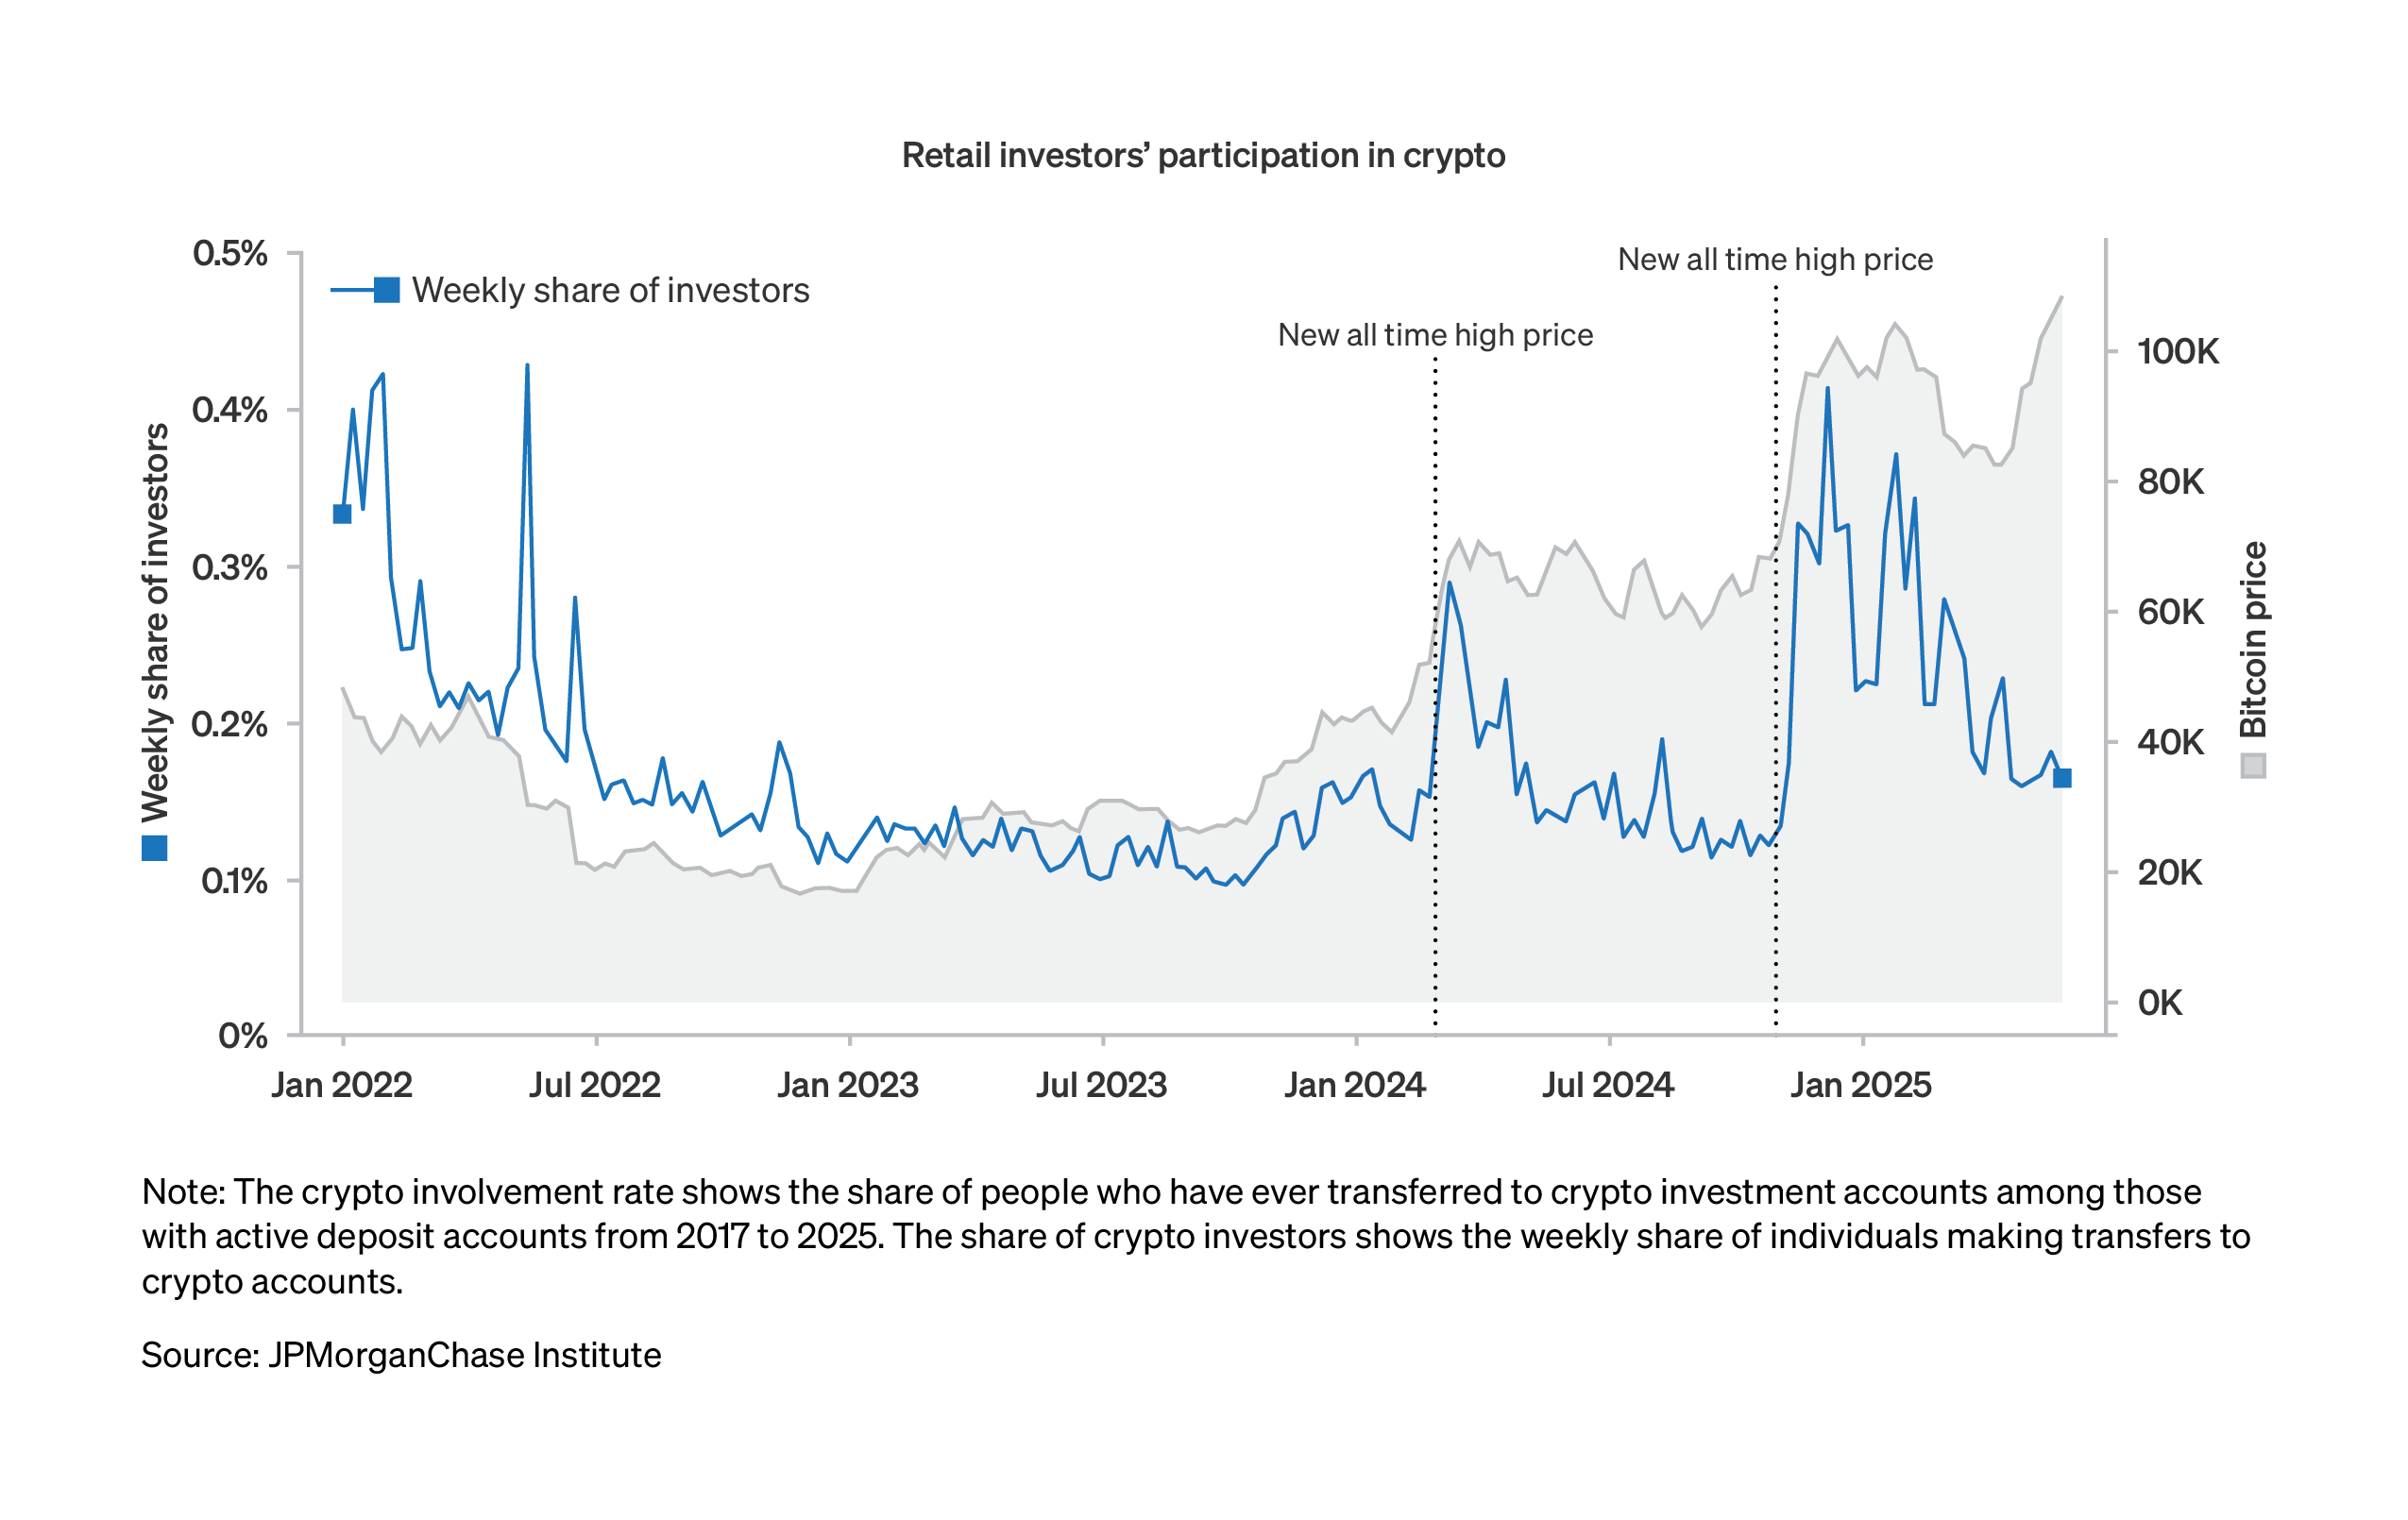
Figure 2 zooms into the past few years, showing the weekly share of individuals moving money to crypto accounts along with the price of bitcoin. Significant declines in the price of bitcoin in 2022 coincided with a slowdown in the expansion of the investor base that lasted through 2023. After several months of increases, bitcoin prices hit new all-time highs in March 2024, which coincided with a spike in flows into crypto accounts to their highest level since early 2022. In November 2024, bitcoin prices reached even higher levels, coinciding with a surge in flows into crypto accounts. While bitcoin prices reached new all-time highs around this time, the number of individuals moving money into crypto accounts was substantially smaller than its 2021 peak. The latest rise in bitcoin to yet new highs, as of May 2025, was not associated with a significant uptick in the number of investors adding money to crypto accounts.
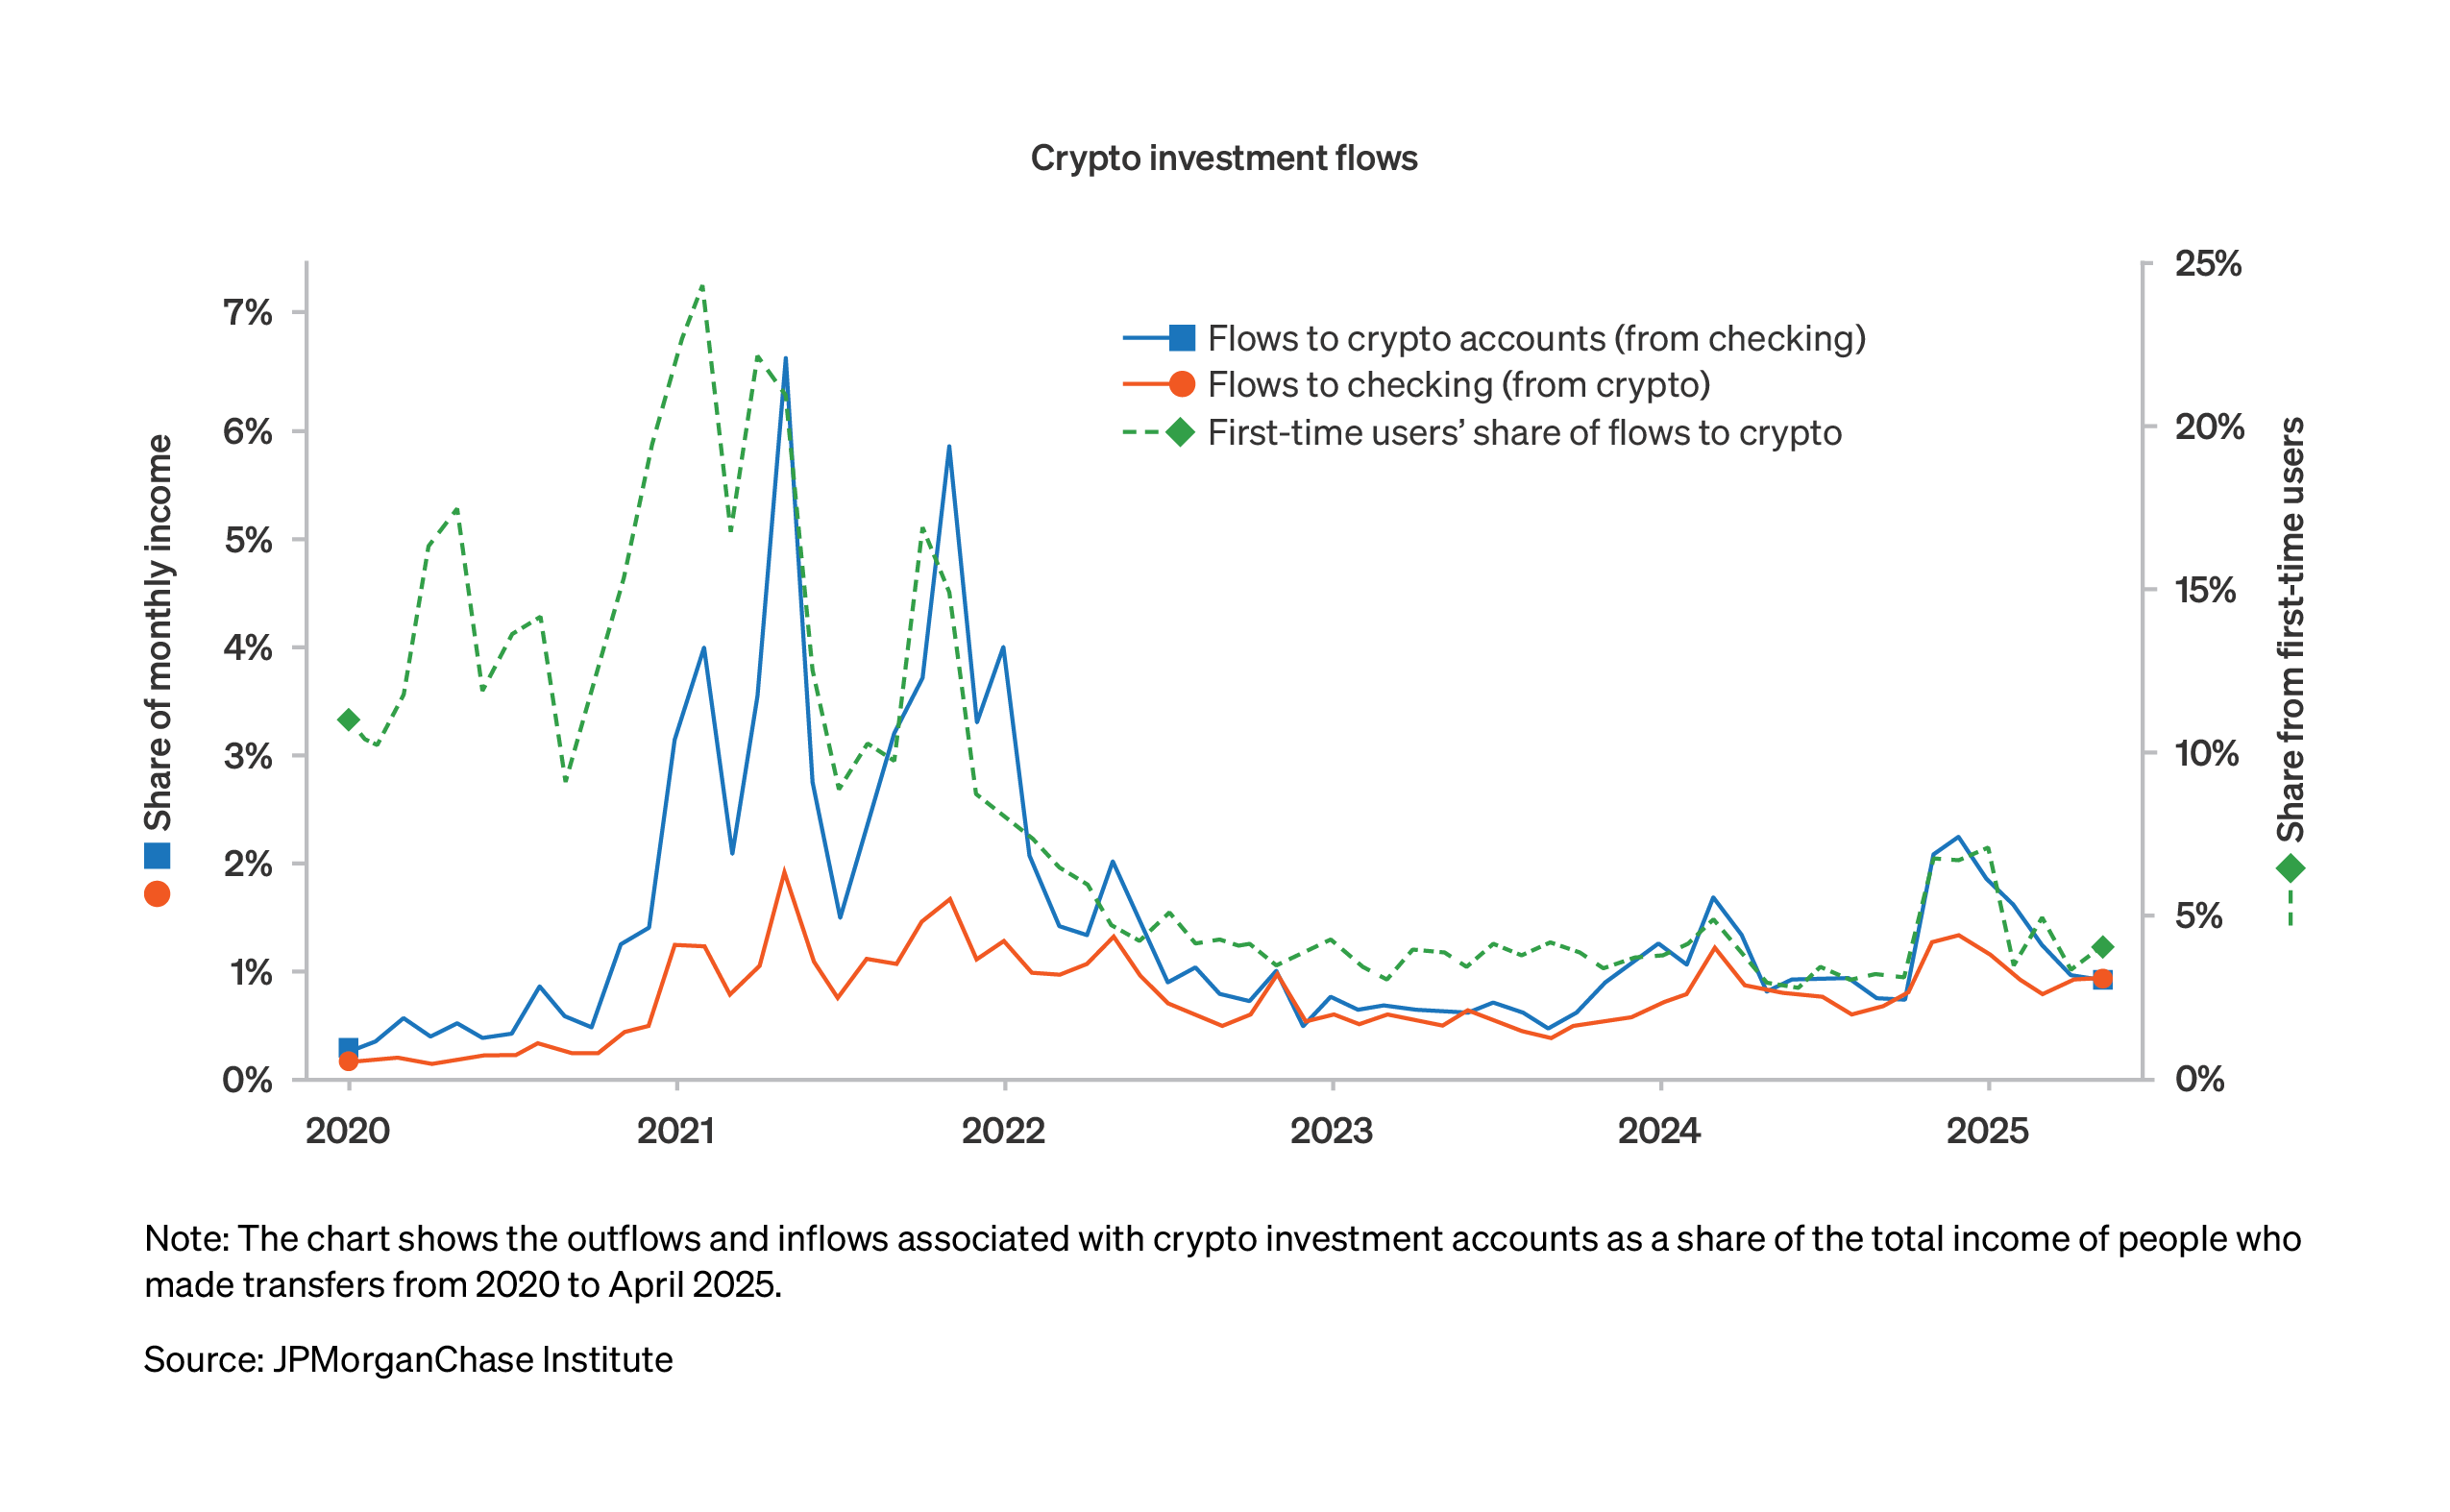
As shown in Figure 3, first-time crypto users have made a relatively small share of the number of people transferring funds to crypto accounts since the 2021 peak in adoption. U.S. households’ flows between checking accounts and the crypto ecosystem became more balanced during the 2022−2023 period of relatively low bitcoin prices: net acquisition of crypto was minimal over this period, prior to the runup in bitcoin prices beginning in late 2023.
Crypto assets have gained widespread attention, but actual participation remains highly uneven across age, gender, and income. Gaps have shrunk over time, but crypto investing continues to be dominated by young men and higher-income individuals. These demographic patterns raise important questions about financial engagement and risk, as well as who stands to benefit from the continued growth of digital financial markets.
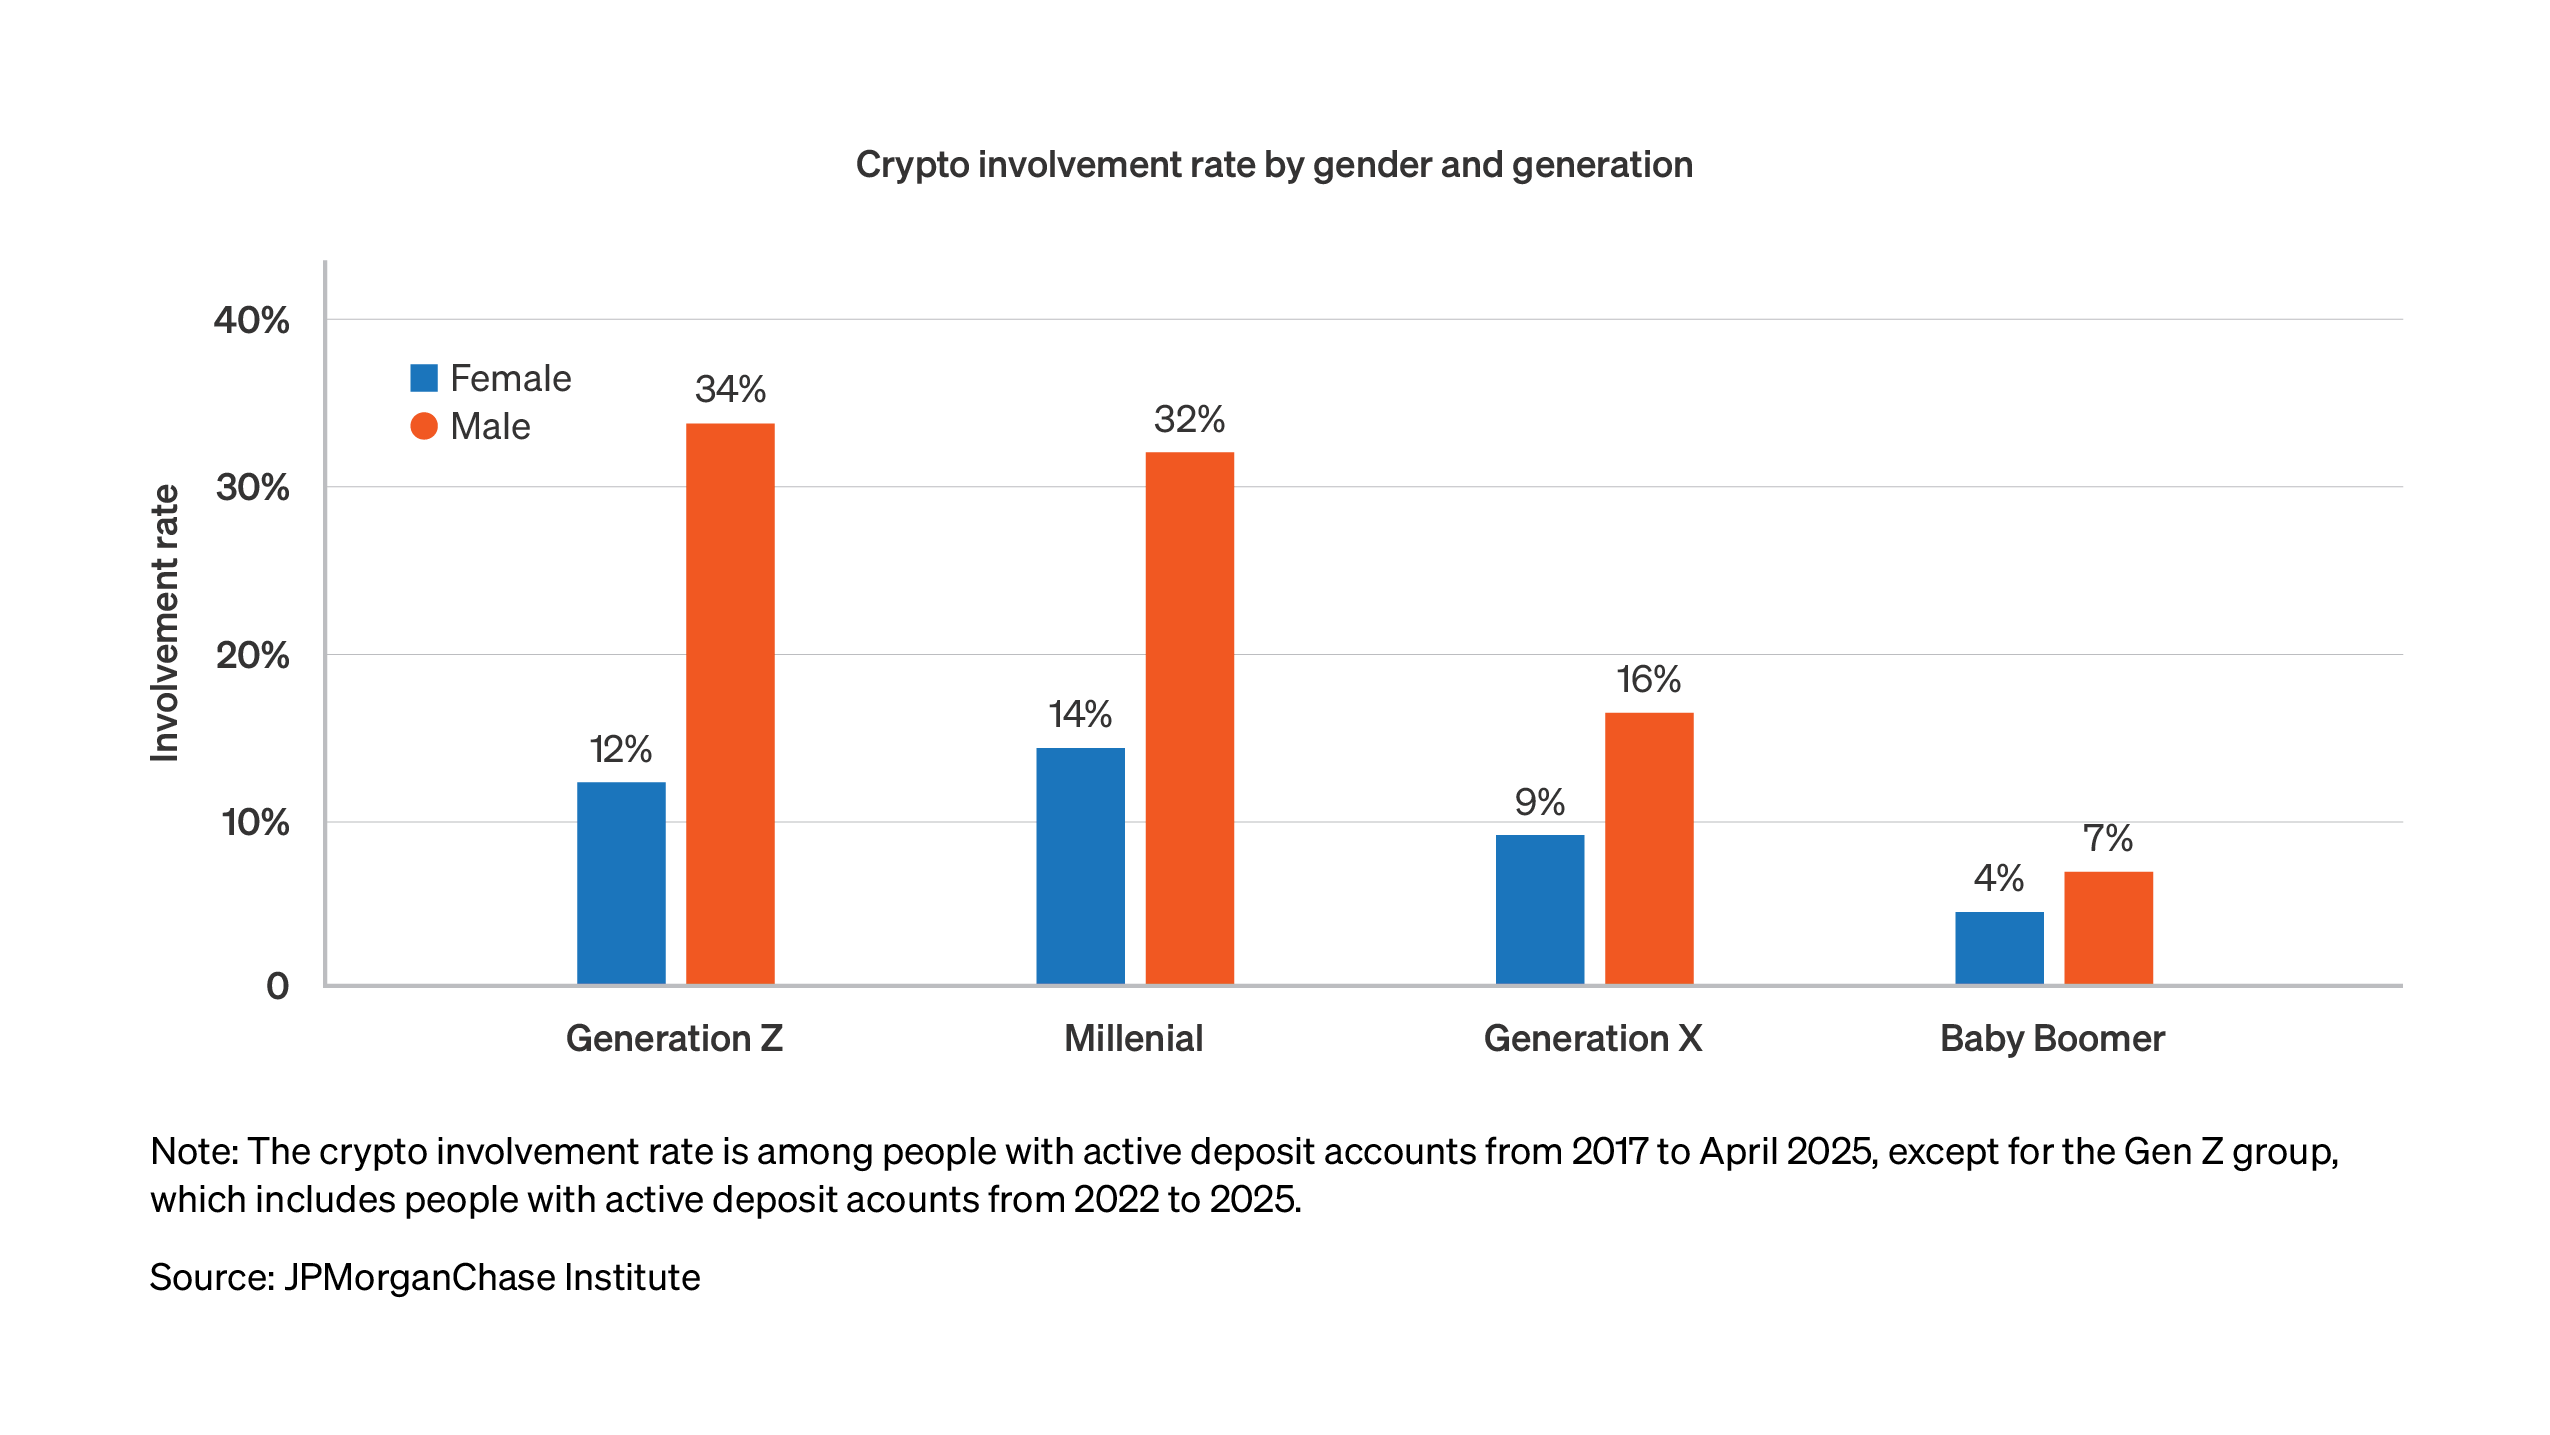
Figure 4 shows crypto account holdings as a share of active checking account users broken out by age groups and gender. Crypto usage is much more prominent among younger individuals—over 20 percent for Gen Z and millennials, 13 percent for Gen X, and 6 percent for baby boomers. Across all age groups, men are about two times as likely to have crypto accounts relative to women. The younger generations show a somewhat larger gender gap in involvement: for Gen Z and millennials the ratio is about three-to-one; and Gen X and baby boomers have less than a two-to-one ratio of men-to-women.
Use of crypto accounts is more prevalent among higher-income individuals, paralleling the pattern seen for traditional investment brokerage accounts. Figure 5 shows the share of our sample with transfers to crypto accounts compared with the use of traditional accounts funded out of take-home pay.3 Across the income distribution, crypto participation rates are about half those of conventional investments. From the bottom-to-top income quintiles participation rates range from 7 percent to 24 percent for crypto accounts and 14 percent to 55 percent for traditional accounts.
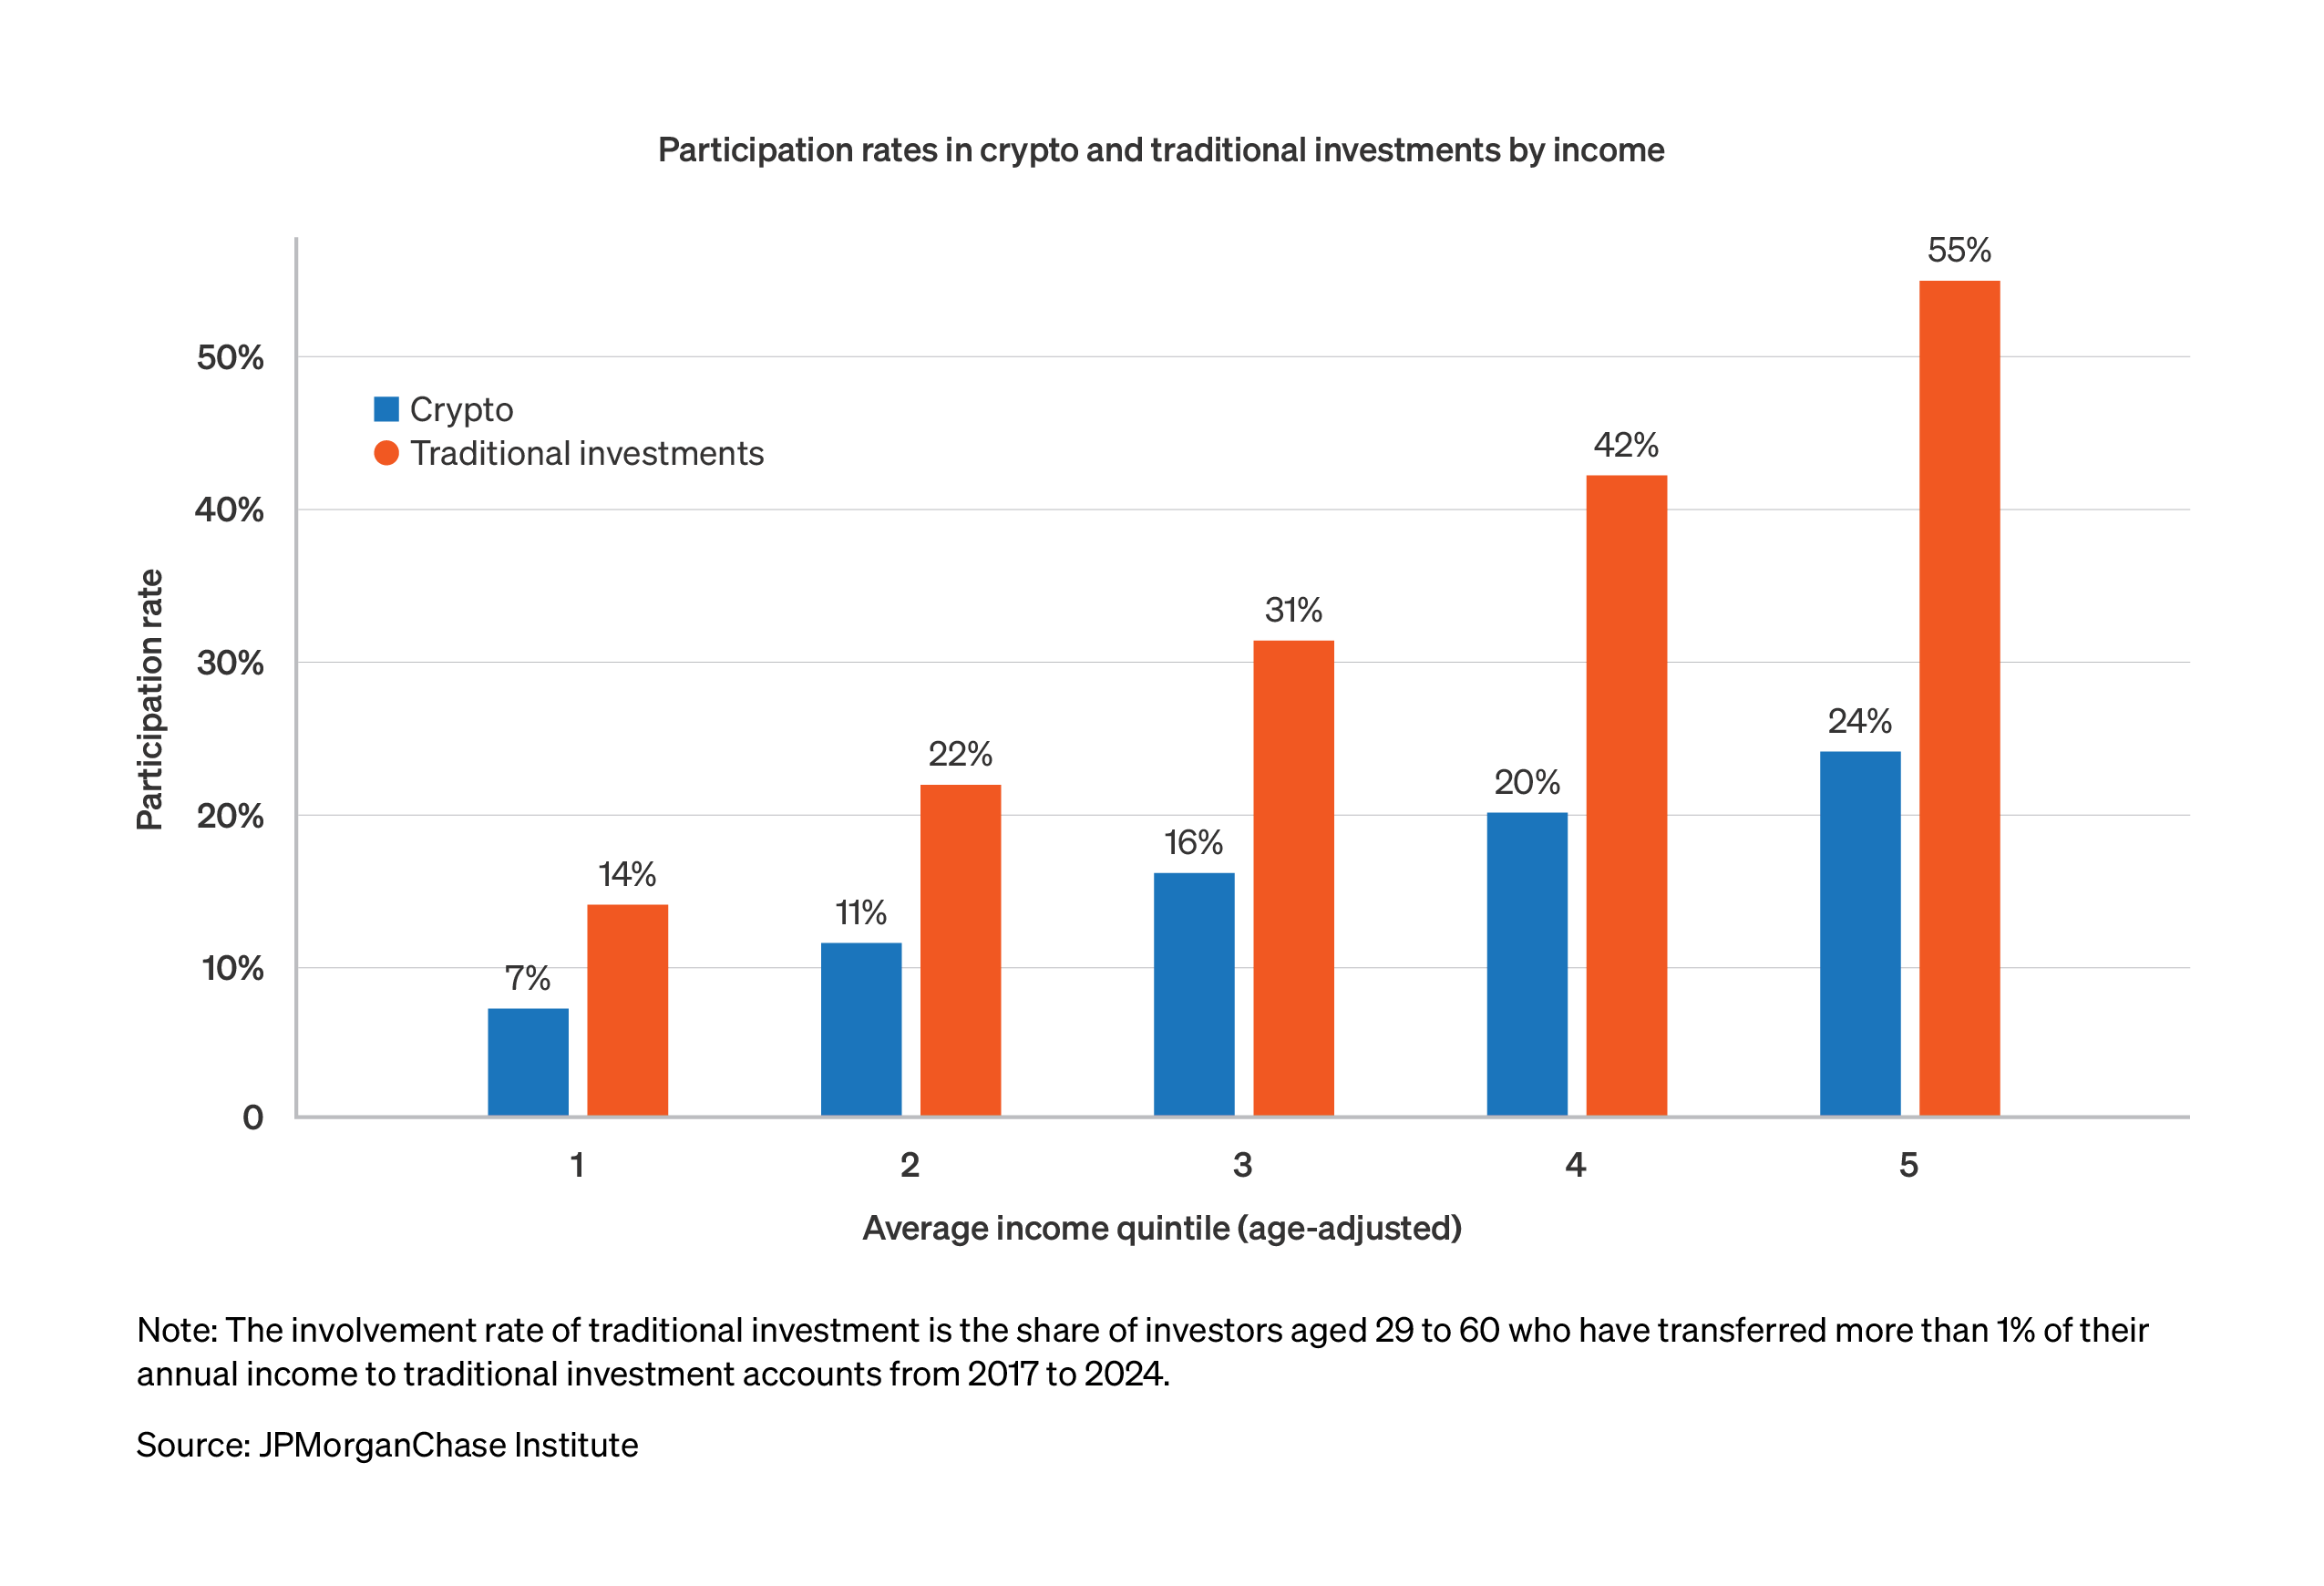
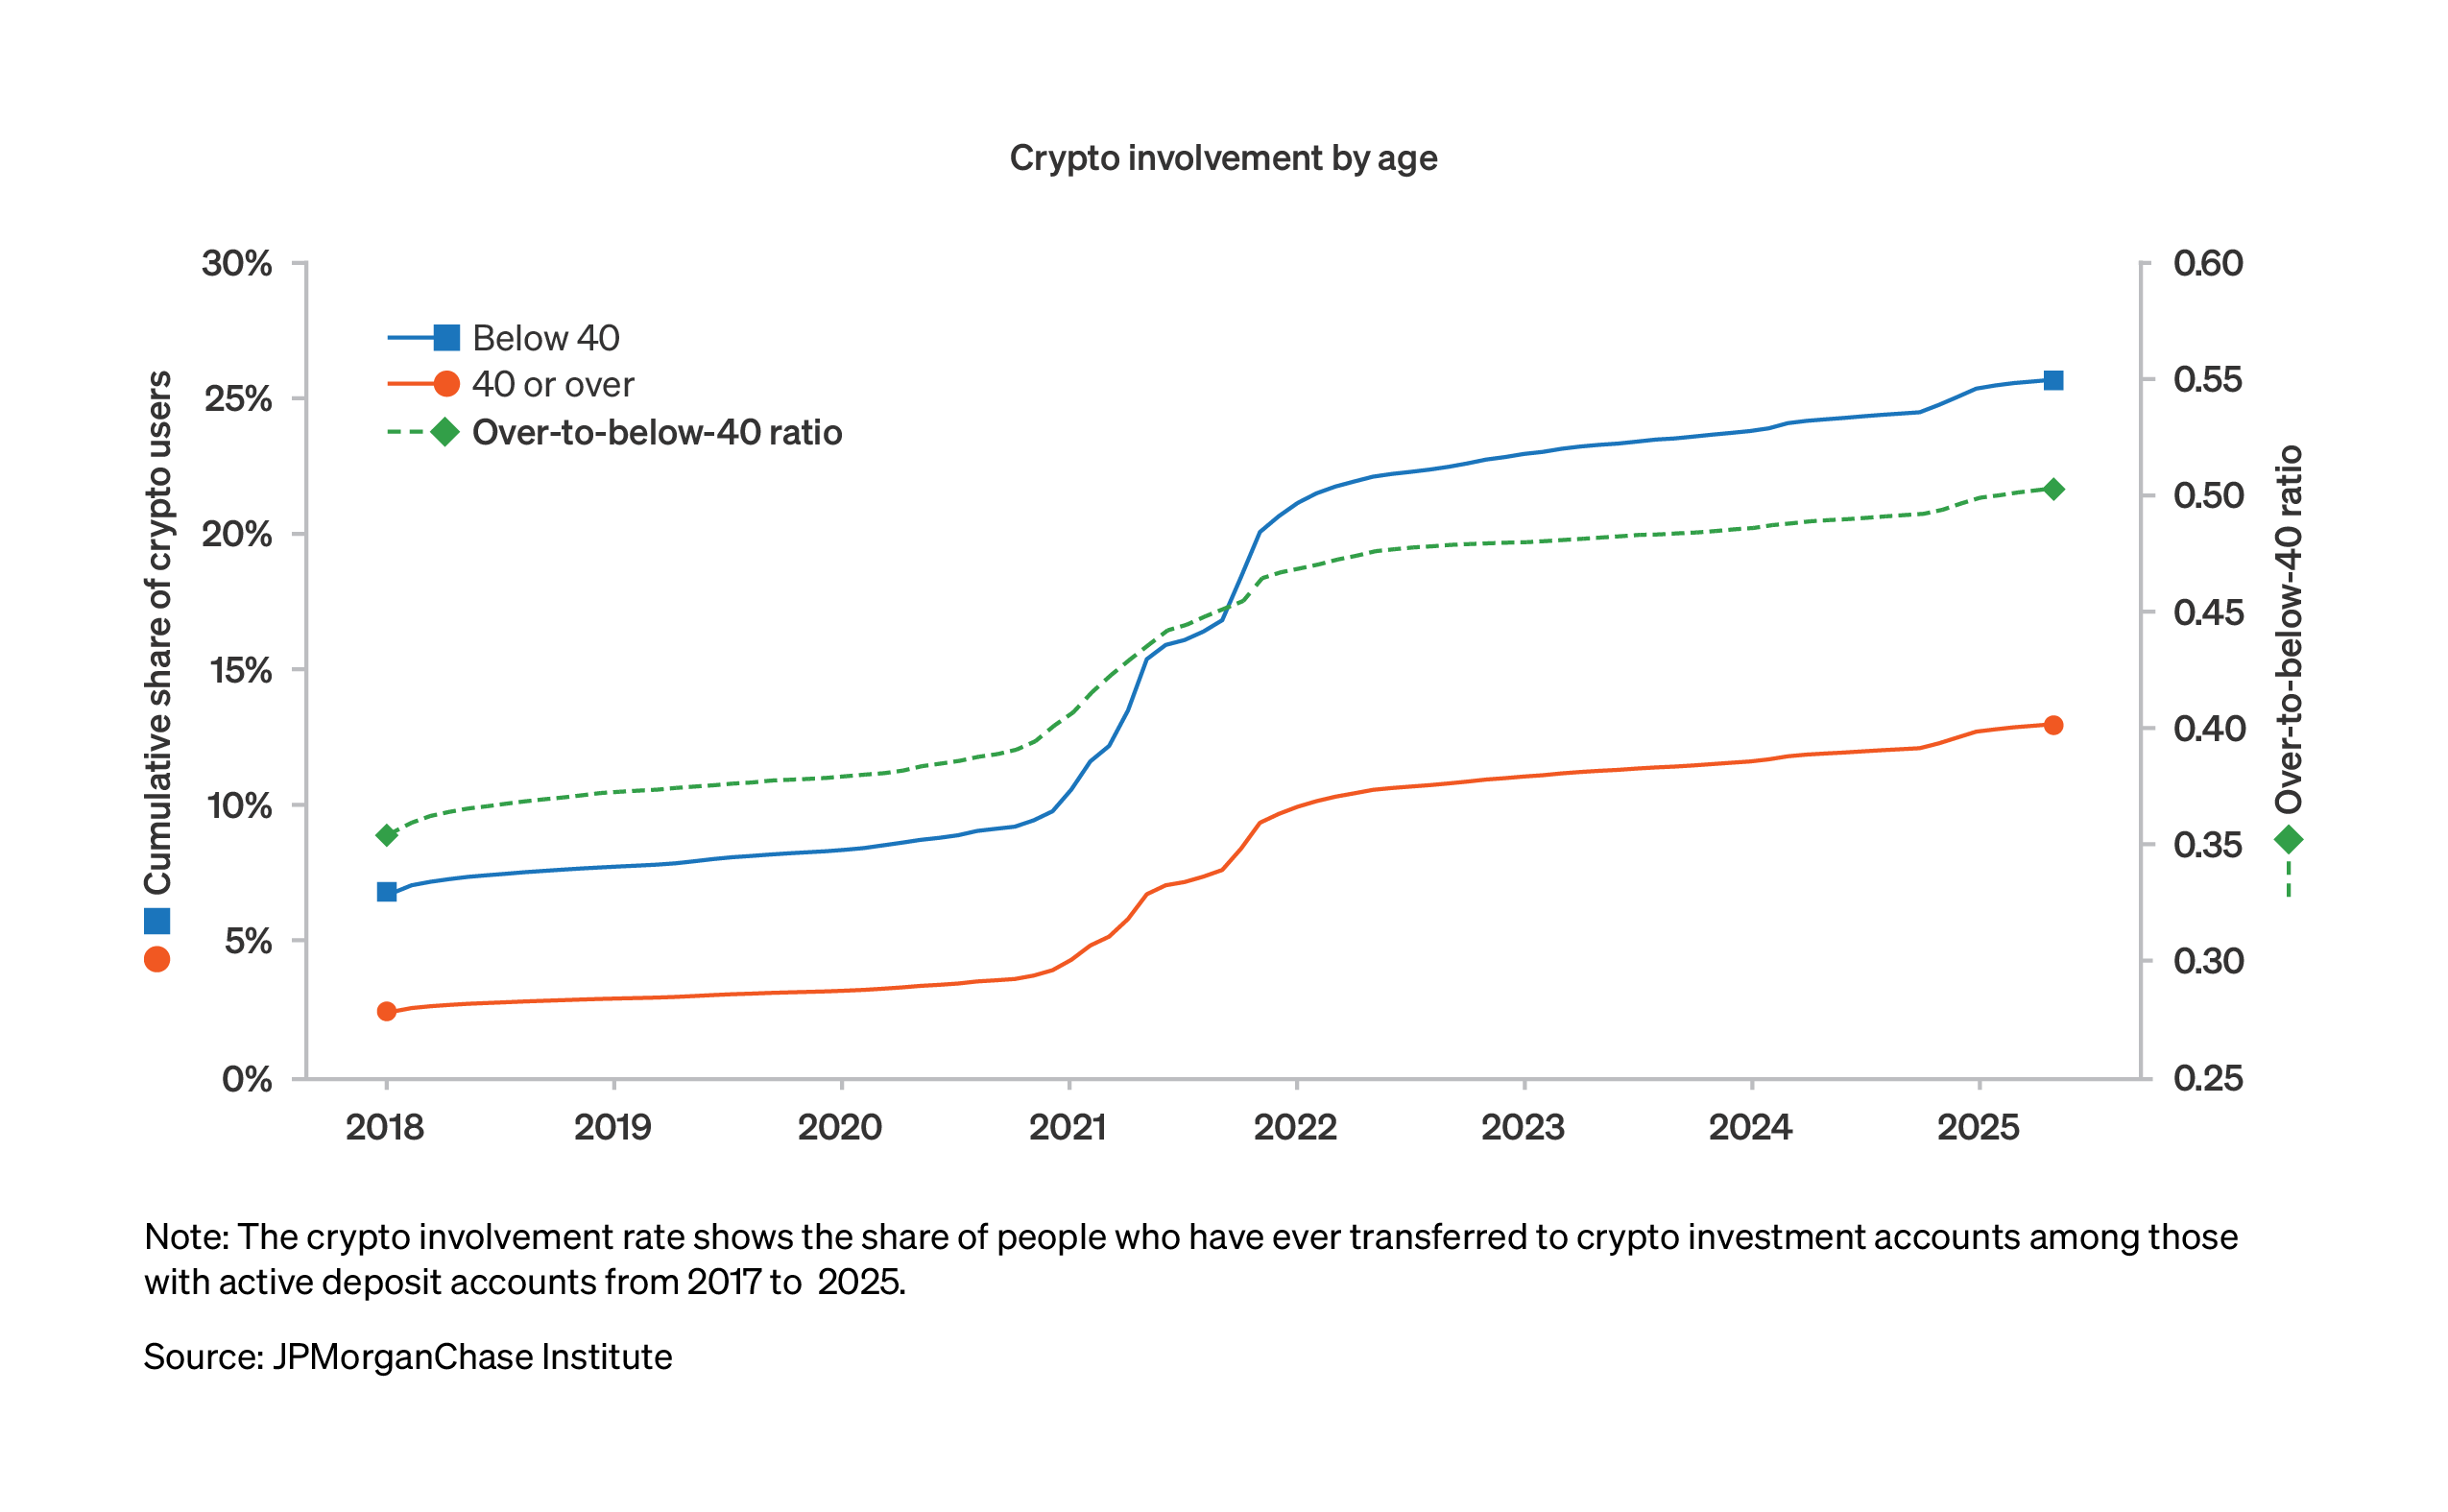
Figure 6, in three panels, shows how the involvement rates in crypto have evolved by age, gender, and income groups. Each plot shows the cumulative share of each group with holdings alongside the relative involvement rate across demographic cuts. In each case, the relative rates move toward one—implying reduced demographic concentration—but remain far from parity.4
Panel A: Adoption by age
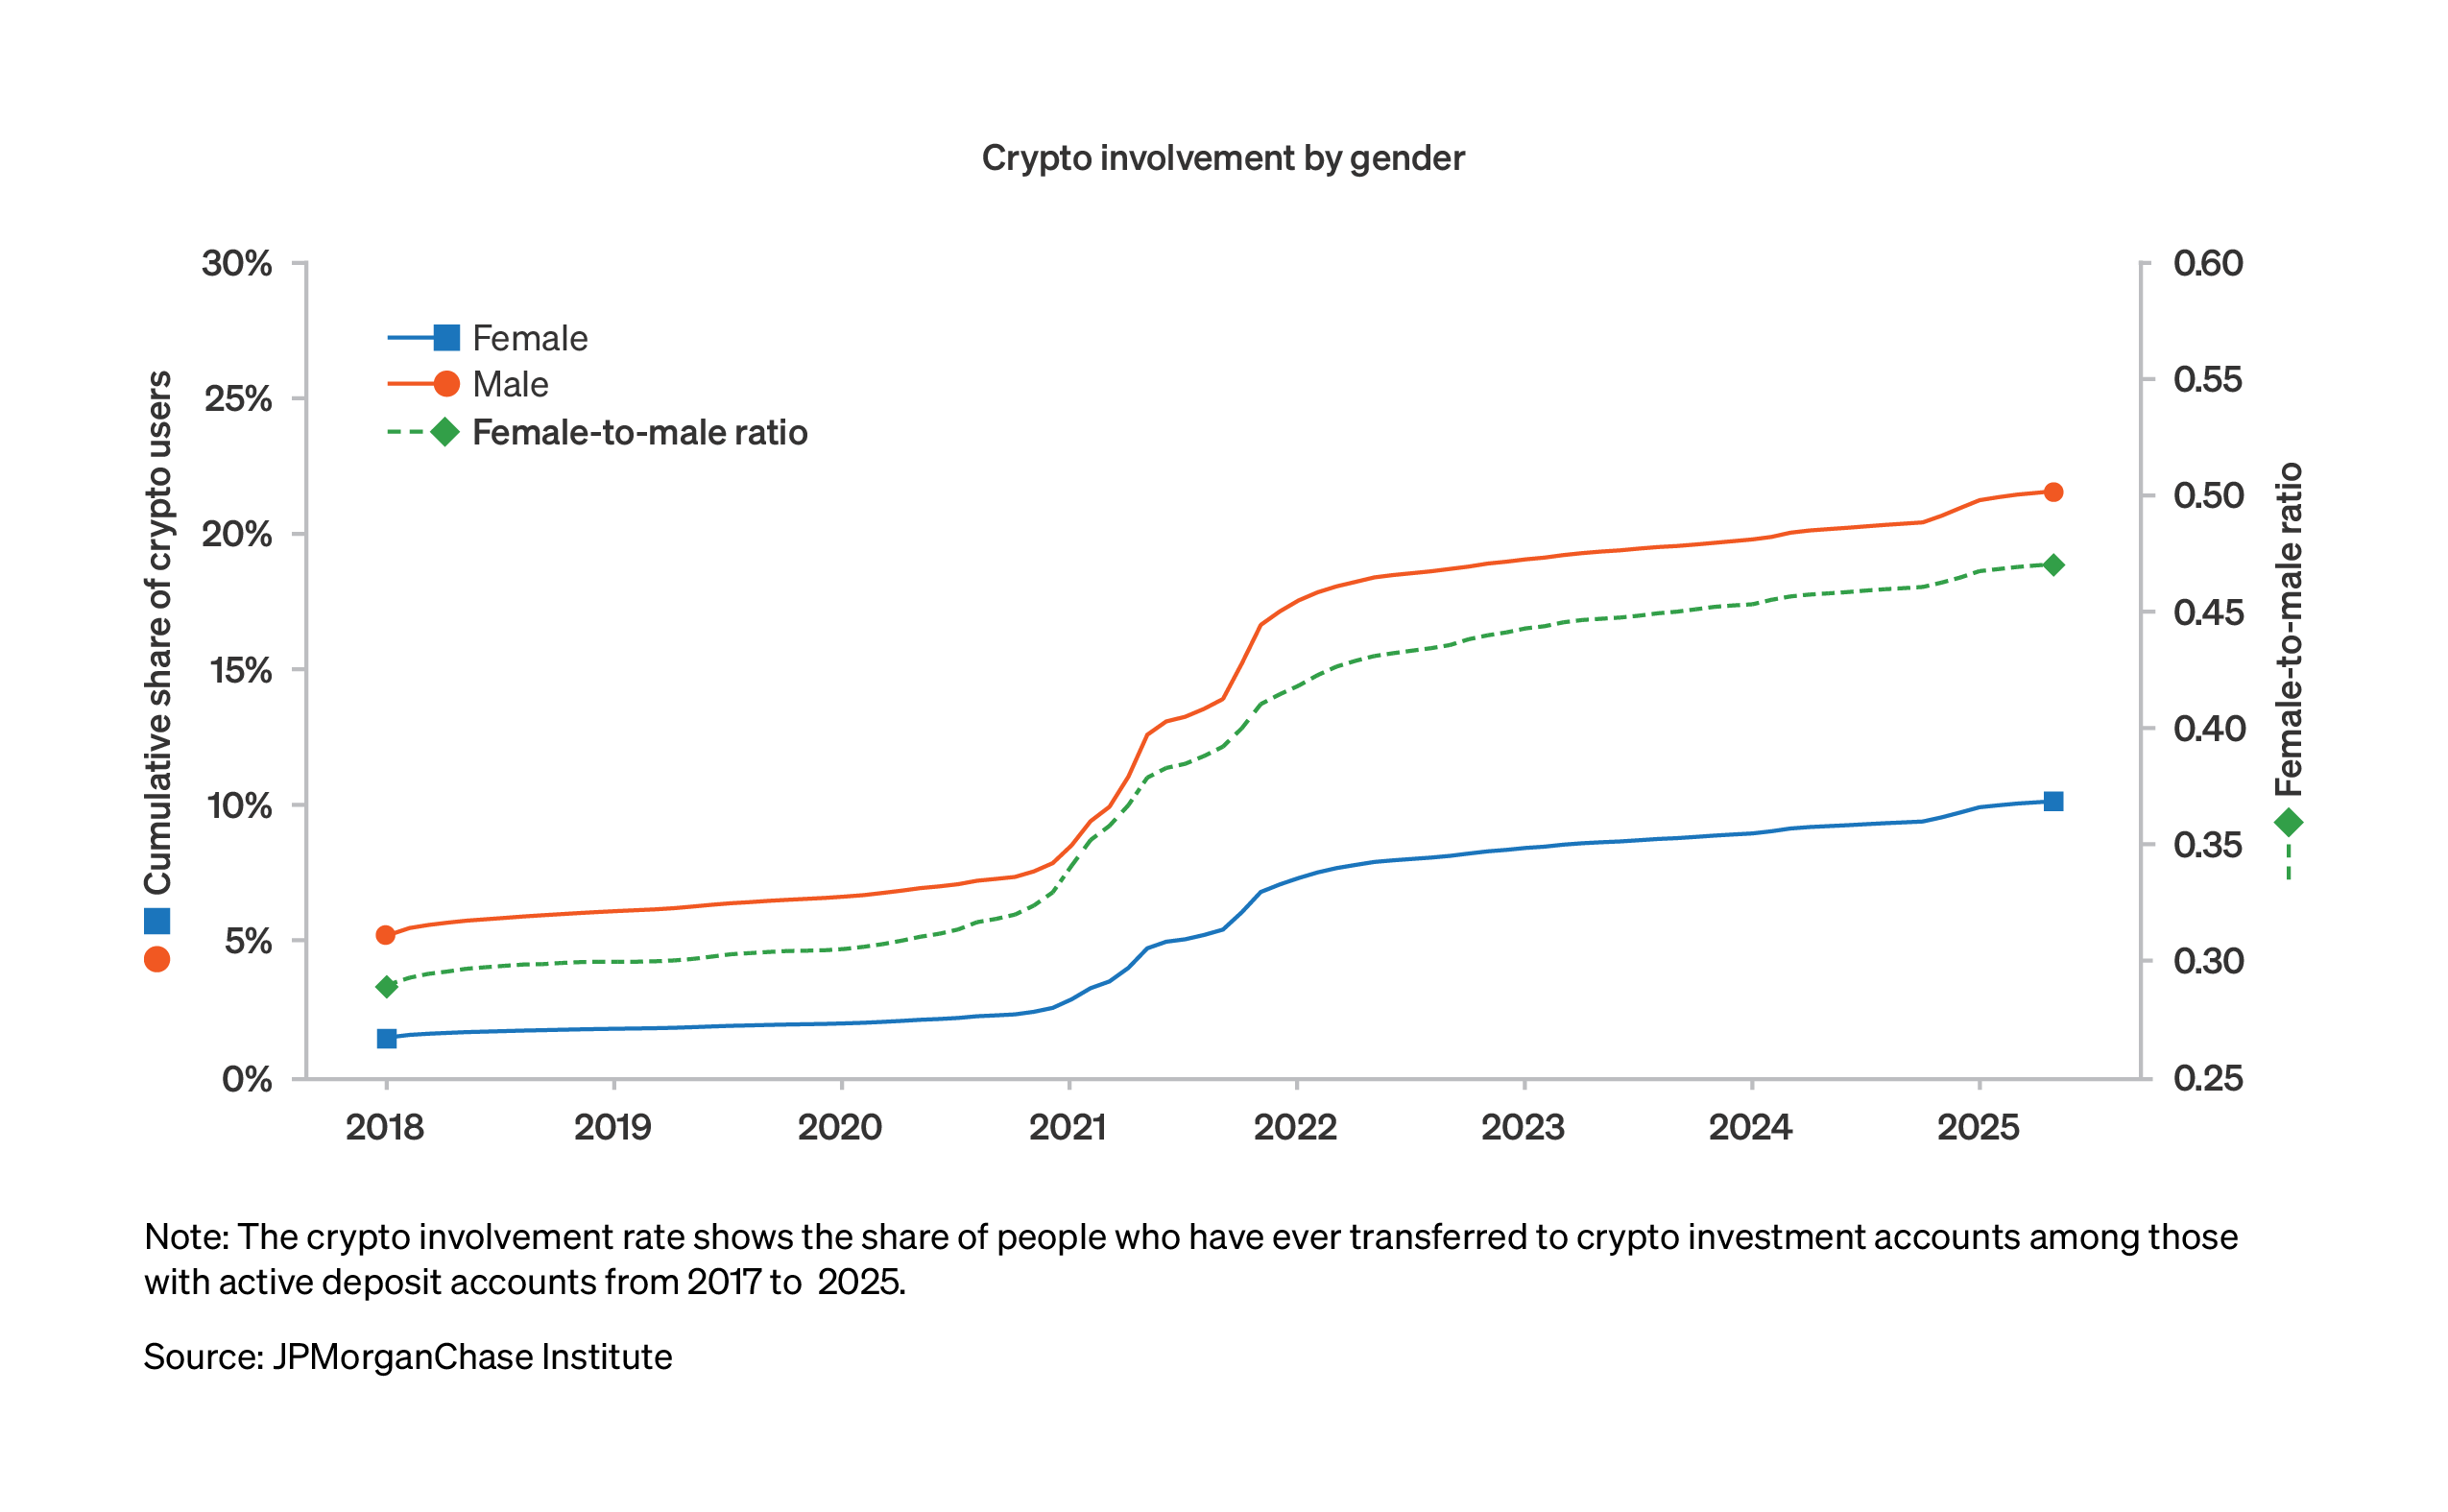
Panel B: Adoption by gender
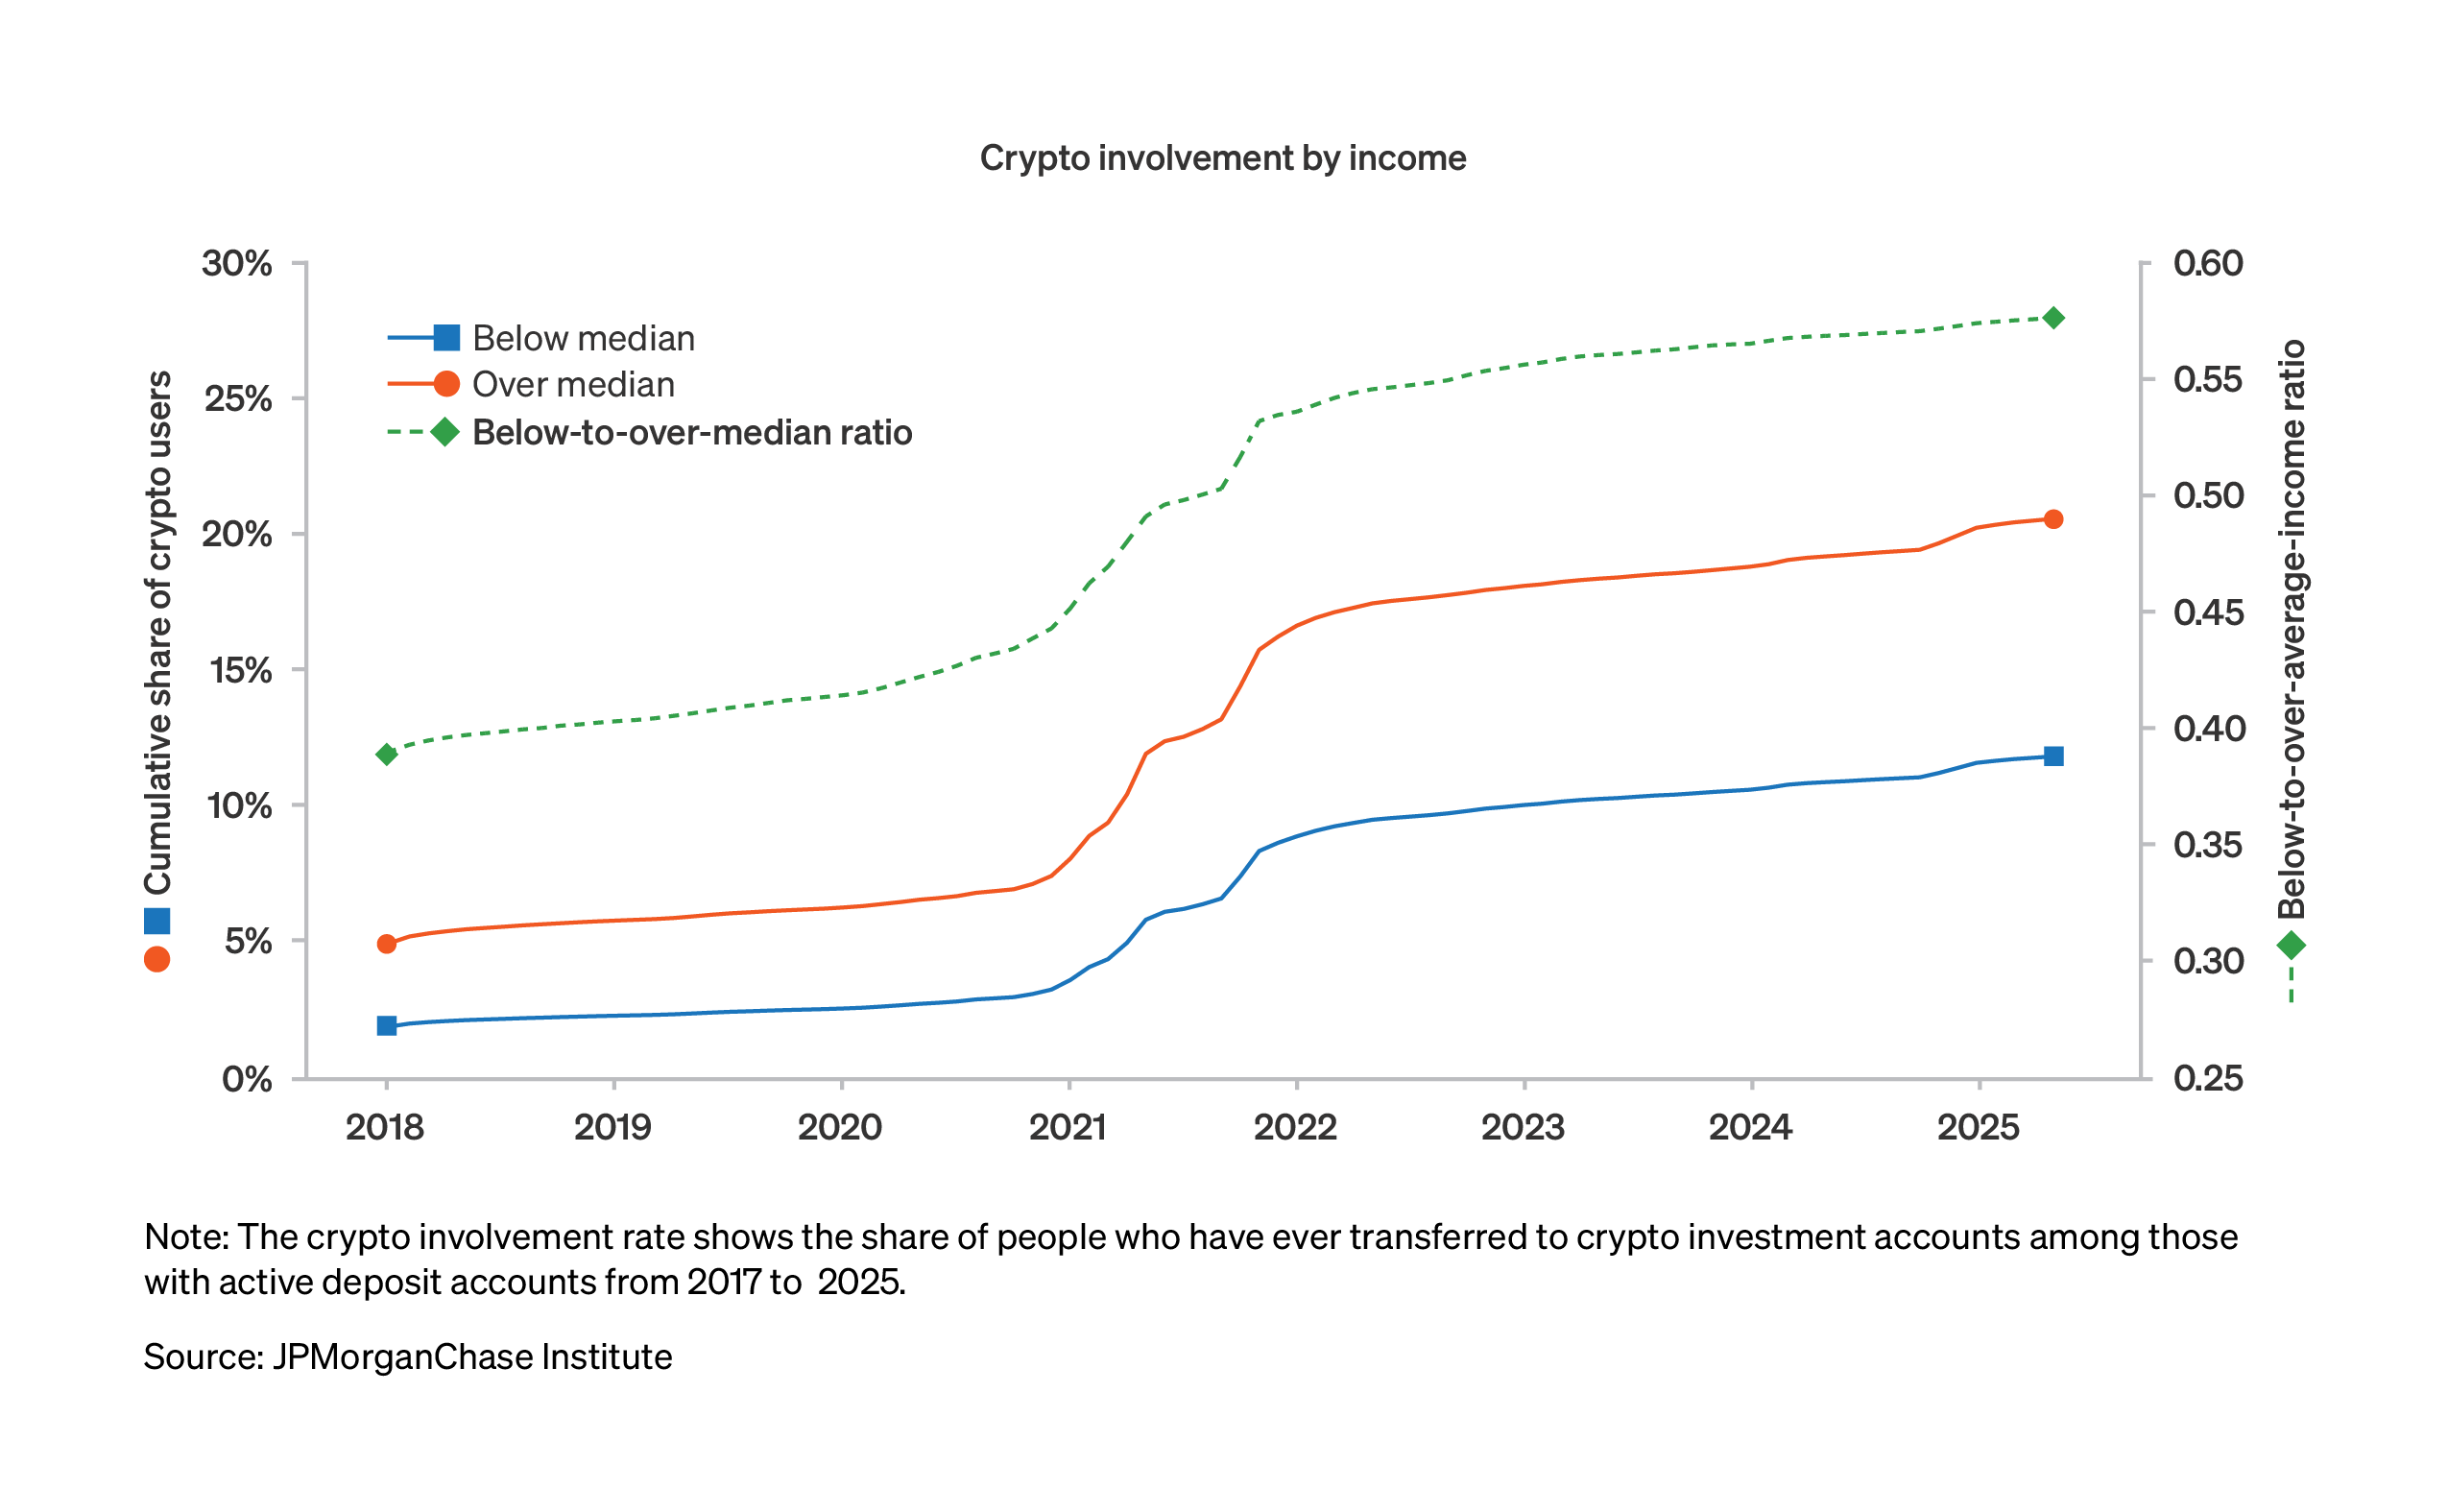
Panel C: Adoption by income group
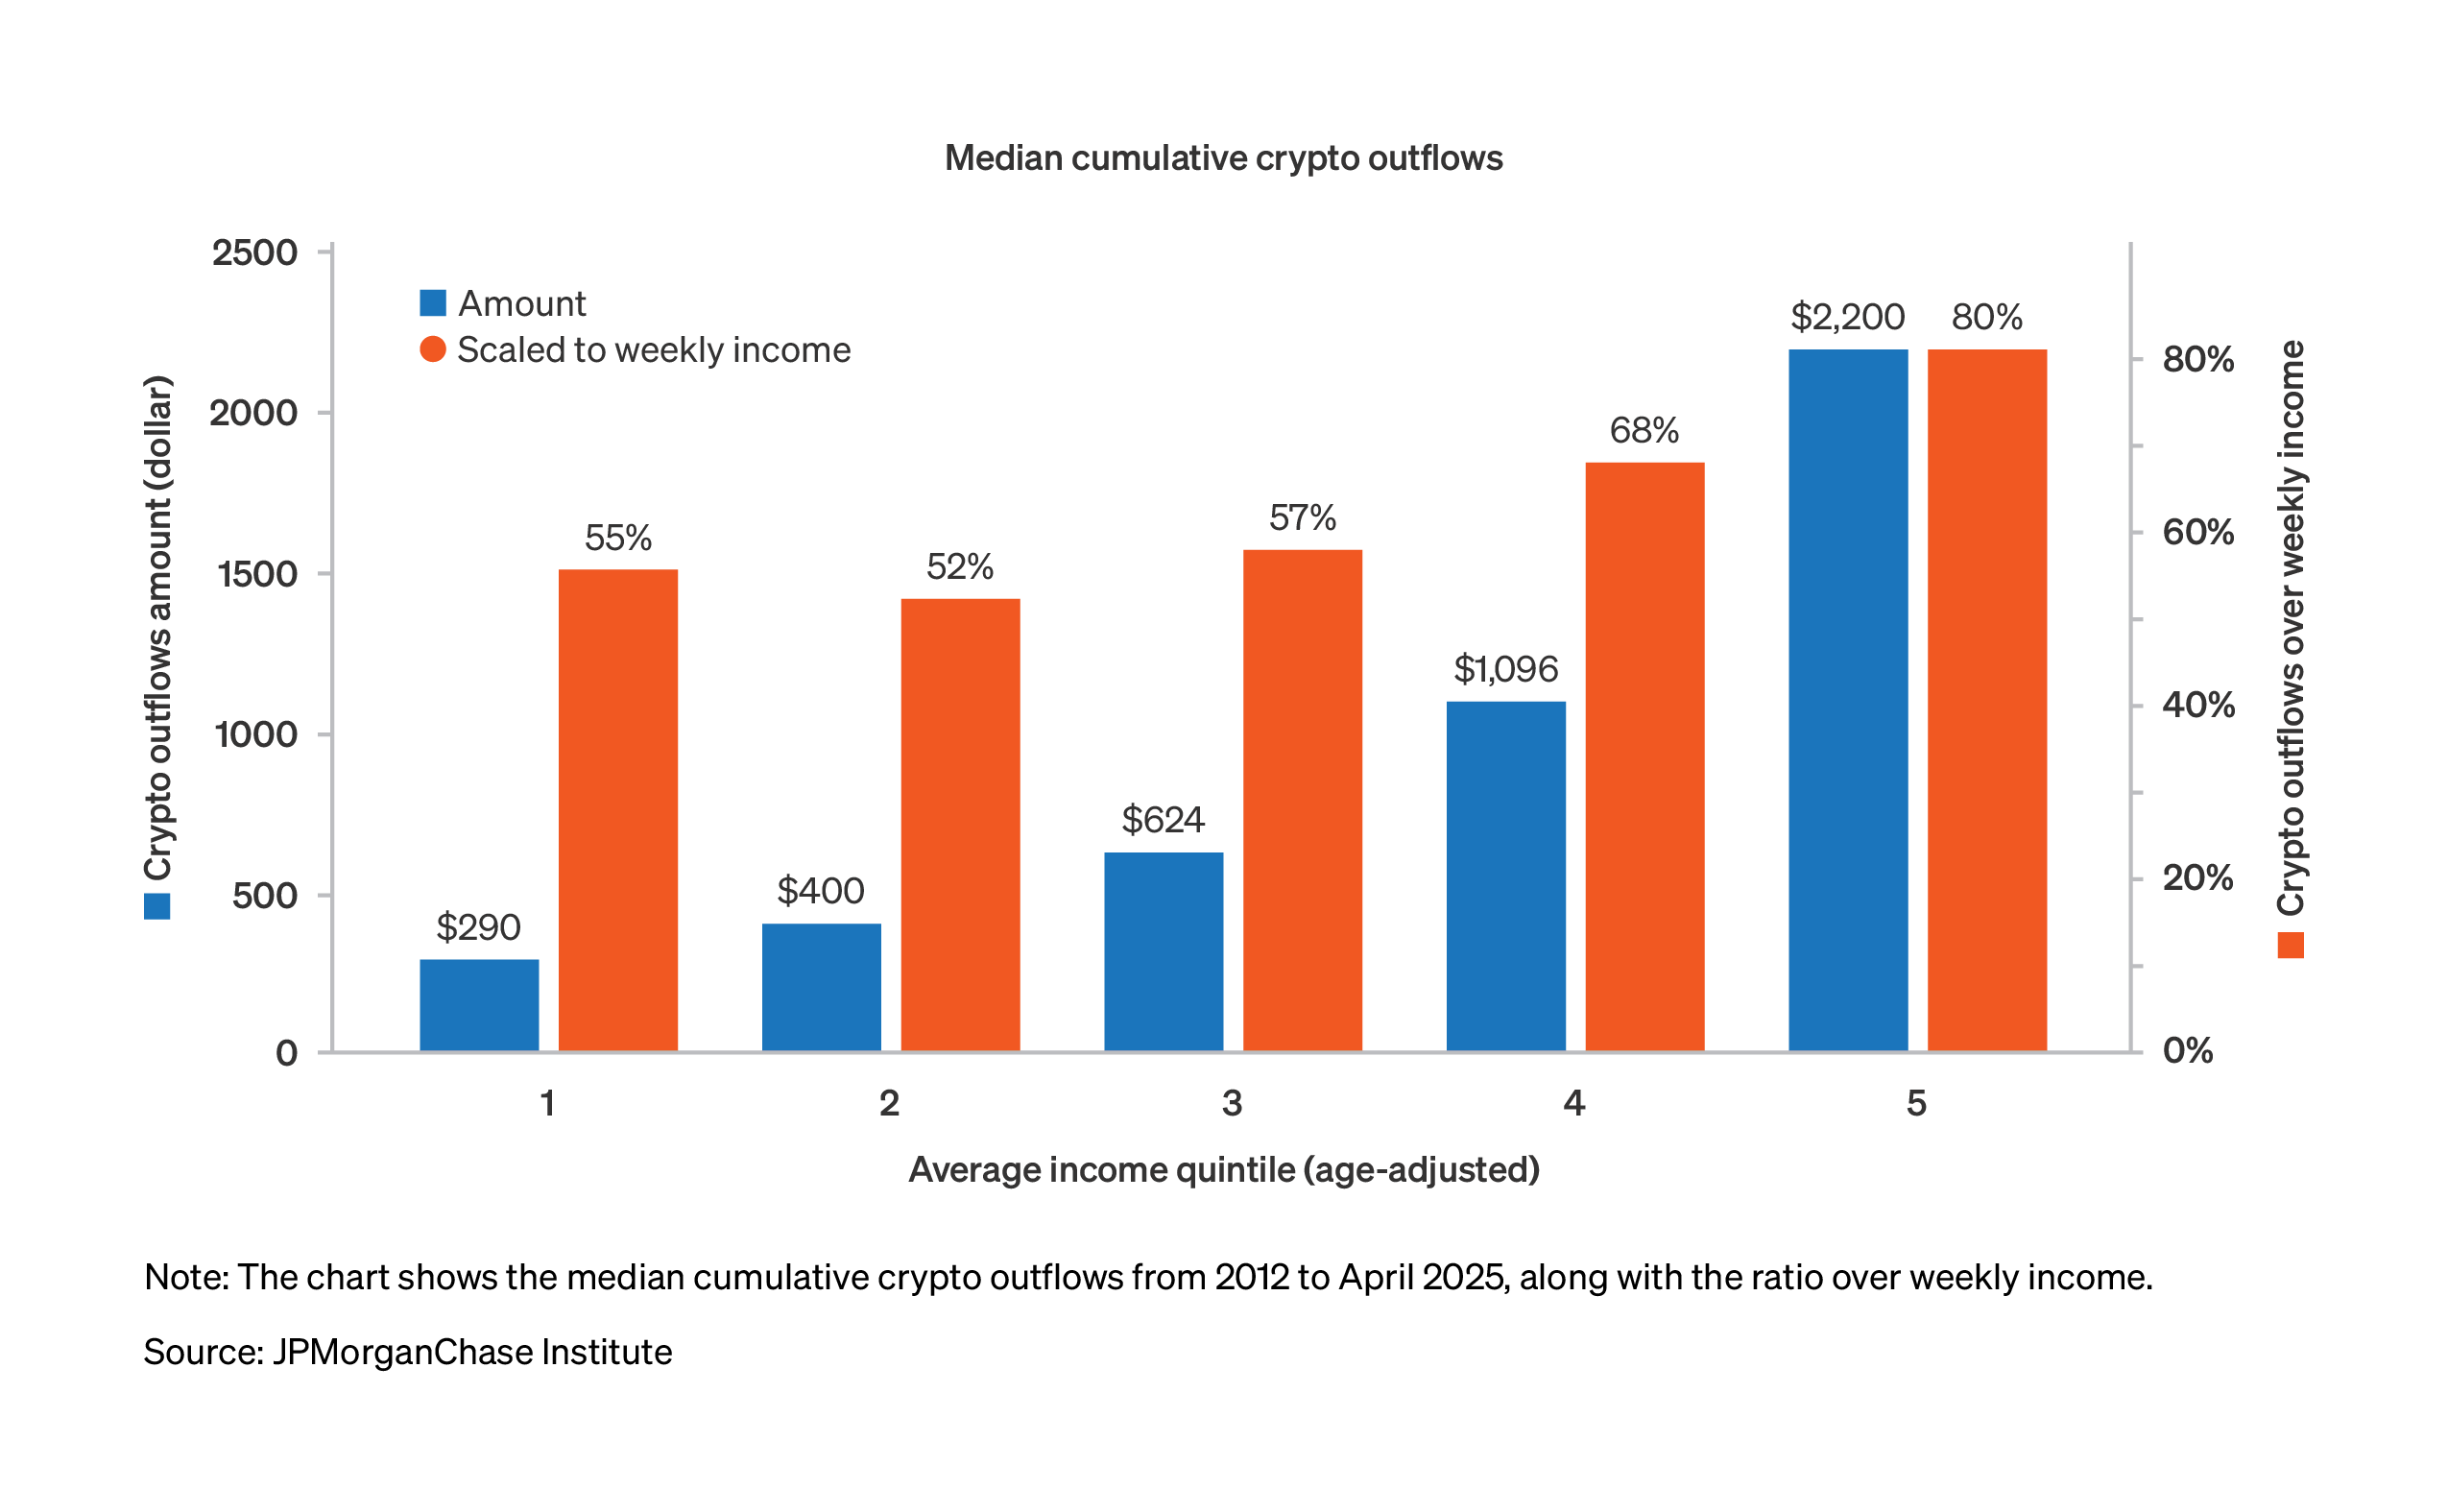
The amounts of money people transfer into crypto markets varies among income groups, but for the vast majority of people holdings remain quite small. Figure 7 depicts medians of the cumulative amounts transferred to crypto in dollars and in terms of weeks’ worth of take-home income. The median amount of money moved into crypto accounts amounts to less than a week’s worth of take-home pay in each income quintile. Amounts transferred are largest for the top quintile of earners, both in terms of absolute dollars and when scaled to income: a median of about $2,200, or 80 percent of a week’s worth of income. Individuals in the bottom 60 percent of incomes have moved about 4 days’ worth of income into crypto accounts, an amount ranging from $300−600 across the lower three quintiles.
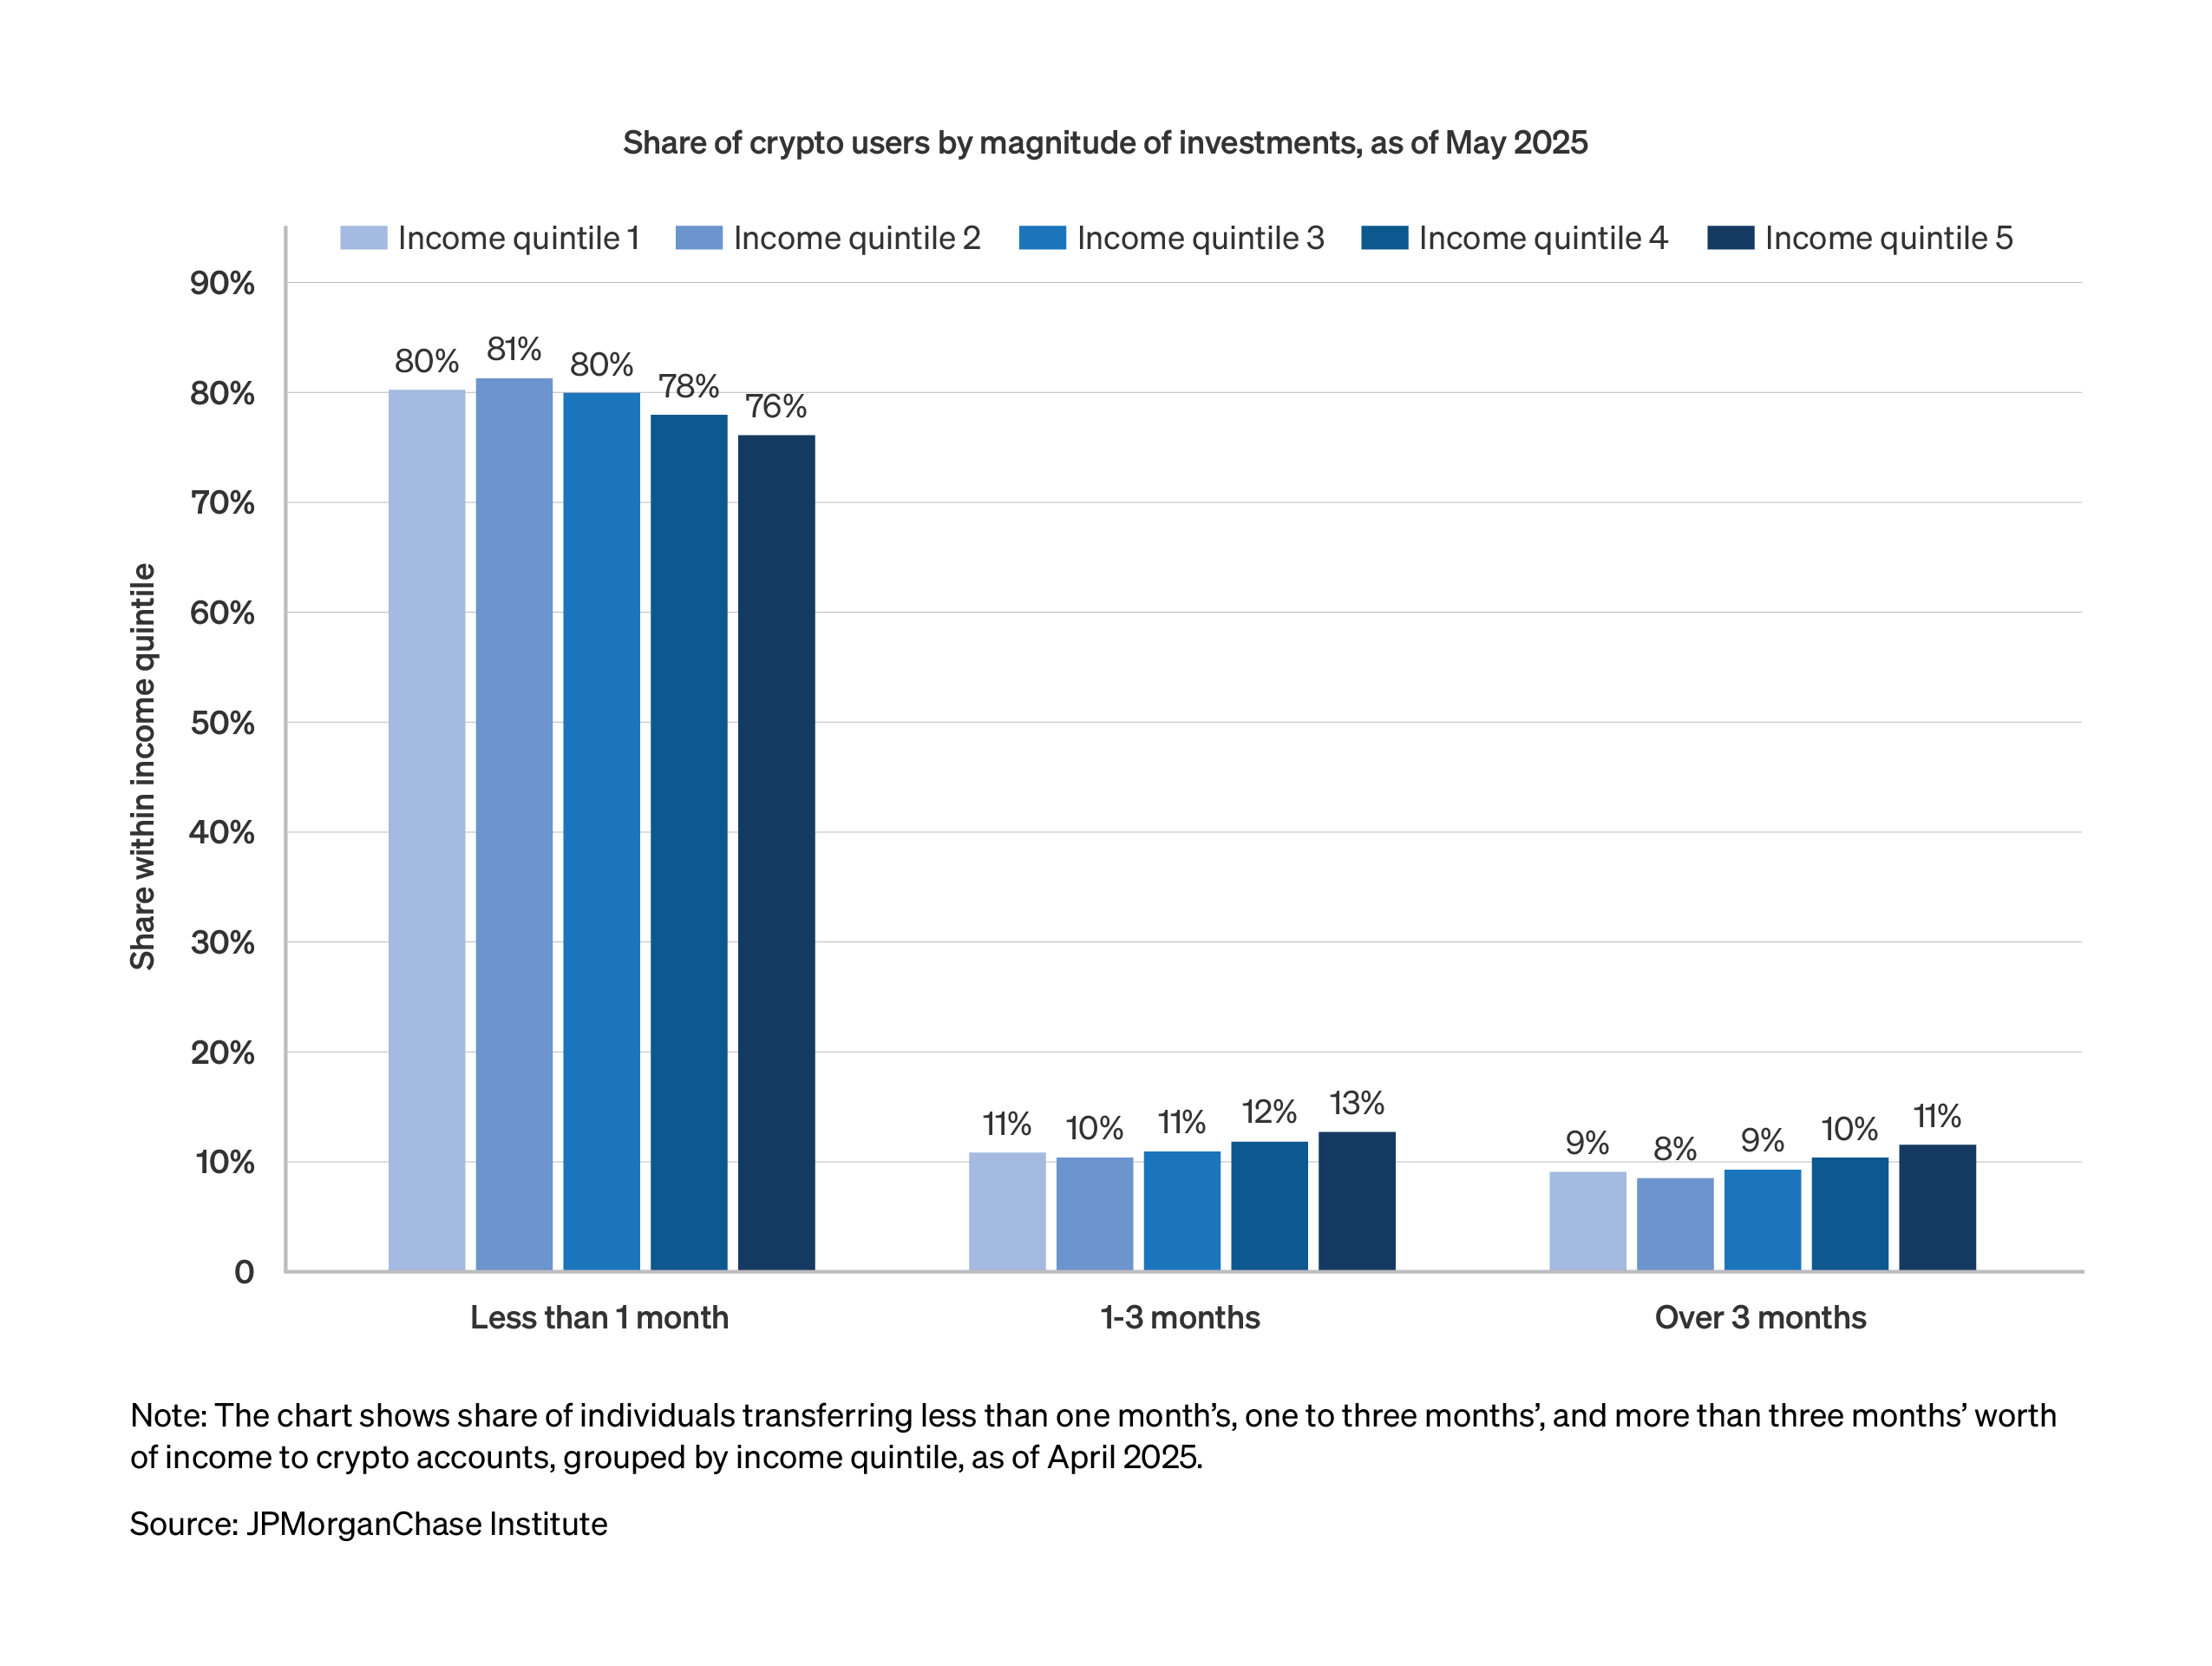
Despite the small magnitude of holdings for the median crypto user, a slice of the population may be taking notably higher amounts of risk. Figure 8 captures the share of people with cumulative transfers to crypto accounts ranging from one-to-three months’ of pay, and over-three months’ pay, by income quintile. About 80 percent of people have less than one month’s worth of take-home pay in the crypto ecosystem; the remainder is about equally split across the higher two buckets. Slightly larger amounts of risk taking is evident among the top earners, consistent with the medians reported above.
The expansion in 2024 of exchange-traded products tracking cryptocurrencies has provided new avenues for retail investors seeking to gain exposure to these assets. We use data from self-directed JPMorgan Wealth Management portfolios to assess these trends. Importantly, differences in the user bases across investment platforms may mean that figures based on the portfolios in our data may differ substantially from others. Individuals in our sample may also hold multiple investment accounts, potentially leading our crypto involvement rates and portfolio shares to differ from the overall population of investors.
For people that have active Chase checking accounts and JPMorgan Wealth Management accounts, we provide a unique view into whether crypto ETF users had previously put money into the crypto ecosystem. This lens may show whether easier access enticed new entrants to crypto markets or merely provided a substitute venue for existing crypto investors. Figure 9 shows the share over time of retail investors that hold crypto ETFs, broken out by those that had or did not have prior transfers. Investors without prior direct holdings have been more likely to add crypto ETFs to their portfolios.
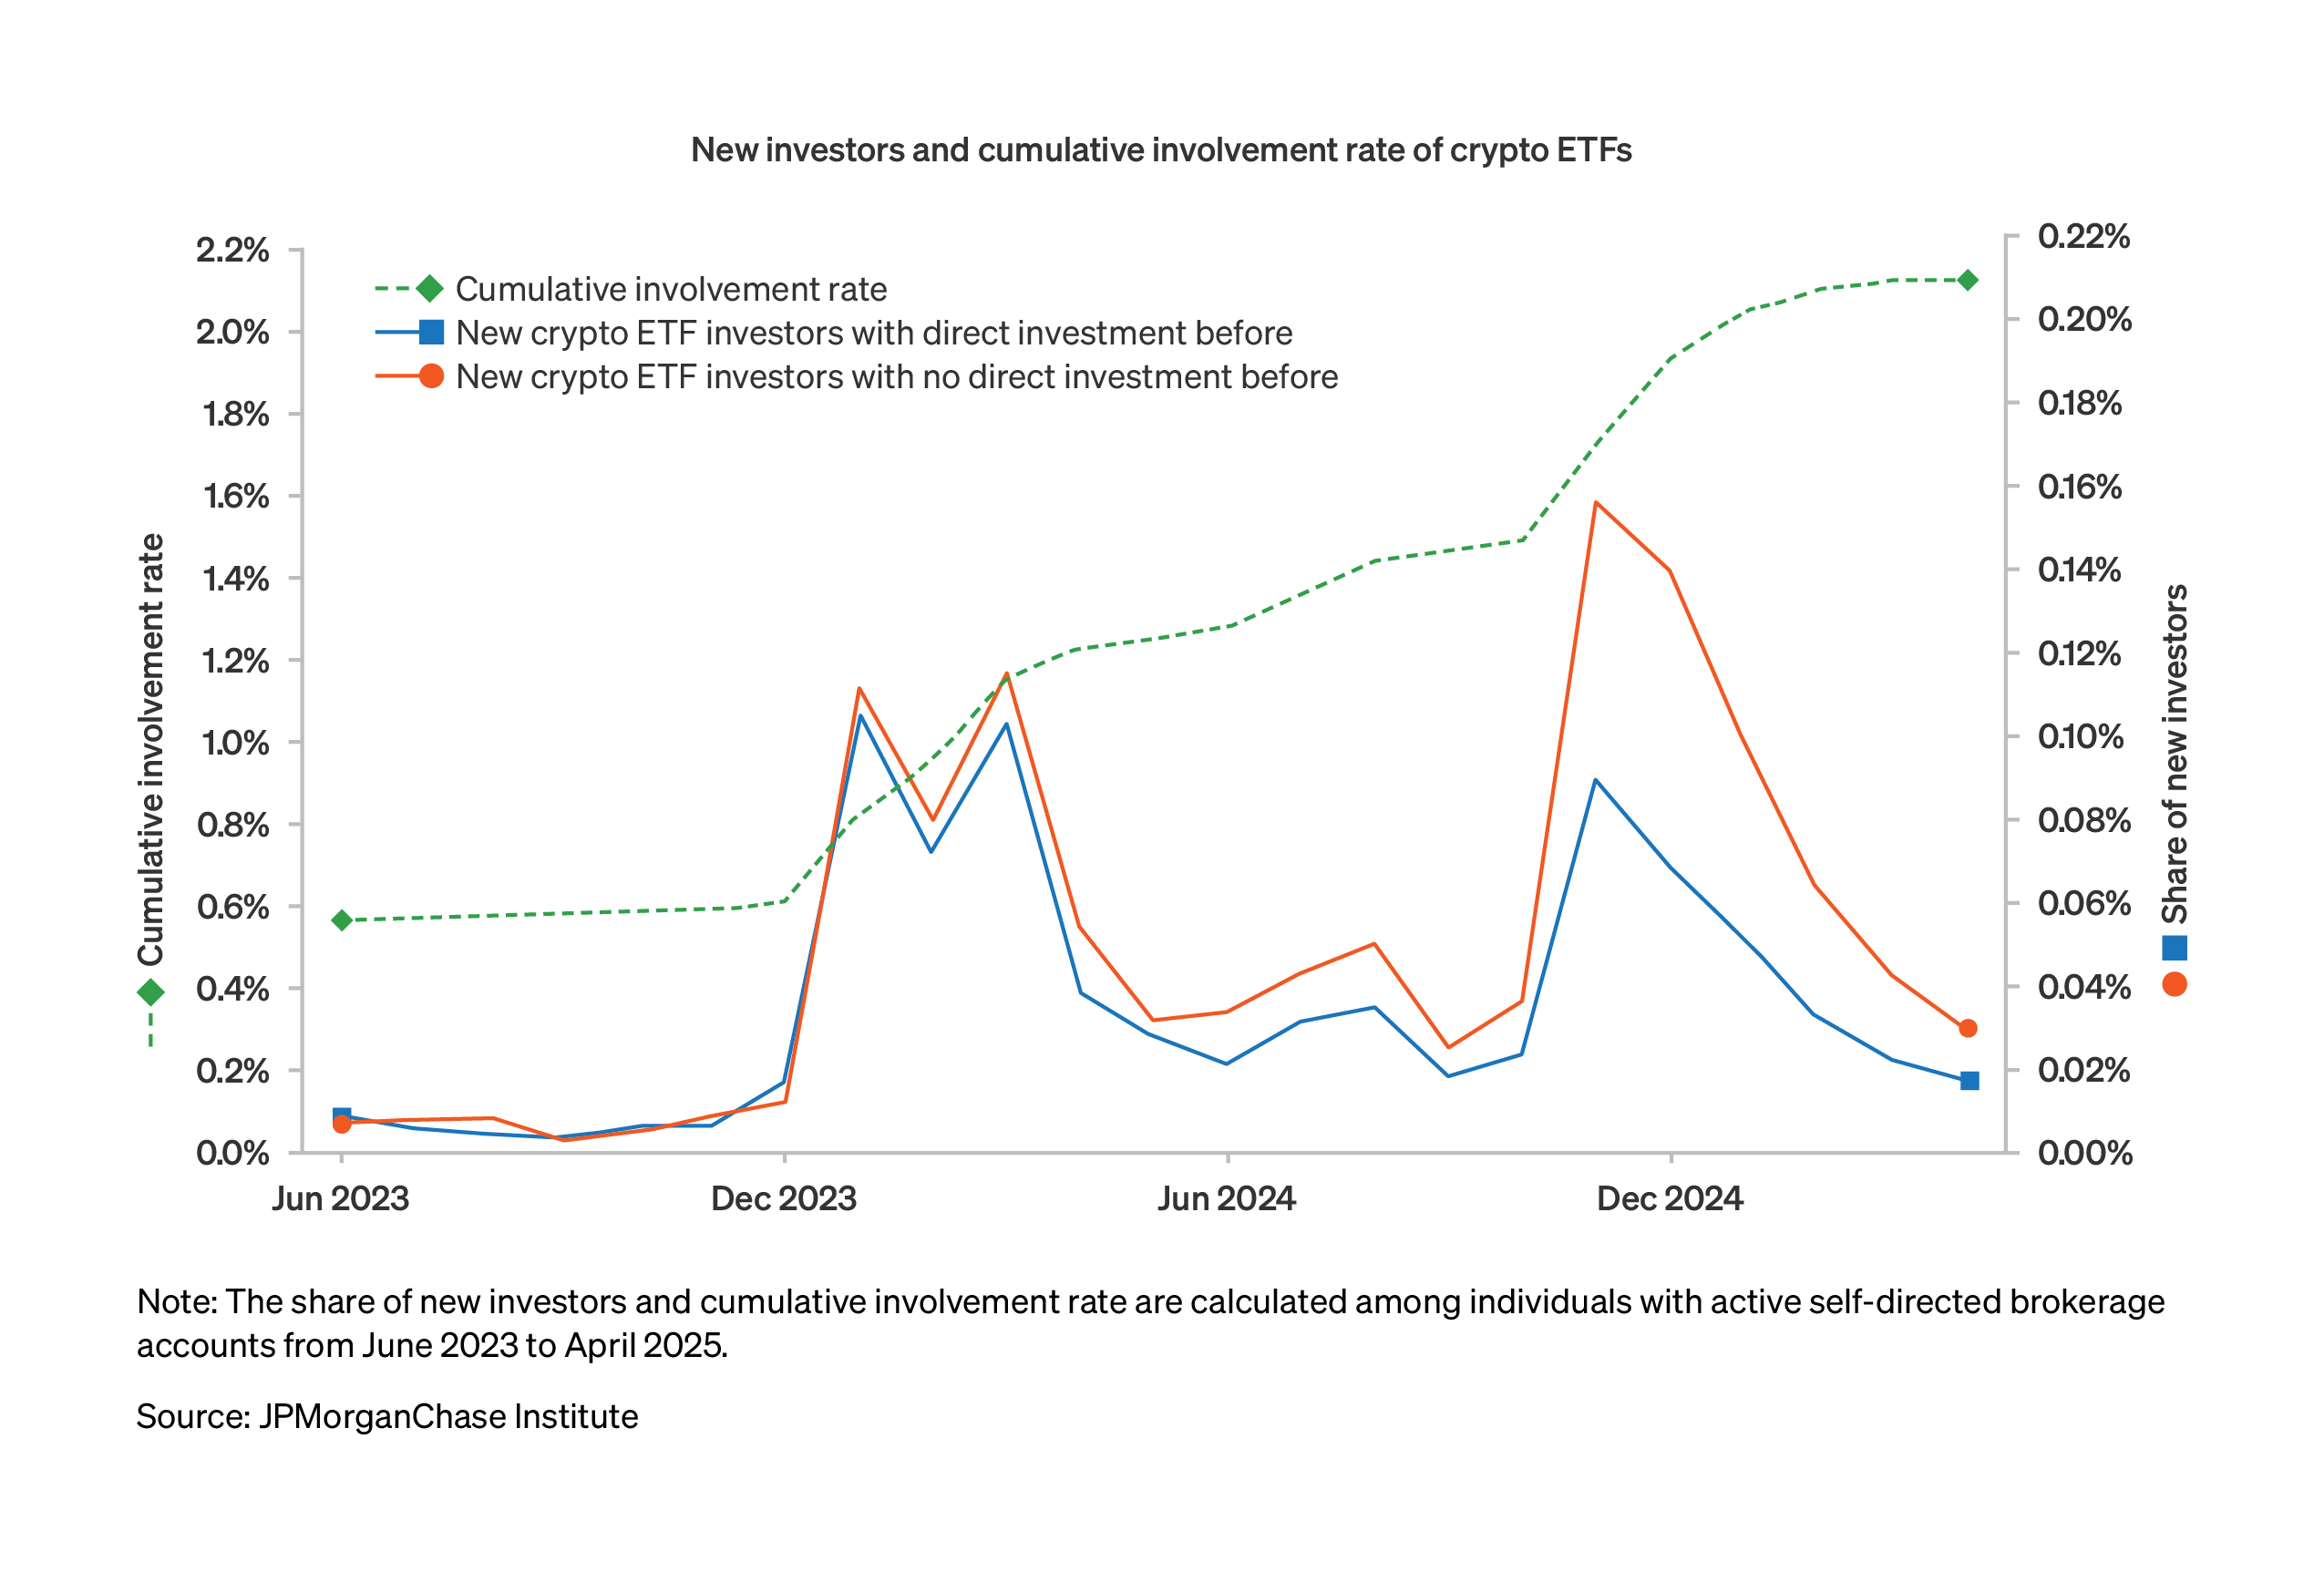
Since the expansion of crypto-tracking ETFs in early 2024, about 2 percent of self-directed account users in our sample had built positive holdings as of April 2025. Similar to flows into crypto platforms from checking accounts, increases in crypto ETF holdings came in two waves that coincided with new all-time highs in bitcoin in early 2024 and late 2024. Purchases of crypto-tracking ETFs were somewhat higher among those without prior direct holdings, suggesting the availability of ETFs likely expanded the crypto investor universe.
Holdings of crypto ETFs have a similar demographic breakdown as those that move money between checking accounts and crypto platforms: notably higher involvement among those with higher incomes and Gen-Z and millennial men. Figures 10 and 11 quantify these involvement rates.
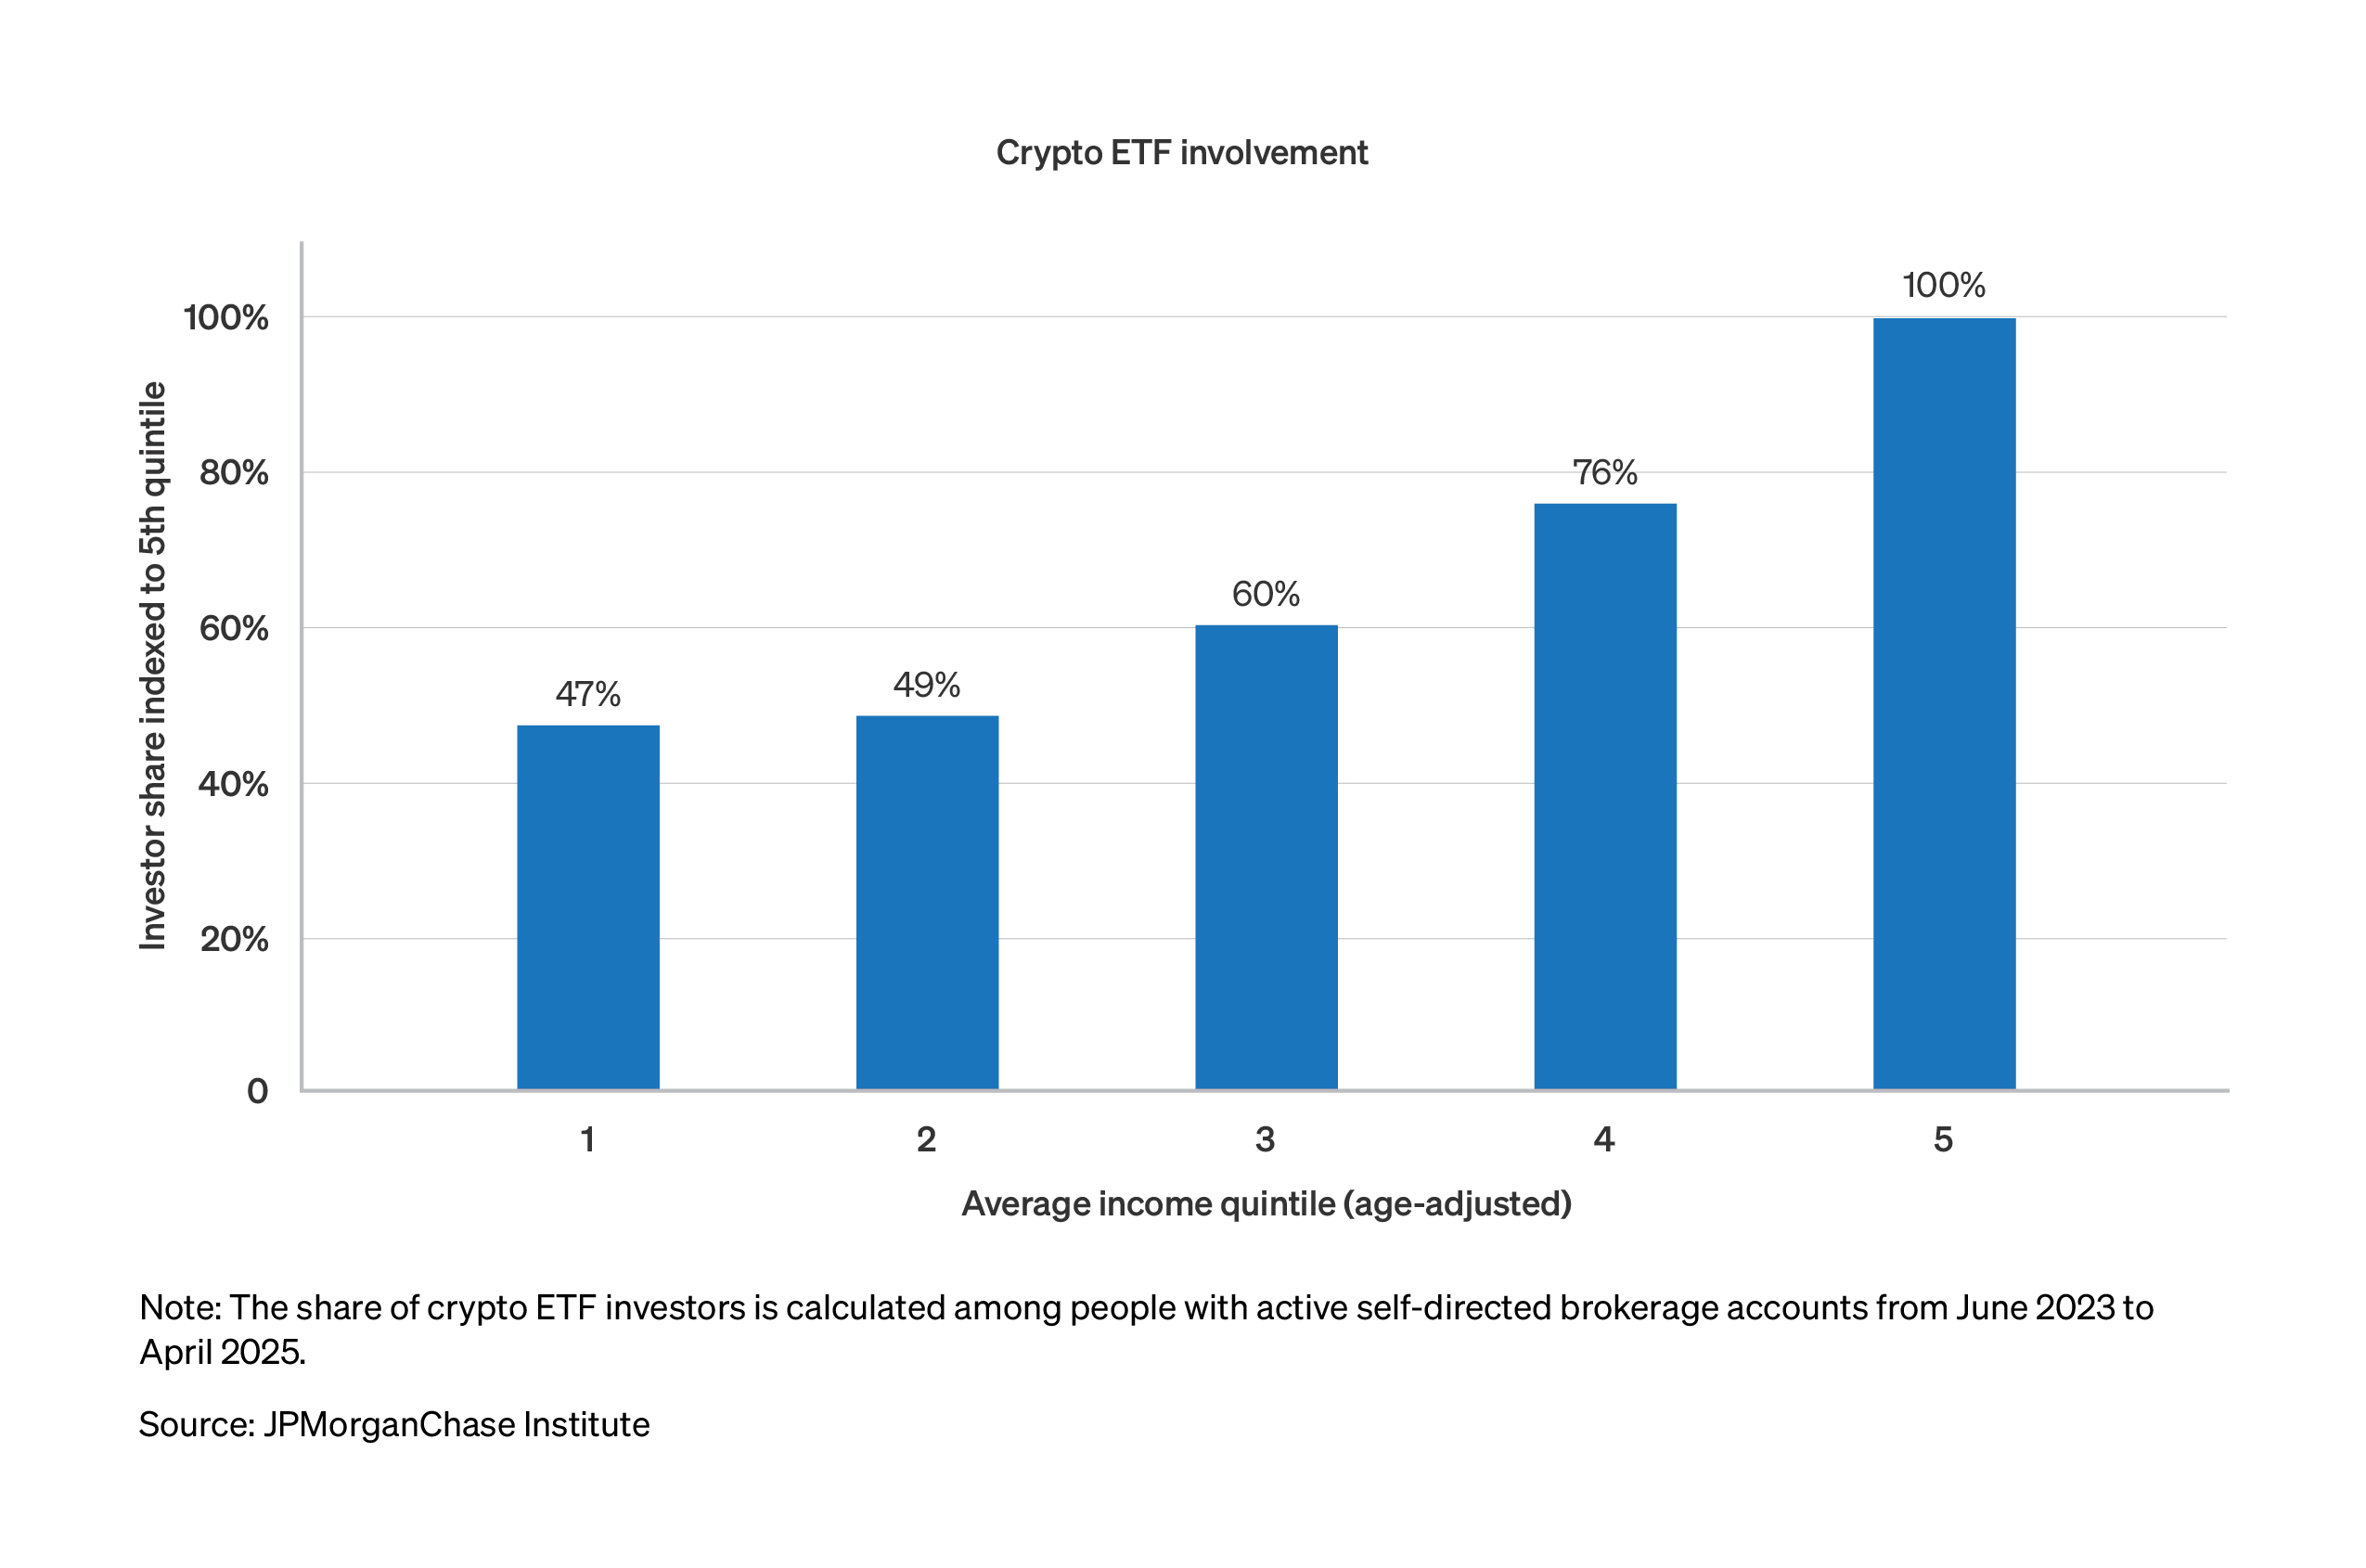
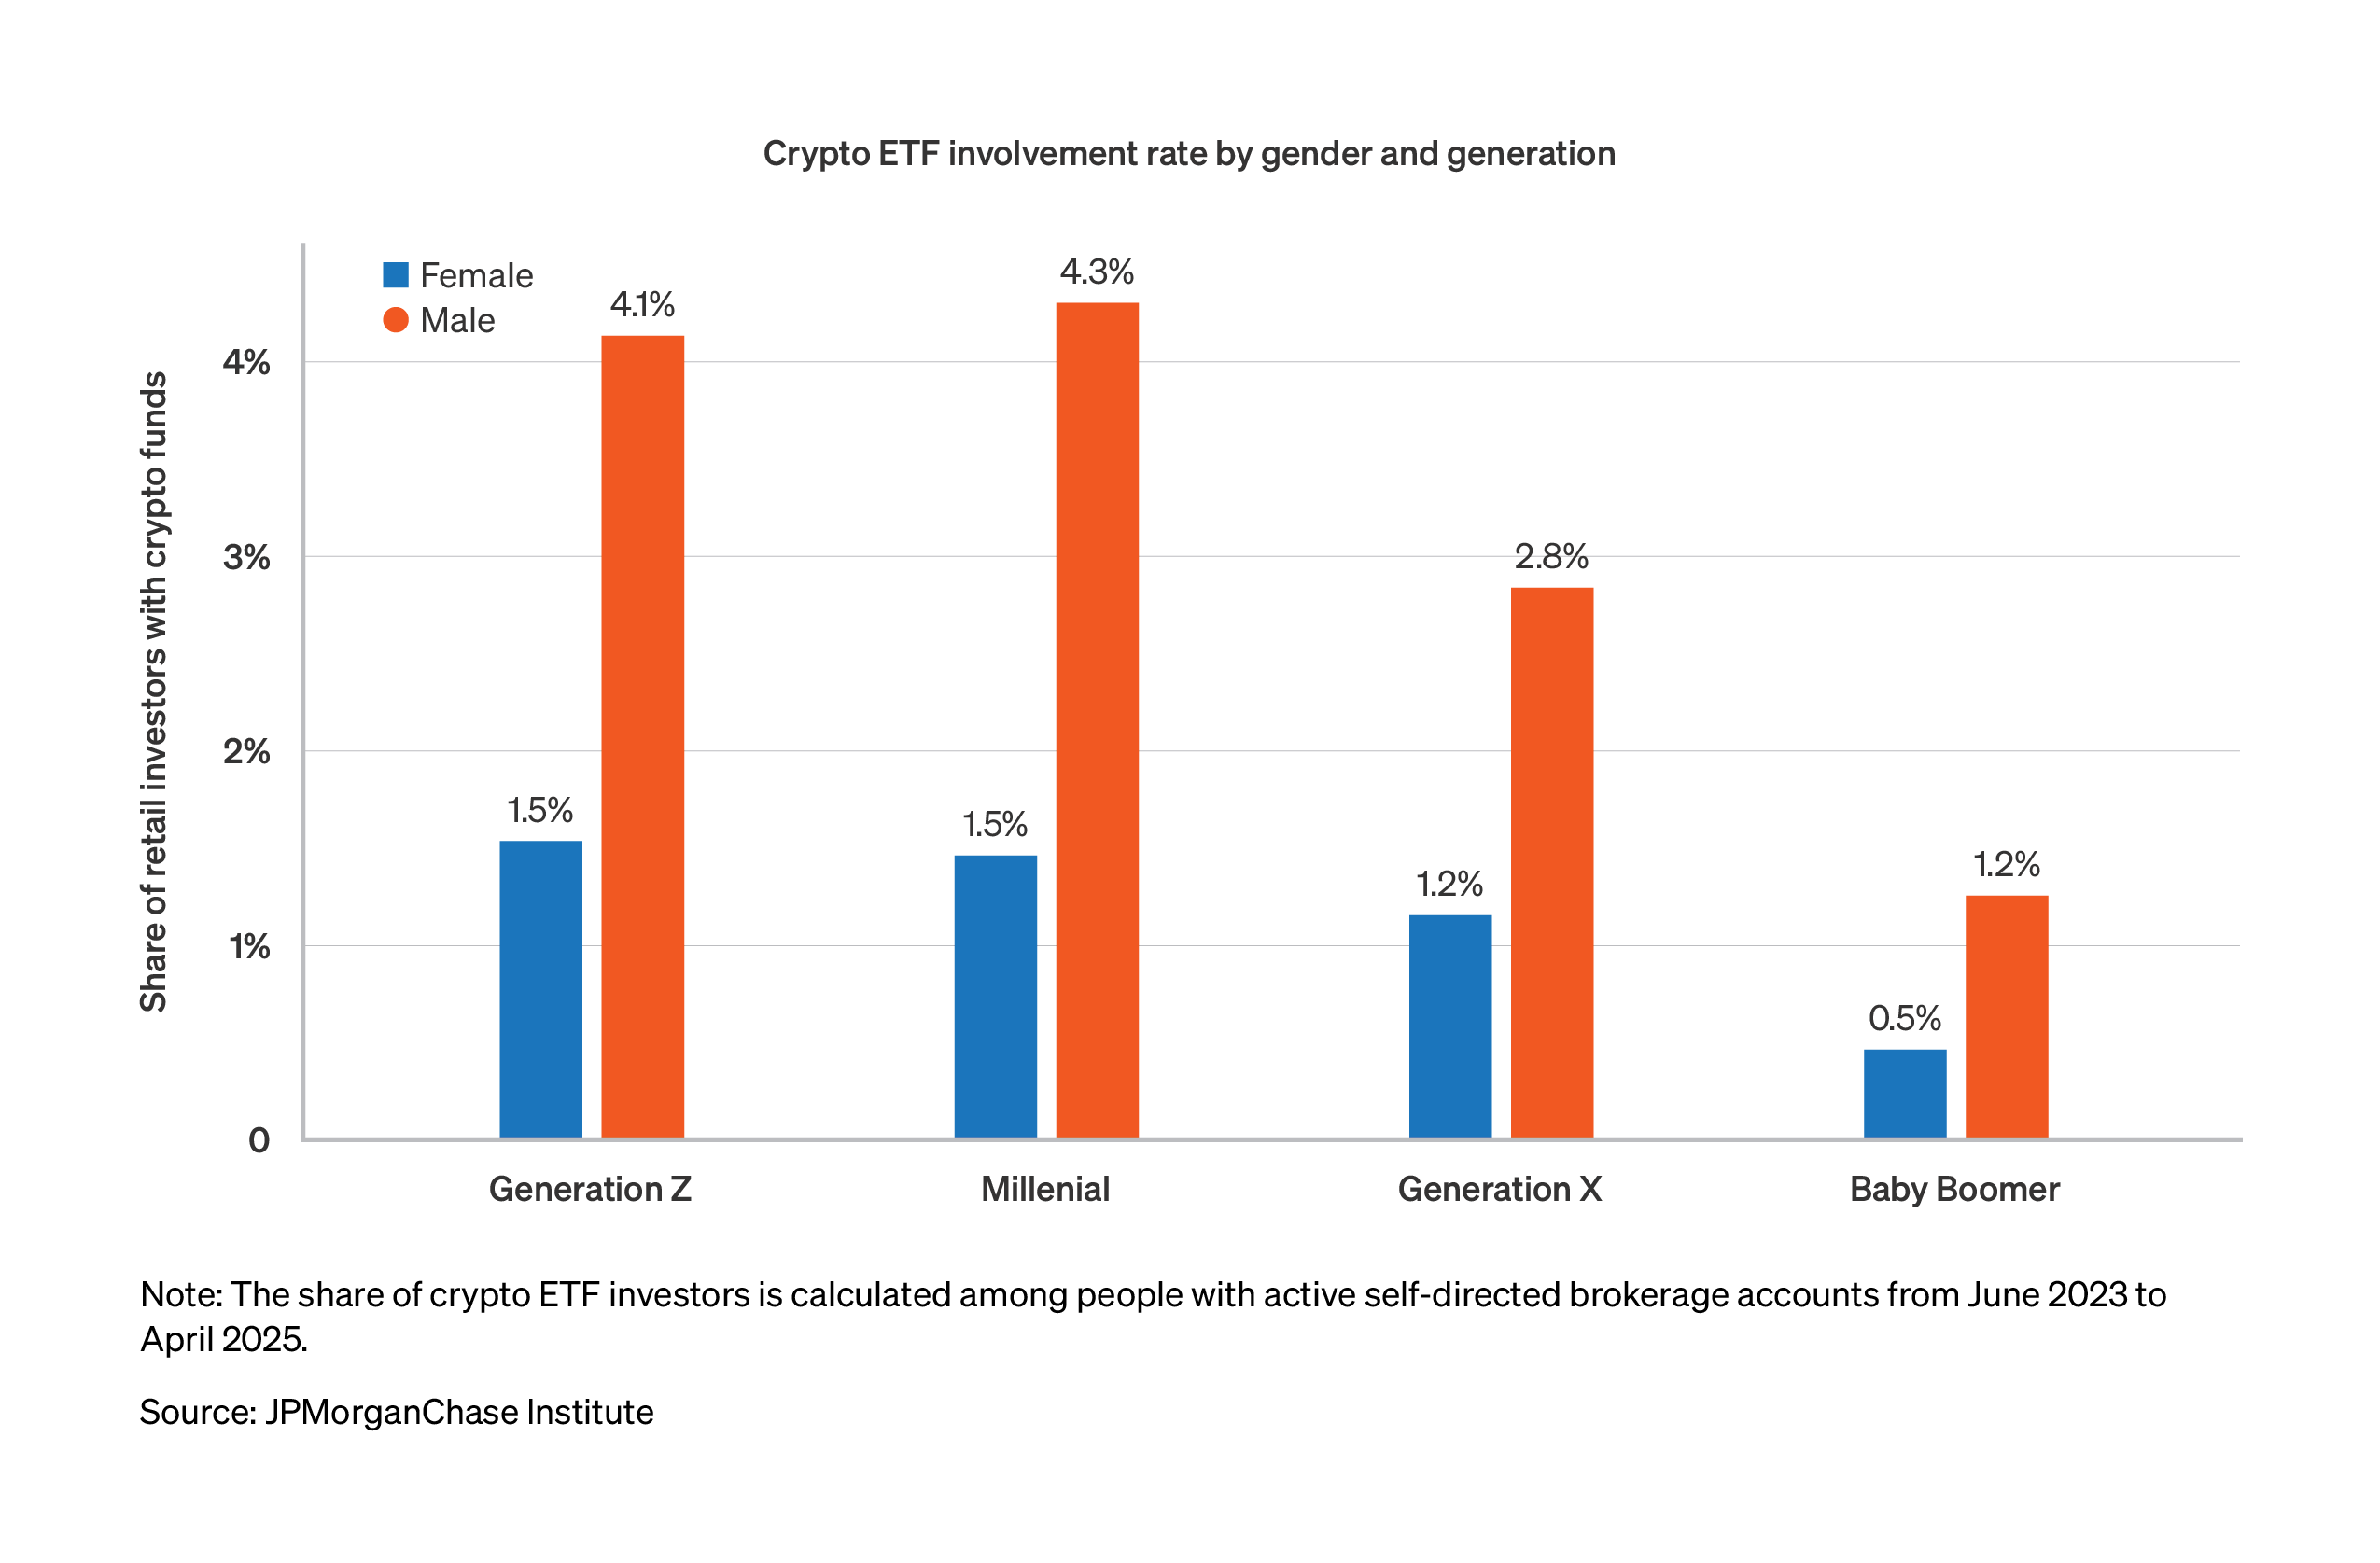
The demographic pattern of crypto ETF holdings is similar to that observed in direct crypto engagement, with higher participation rates among high-income individuals, younger generations, and men. The gender difference is more pronounced for crypto ETFs, where the involvement rate for men is about three times that of women.
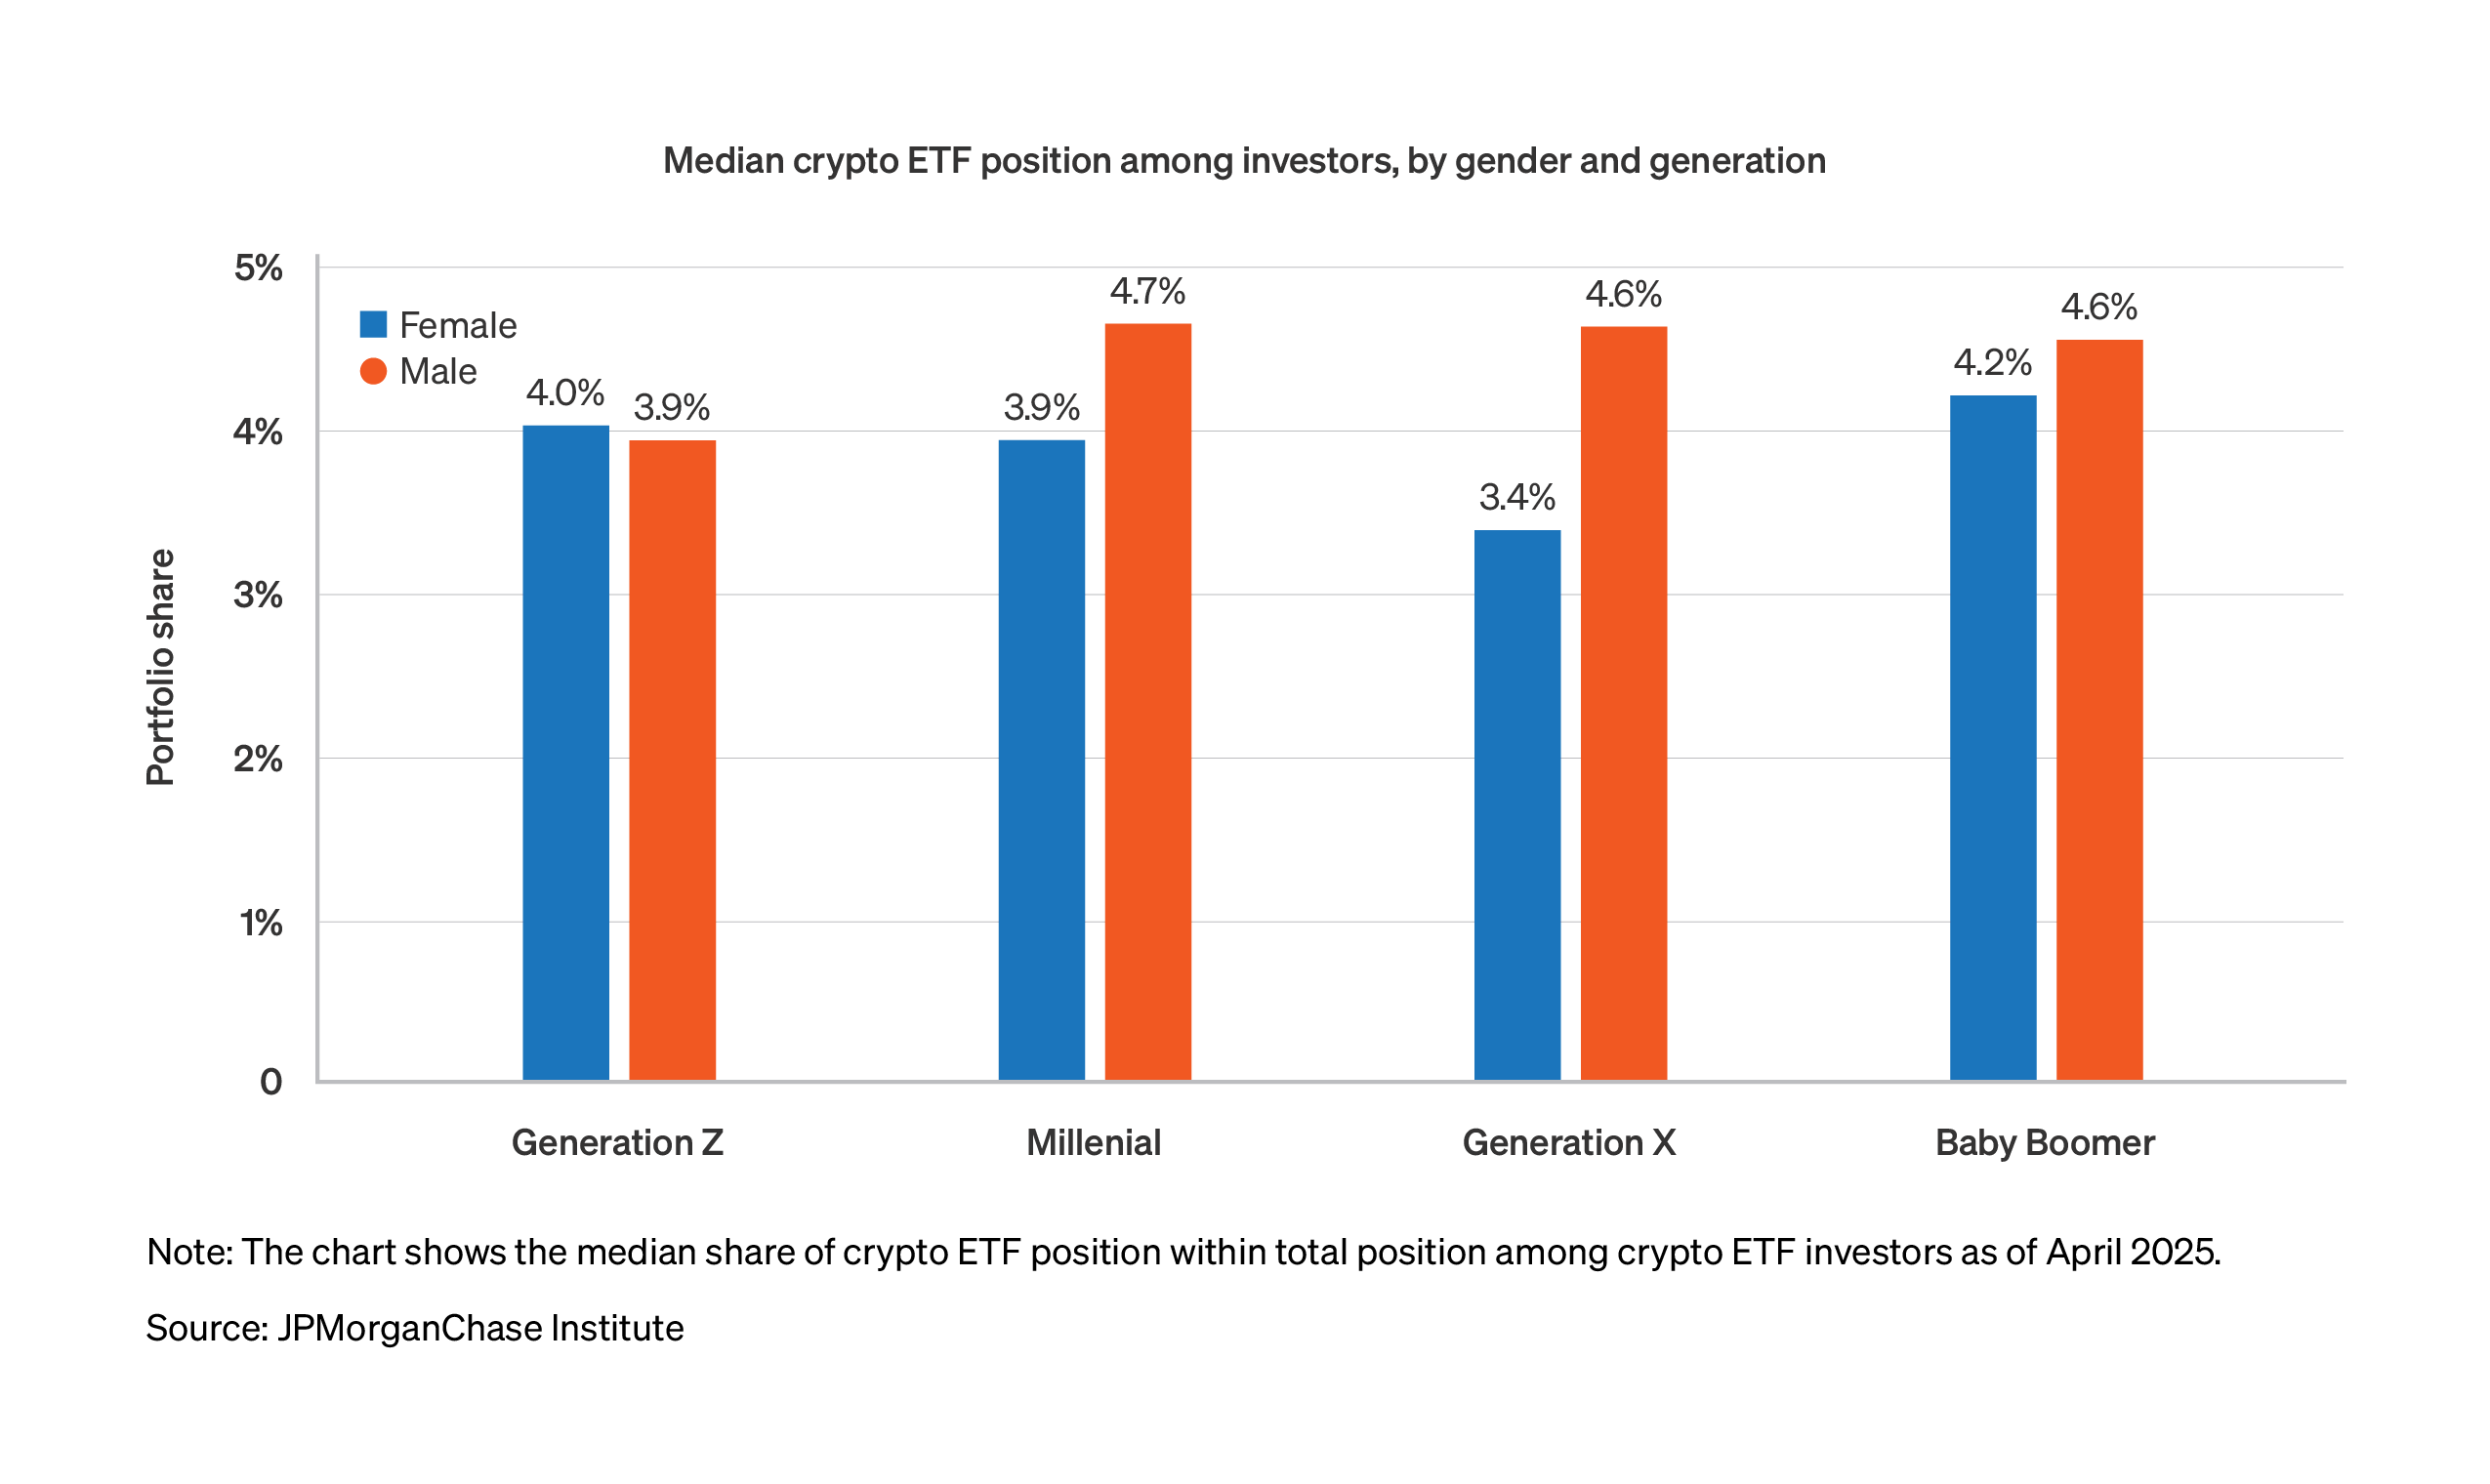
Figure 12 shows how much weight the typical crypto investor puts into such ETFs, scaled to portfolio size. Among those who hold crypto ETFs, the median allocation to crypto ETFs constitutes approximately four percent of their total portfolio value. Male investors tend to allocate a slightly higher proportion of their portfolios to crypto ETFs compared to female, except for Gen-Z.
Crypto use among U.S. households continued to expand in 2024 and early 2025, with notably higher flows in the wake of significant increases in the price of bitcoin to new all-time highs. However, the increase in flows and new entrant participation was on a smaller scale compared to the peak in market adoption in 2021.
The share of checking account users that made transfers to crypto investments was 17 percent, about half the proportion of those that made traditional investments. The median investment amount remains small, but about 20 percent of crypto investors have transferred at least one month’s worth of take-home pay into crypto accounts. Men and younger generations have higher participation rates in both direct crypto holdings and ETFs that track cryptocurrencies. Demographic differences of crypto users relative to the general population highlight the relevance of tailored financial education for people engaged in these markets.
The expansion of exchange-traded products that track cryptocurrencies has almost certainly attracted individuals who previously lacked direct exposure to the market. However, only a small share of our sample of retail investors with self-directed accounts had crypto holdings, and the portfolio share of such investments was limited, at 3−5 percent of assets. The growing incorporation of crypto assets within the regulatory framework may facilitate wider adoption over time.
These trends go beyond providing a snapshot of basic investment participation, as they also reveal how financial risk, access to financial assets, and behaviors about investments are concentrated among certain segments of the population. As digital assets become increasingly integrated into mainstream financial infrastructure, these findings reveal important implications for policy design, product development, and investor education. Crypto user demographics relative to the general population underscore the need for tailored regulatory frameworks that can protect investors and financial literacy to ensure potential investors understand the use of these financial products amid uneven exposure.
Wheat, Chris, George Eckerd. 2022. “The Dynamics and Demographics of U.S. Household Crypto-Asset Use.” JPMorganChase Institute. https://www.jpmorganchase.com/institute/all-topics/financial-health-wealth-creation/dynamics-demographics-us-household-crypto-asset-cryptocurrency-use
Wheat, Chris, and George Eckerd. 2024. “Returns-chasing and dip-buying among retail investors.” JPMorganChase Institute. https://www.jpmorganchase.com/institute/all-topics/financial-health-wealth-creation/returns-chasing-and-dip-buying-among-retail-investors
Wheat, Chris, and George Eckerd. 2024b. “The changing demographics of retail investors.” JPMorganChase Institute. https://www.jpmorganchase.com/institute/all-topics/financial-health-wealth-creation/the-changing-demographics-of-retail-investors
We thank our research team, especially Man Xu, for her contributions to the analysis. We are indebted to our internal partners and colleagues, who support delivery of our agenda in a myriad of ways and acknowledge their contributions to each and all releases.
This material is a product of JPMorganChase Institute and is provided to you solely for general information purposes. Unless otherwise specifically stated, any views or opinions expressed herein are solely those of the authors listed and may differ from the views and opinions expressed by J.P. Morgan Securities LLC (JPMS) Research Department or other departments or divisions of JPMorgan Chase & Co. or its affiliates. This material is not a product of the Research Department of JPMS. Information has been obtained from sources believed to be reliable, but JPMorgan Chase & Co. or its affiliates and/or subsidiaries (collectively J.P. Morgan) do not warrant its completeness or accuracy. Opinions and estimates constitute our judgment as of the date of this material and are subject to change without notice. No representation or warranty should be made with regard to any computations, graphs, tables, diagrams or commentary in this material, which is provided for illustration/reference purposes only. The data relied on for this report are based on past transactions and may not be indicative of future results. J.P. Morgan assumes no duty to update any information in this material in the event that such information changes. The opinion herein should not be construed as an individual recommendation for any particular client and is not intended as advice or recommendations of particular securities, financial instruments, or strategies for a particular client. This material does not constitute a solicitation or offer in any jurisdiction where such a solicitation is unlawful.
Wheat, Chris, and George Eckerd. 2025. “Crypto investor waves since 2017: What retail investor behavior reveals about digital asset adoption.” JPMorganChase Institute. https://www.jpmorganchase.com/institute/all-topics/financial-health-wealth-creation/crypto-investor-waves-since-2017-what-retail-investor-behavior-reveals-about-digital-asset-adoption
Authors

Chris Wheat
President, JPMorganChase Institute

George Eckerd
Wealth and Markets Research Director, JPMorganChase Institute
The female-male disparity in monthly transfers to traditional investment accounts was around 0.7 women to 1 man as of last year (Wheat and Eckerd, 2024b).
See “Statement on the Approval of Spot Bitcoin Exchange-Traded Products,” SEC Chair Gary Gensler, January 10, 2024.
Traditional investment accounts here refer to widely used retail investment platforms that provide access to stocks, ETFs, and other securities that do not specialize in crypto assets. Given our focus on checking account transfers, these figures mainly capture investing activity outside of employer-sponsored retirement plans.
The relative involvement rate is the share of sample investing in crypto of one group divided by the share of another group. Parity between groups would be a relative involvement rate equal to one. Each plot shows the share of the segment with lower participation divided by the share with higher participation, so a rise over time can be interpreted as declining demographic concentration.
Media contact
Shelby Wagenseller, Shelby.Wagenseller@jpmchase.com