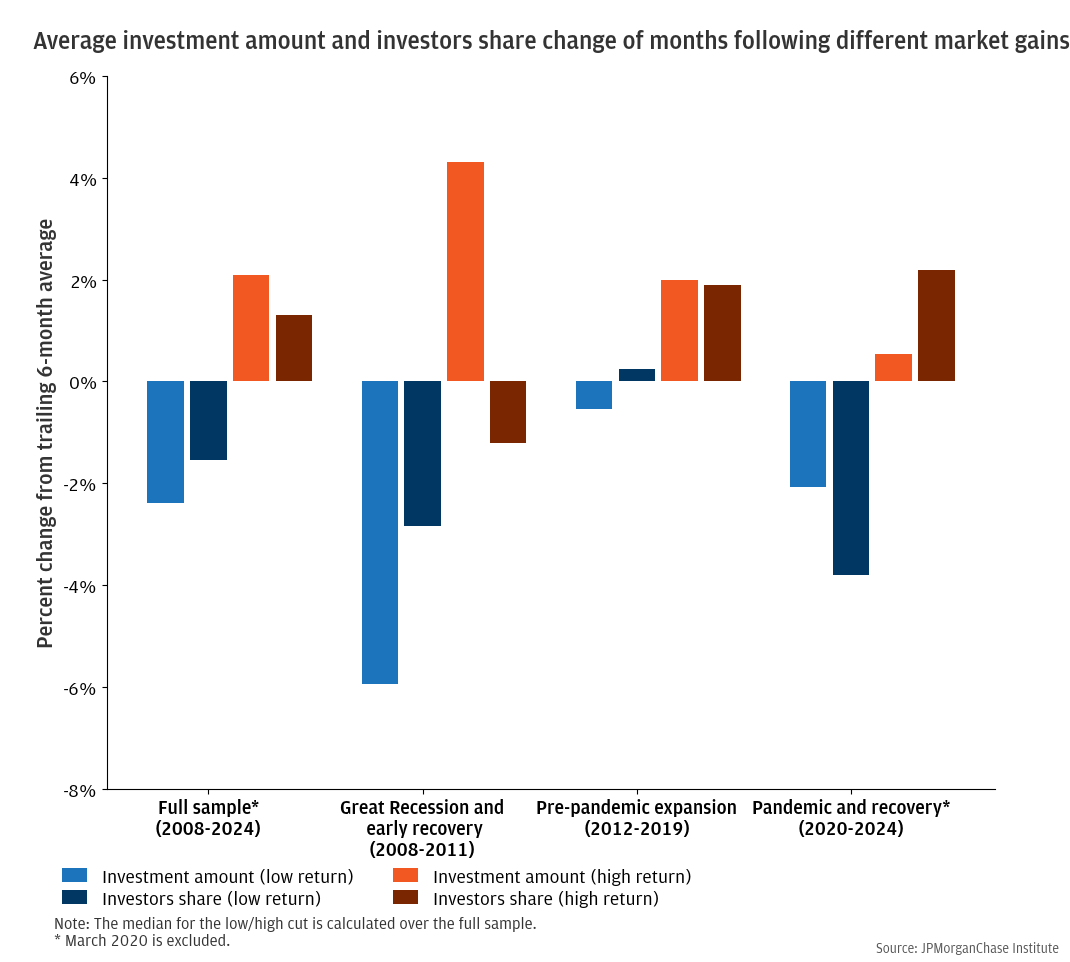
Figure 1: Individuals tend to transfer more money to investment accounts following periods of high market returns.

Research
October 1, 2024
Introduction
Why does retail investor participation in markets ebb and flow? An answer to this question could reveal whether households are prone to investing at excessive valuations around market peaks. It could also inform whether retail investment choices by households carry financial stability consequences for themselves or markets overall. An observer doesn’t have to look far to see suggestive evidence for such concerns: the share of U.S. households with stock holdings rose by over 40 percent from 1992 to 2001, according to the Federal Reserve’s Survey of Consumer Finances—a period of strong growth in stock prices and valuations punctuated with the internet bubble bursting.1 This share stagnated for two decades before rising in the late 2010s and finally reaching new highs after the pandemic. Higher frequency indicators like those used in this report2 show another layer behavior changes, with a large amount of variation in flows on a month-to-month basis (Wheat and Eckerd, 2024a).
Volatility in the use of financial markets as a savings vehicle is difficult to explain with fundamental drivers such as personal income growth and cash liquidity (Wheat and Eckerd, 2024a). Aggregate changes in household finances do not fluctuate enough to correspond to observed changes in our data on investing transactions, which we measure in this report by transfers from checking accounts to financial investments. In parallel, changes in traditional drivers of fundamental value are not sufficient to account for the degree of observed stock market volatility.3 We help bridge gaps between monthly variation in investing flows and stock market performance, finding statistical patterns that map price action to subsequent investor behavior.
This report is based on flows from checking accounts to external investment accounts using de-identified data covering over 10 million individuals from 2007 to April 2024. Importantly, the data centers on investing allocations out of take-home pay, a perspective that likely differs from more stable saving patterns exhibited in tax-advantaged retirement plans like 401(k)s. Our granular data allow for disaggregation by income level, age, and gender.
We find roles for both stock returns and volatility in driving monthly changes in financial investments out of take-home pay. These investing flows tend to increase when market returns in the past three months have been elevated, suggesting a role for investor optimism or returns-chasing. Investing transfers also tend to rise in tandem with sharp increases in market volatility. Because increases in volatility usually coincide with stock market declines, the connection to volatility suggests “dip-buying” behavior. This a “faster” dynamic, in the sense that high volatility predicts a temporary increase in investment flows in the same month, whereas returns-chasing is a more lagged, multi-month relationship.
Statistically, variables comprising stock market returns and volatility (with distinct lags) can explain as much as 40 percent of variation in monthly investment transfers in our data. Stock market performance predicts larger swings in the aggregated flows of individuals who are lower-income, younger, and male. Importantly, the retail investing patterns we document represent an average of observations prevailing over 2008−2024. The relationships may change over time—along with the changing makeup of households participating in markets—and based on unique contextual factors that may prevail in any specific market event.
This report details three primary findings:
Findings
These patterns can stem from systematic biases in how market performance and volatility influences investor beliefs of future market performance. Biased beliefs imply a gap in understanding risk and return when putting individuals’ assets at risk and may merit attention from policymakers and practitioners concerned with household financial health. Moreover, this research suggests multiple potential channels of retail investor flows that interact with financial stability: first, returns-chasing suggests the potential for investor flows to exacerbate the extent of market upturns; and second, dip-buying may provide a temporary source of capital that could limit volatile market declines.4
Individuals move more money into investment accounts following sustained market gains.
Individuals are more likely to transfer money from their checking accounts to investment accounts after sustained increases in stock prices. Our analysis focuses on flows of all active users of Chase checking accounts to investment accounts, the same source used in earlier Institute research on retail investing: The rise in retail investing and The changing demographics of retail investors. For the overall sample and for three distinct economic periods, Figure 1 shows the near-term change in the dollar amount of investment transfers (the current month’s volume of transfers divided by the trailing six-month average), grouped by whether the lagged three-month S&P 500 price return was above or below 3.25 percent—its median from 2008 to early 2024. Over the full sample, investment flows are 5 percent higher in months following above-median returns relative to those with below-median trailing returns.5 The figure also shows how the share of consumers making transfers into investment accounts changes after periods of high or low market returns. The number of individuals making transfers increases by 3 percent when trailing market returns are above the median compared to months after weaker market gains.
Analysis of sub-periods shows moderately distinct dynamics across the different eras we study: Great Recession and early recovery (2008–2011), Pre-pandemic expansion (2012–2019), and Pandemic and recovery (2020–2024). We omit a very large outlier, March 2020, from these averages, as Finding 2 discusses dip-buying—which better explains this event—in a statistical framework that can handle multiple factors. The first sub-period showed significant dispersion by lagged stock market performance in dollar amounts invested: a decrease of 6 percent occurs after below-median returns, versus an increase of 4 percent after better returns. During the same period, the share of individuals transferring funds to investments was generally trending lower, with only a few percentage point smaller declines when lagged returns were above median. Over 2012–2019, differentiation by lagged returns was smaller, just a few percentage points, for both investment amounts and investor shares. The dynamics of investor shares tracked lagged market performance more strongly during the pandemic and recovery (2020–2024): a 6 percent gap across the two return buckets compared to a lower difference in means of 2 percent in the two earlier sub-periods.
Figure 1: Individuals tend to transfer more money to investment accounts following periods of high market returns.

Intuitively, the total amount of money moved into investment accounts tends to track the number of people making them. However, differences between the measures provide a lens as to whether investing flows are primarily driven by the extensive margin (the number of people moving money) or the intensive margin (the average non-zero flow amount per investor). Total flows are a product of the two. Sustained growth in the investing population over the past decade has decreased disparities in stock market participation between high- and low-income individuals (Wheat and Eckerd 2024a). Since individuals with lower incomes have smaller amounts to invest in a given month, behavioral patterns that primarily influence investors with relatively low incomes show up more in investor share terms than in total amounts (we discuss differences by income and demographic groups in Finding 3).
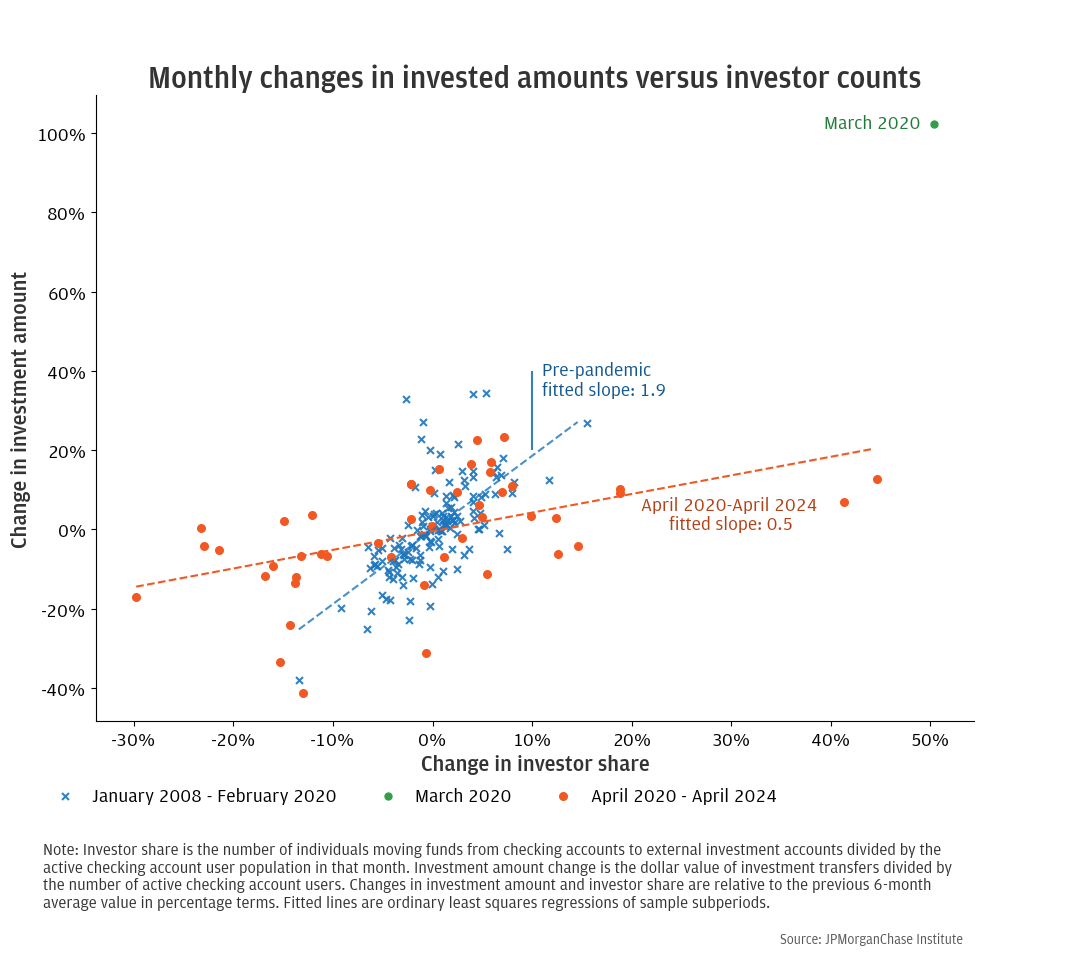
The increased variation in investor shares grouped by lagged stock market returns since the start of the pandemic (depicted in Figure 1), suggests that trend-chasing in retail investing flows has been increasingly driven by shifts in the extensive margin. That is, a greater share of the population is deciding whether to invest out of take-home pay each month, and the outcome is correlated with past market returns. This contrasts with trend-chasing dynamics in earlier periods, which featured changes in flows driven (relatively more) by adjustments of a smaller, more regular set of investors. This trait is apparent in Figure 2, which shows monthly investment amount changes (vertical axis) against monthly investor share changes (horizontal axis). Data from April 2020 to April 2024 reflect a noticeably flatter slope than the pre-pandemic relationship, a decline from 1.9 to 0.5. A given investor share change has corresponded to a much smaller percent change in dollar amount invested since the pandemic, on average. The break appears to occur around March 2020 (a notable outlier in Figure 2), the month that kicked off the pandemic surge in disposable income, savings, and investing, all of which were more pronounced for lower-income individuals (Wheat and Eckerd, 2024c and Wheat et al., 2024).
Figure 2: Changes in the monthly share of individuals investing have become more volatile relative to monthly changes in the amount invested since the pandemic.
Sharp market volatility—including those associated with large market declines—can spur large increases in transfers to investment accounts.
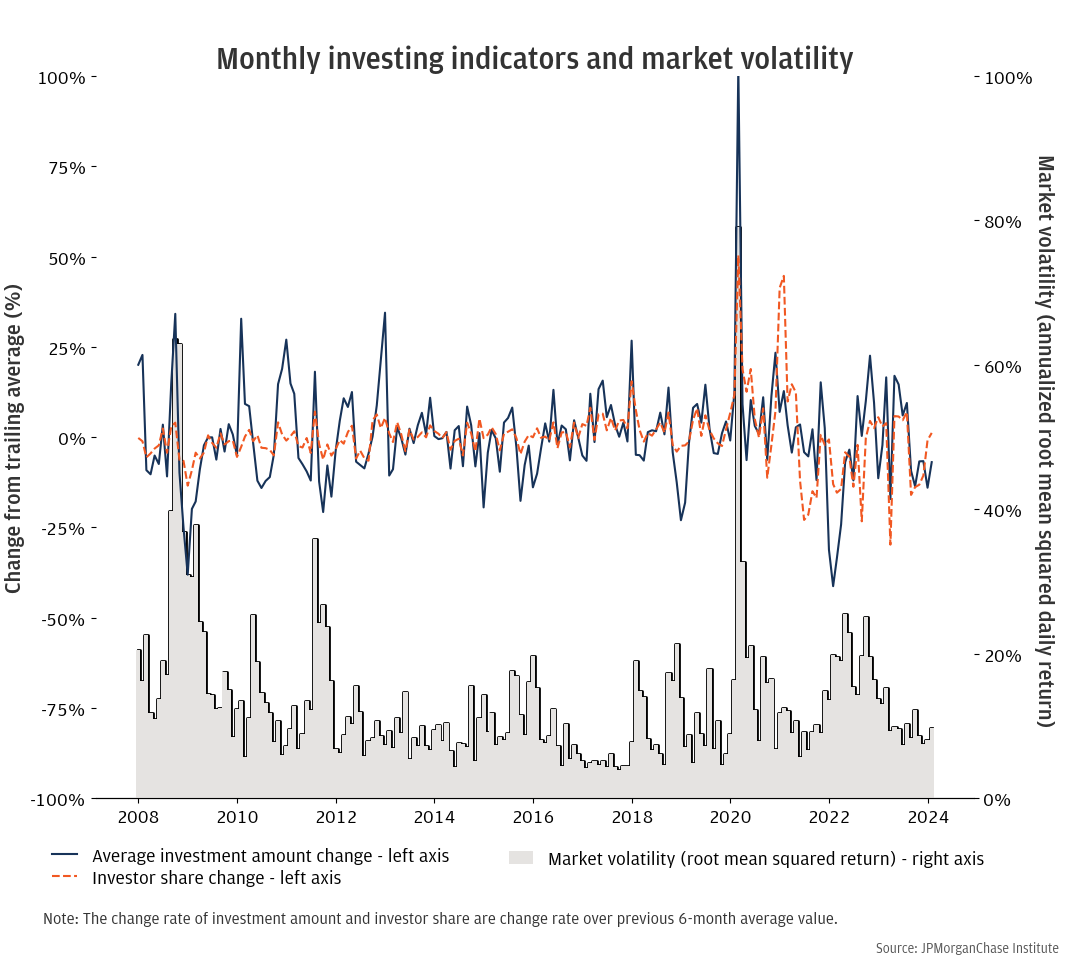
Increases in flows from checking accounts to investment accounts often coincide with heightened market volatility. Loosely speaking, the U.S. stock market has exhibited long and comparatively stable periods of increasing value, punctuated by short and volatile periods of decline.6 As a result, the periods with the highest volatility are generally periods of market decline. In our sample, the most notable volatility peaks were after the September 2008 collapse of Lehman Brothers during the Global Financial Crisis and during the onset of COVID-19 in March 2020, a month in which major stock indices fell by over 30 percent. These two events featured the largest monthly percentage increases in the amounts of money individuals transferred from checking to investment accounts.
Relative to returns-chasing behavior described in Finding 1, the tendency for volatility to attract large increases in investing activity is a faster-moving dynamic. The correlation between higher volatility (or negative returns) and higher flows is within the same month in our data, as opposed to strictly lagged. We use a regression framework to test two measures of return-chasing and two measures of dip-buying as predictors of investment flow changes across three models. In Model I, we measure returns-chasing using the lagged three-month return, based on prior work that found that previous three months of market returns explained most of the variance in transfers to investment accounts (Farrell and Eckerd, 2021). Model I captures dip-buying using contemporaneous month returns, which results in the expected negative coefficient but is not statistically significant (other specifications show significant results). In Model II, we measure the effect of dip-buying by using contemporaneous month volatility within the same month rather than contemporaneous returns. Model III replaces the three-month lagged returns with an optimally weighted lagged return, which uses a statistical method that employs two parameters to “fit” lagged returns to the data. The model uses the MIDAS method from earlier research (Ghysels et al., 2007; Farrell and Eckerd, 2021), resulting in weights on lagged returns depicted in Appendix I, in place of the trailing three-month return. Model IV captures the non-linearity of dip-buying using the contemporaneous month variance.
Figure 3: More retail investors shifted more money to investment accounts during extreme market volatility episodes (2008 Financial Crisis and COVID-19 onset in March 2020), while smaller volatility spikes occasionally led to investing changes.
|
Full sample (2008-2024) |
High vol. (2008-2011, 2020-2024) |
Low vol. (2012-2019) |
|||||||||
|
1 |
2 |
3 |
4 |
1 |
2 |
3 |
4 |
1 |
2 |
3 |
4 |
Return-chasing |
|
|
|
|
|
|
|
|
|
|
|
|
Lagged 3-month return |
0.397*** |
0.778*** |
|
|
0.368** |
0.937*** |
|
|
0.644*** |
0.535*** |
|
|
|
(0.13) |
(0.22) |
|
|
(0.15) |
(0.26) |
|
|
(0.19) |
(0.21) |
|
|
Optimally weighted lagged return (MIDAS) |
|
|
1.476*** |
1.152*** |
|
|
1.705*** |
1.207*** |
|
|
1.410*** |
1.393*** |
|
|
|
(0.33) |
(0.18) |
|
|
(0.34) |
(0.24) |
|
|
(0.27) |
(0.27) |
Dip-buying |
|
|
|
|
|
|
|
|
|
|
|
|
Contemporaneous month return |
-0.340 |
|
|
|
-0.447 |
|
|
|
0.122 |
|
|
|
|
(0.41) |
|
|
|
(0.50) |
|
|
|
(0.34) |
|
|
|
Contemporaneous month volatility |
|
0.592* |
0.782** |
-0.654** |
|
0.879** |
1.129*** |
-0.466 |
|
-0.398* |
-0.416** |
-0.031 |
|
|
(0.34) |
(0.32) |
(0.26) |
|
(0.37) |
(0.32) |
(0.42) |
|
(0.22) |
(0.20) |
(0.75) |
Contemporaneous month variance |
|
|
|
2.249*** |
|
|
|
2.090*** |
|
|
|
-1.747 |
|
|
|
|
(0.45) |
|
|
|
(0.60) |
|
|
|
(3.29) |
Intercept |
-0.001 |
-0.088* |
-0.124*** |
0.010 |
-0.001 |
-0.156*** |
-0.204*** |
-0.019 |
-0.013 |
0.028 |
0.007 |
-0.010 |
|
(0.01) |
(0.05) |
(0.05) |
(0.03) |
(0.02) |
(0.06) |
(0.06) |
(0.05) |
(0.01) |
(0.03) |
(0.02) |
(0.04) |
R-squared |
0.063 |
0.168 |
0.259 |
0.400 |
0.062 |
0.271 |
0.372 |
0.453 |
0.102 |
0.130 |
0.242 |
0.243 |
N |
194 |
194 |
194 |
194 |
98 |
98 |
98 |
98 |
96 |
96 |
96 |
96 |
Note: The table shows OLS regression results using monthly data. The dependent variable is changes in investment flows from the trailing 6-month average. Standard errors are in parentheses and are heteroskedasticity robust. * p<.1, ** p<.05, ***p<.01 |
||||||||||||
With both lagged return and contemporaneous volatility as explanatory variables, the regression model on average investment amount change has an R-squared value of up to 40 percent for the full sample, and slightly higher for observations during the more volatile 2008−2011 and 2020−2024 sub-periods. The investment amount change is positively correlated with lagged return (returns-chasing) and high levels of contemporaneous volatility (dip-buying). Lagged stock market gains of 10 percent translate into increases in investment flows between 4 and 15 percent, depending on model specification. Meanwhile, contemporaneous market declines and volatility correspond to higher flows, but the relationship is more nuanced and described further below.
During the low volatility period (2012−2019), there are no extreme spikes in volatility to the range where we see dip-buying become a statistically relevant factor. In Model III, the coefficient on volatility is positive and statistically significant only for the overall sample and the high-vol sub-periods, not the low volatility period (2012−2019). In Model IV, which allows for a more nonlinear relationship, the variance term (volatility squared) has a positive and statistically significant coefficient in the full sample, while the volatility term has a negative sign. The results therefore suggest that only quite high levels of volatility correlate positively with retail investment flows.
We use an analogous methodology to predict the portion of our checking account sample that makes significant transfers to investment accounts in a given month. The estimated impact of our key metrics is similar (see Appendix II for detailed regression estimates). The monthly investing population share is positively correlated with lagged return and contemporaneous volatility, with a somewhat lower R-squared of 20 percent for the full sample and 27 percent for the high volatility period. In sum, more individuals transfer more money to investment accounts following market gains and/or during elevated volatility.
Market price action has a more pronounced relationship with the investment dynamics of investors that are male, below 40 years-old, or lower-income.
Return-chasing and dip-buying behaviors vary among gender, age, and income groups. We look at differences by demographic groups through the lens of the regression framework of the prior section, running the analysis by population subgroup. Figure 4 plots the main regression outputs, using the specification of Model II. We choose not to focus on Model IV here, despite its higher explanatory power, because the inclusion of two terms for volatility in that regression would complicate comparisons.
In terms of making new financial investments, male investors are more responsive to market returns and volatility—i.e., the coefficients are higher—during high volatility episodes, while during more placid economic environments, we see no notable gender differences. Indeed, earlier research (Farrell and Eckerd, 2021) using data from the period of limited volatility from October 2013 to February 2020 found that the responses of investment flows among men and women were about the same. However, the extended time series used in this analysis reveals differences by gender in investing dynamics during the high volatility of the Global Financial Crisis and during the pandemic.
Figure 4: Regression output shows investment flows of men are more sensitivity to market price action than women, particularly during periods of elevated volatility.
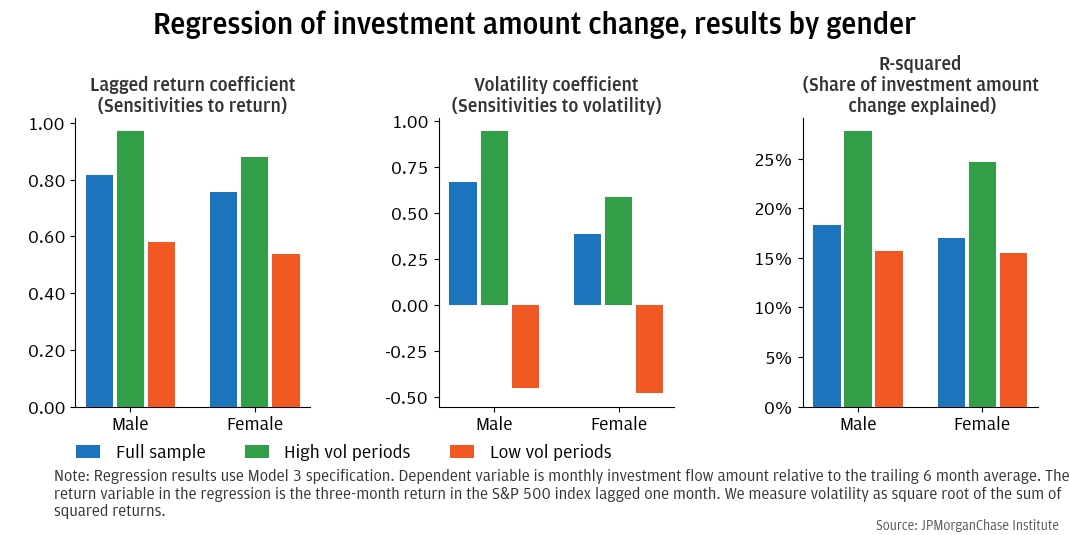
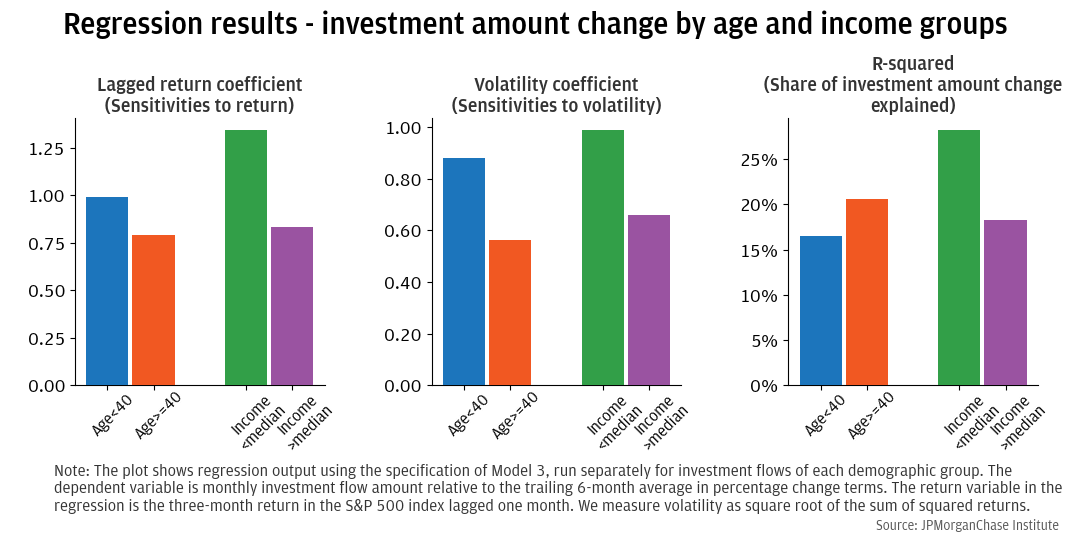
Figure 5 shows investment flow regression output for age and income breakouts. Younger and lower-income investors exhibit larger average responses to market returns and volatility (i.e., higher regression coefficients), and for lower-income investors market price action carries more explanatory power (higher regression R-squared) than higher-income investors. The flows of investors below 40, however, have more unexplained variation, potentially due to differences in noise across age groups in the data or systematic relationships with factors not included in our simple specification.
Figure 5: Investment flows of younger individuals and those with lower incomes have a higher average response to market moves, in percentage terms, although their flow data reflect more unexplained volatility.
Differences between demographic groups in our analysis provide suggestive evidence of herdlike behavior that spreads unevenly across the population. Earlier research on retail investing in crypto-assets (Wheat and Eckerd, 2022) found relationships that echo what we see here: investing activity in crypto over 2017−2022 exhibited trend-chasing patterns and heavier levels of participation among young men. While the present report does not attempt to estimate potential effects on investment returns, the earlier analysis indicated that individuals with lower incomes and less education likely invested in cryptocurrencies at relatively elevated prices, disadvantaging their returns on invested wealth.
Conclusion and implications
Research summary
We track the connection between stock market performance and month-to-month changes in transfers to investment accounts. Past market gains draw more money into the market during booms. Occasional spikes in volatility associated with market downturns also predict increases in investing transfers in the same month. The price-flow correlations we measure have distinct frequencies: strong stock market gains sustained over a three-month period are significantly correlated with increases in flows in the following month, whereas sharp increases in volatility tend to correspond to an increase in flows within the same month. Together, lagged and contemporaneous stock market performance explain up to 40 percent of monthly variation in investment flows in our sample, with somewhat higher explanatory power during the Great Recession and COVID. In terms of differences across the population, regression coefficients indicate stronger responses to market price action among men, younger investors, or those with lower incomes.
Implications
Patterns of investor behavior documented in this analysis can inform policymakers and professionals engaged in financial advising on the potential motivations or psychological biases of retail investors. The consequences of the dynamics highlighted in this report have risen relative to prior decades, given the increased role of the stock market in wealth accumulation of a broader portion of the population. Policies oriented towards sustainable wealth accumulation should take into account the revealed behavioral tendencies described in this report.
The connection between lagged gains and flows implies retail investors could be prone to invest at excessive valuations if fundamentals like future profit growth don’t keep pace with market prices. Academic research has found some evidence of investors “extrapolating” past market moves into expectations of the future.7 Conversely, rushing to buy stocks at the first sign of weakness can result in losses if new negative news for stocks is only partially impounded into prices, which can be the case if beliefs are anchored on previous, stale narratives. Similarly, other academic work has considered this underreaction bias, finding some evidence in financial markets.8 This report suggests a substantial potential role for these biases in explaining retail investor behavior, without taking a stand on the underlying biases in beliefs themselves.
Additionally, policymakers concerned with financial stability can use these findings. The positive connection between rising stocks and rising flows could lead to “feedback loops,” if market gains and flows reinforce each other. At the same time, during periods of extreme market distress—e.g., pandemic volatility in March 2020 and the Lehman aftermath in October 2008—retail investors have also shifted funds into financial investments, at least temporarily (sustained price declines eventually predict decreases in flows). These precedents suggest that, in some cases, households in the aggregate may take advantage of temporary dips in valuations and, in-hindsight, may have provided liquidity at times when it is scarce.
Appendix I: Optimal lagged returns using the MIDAS method
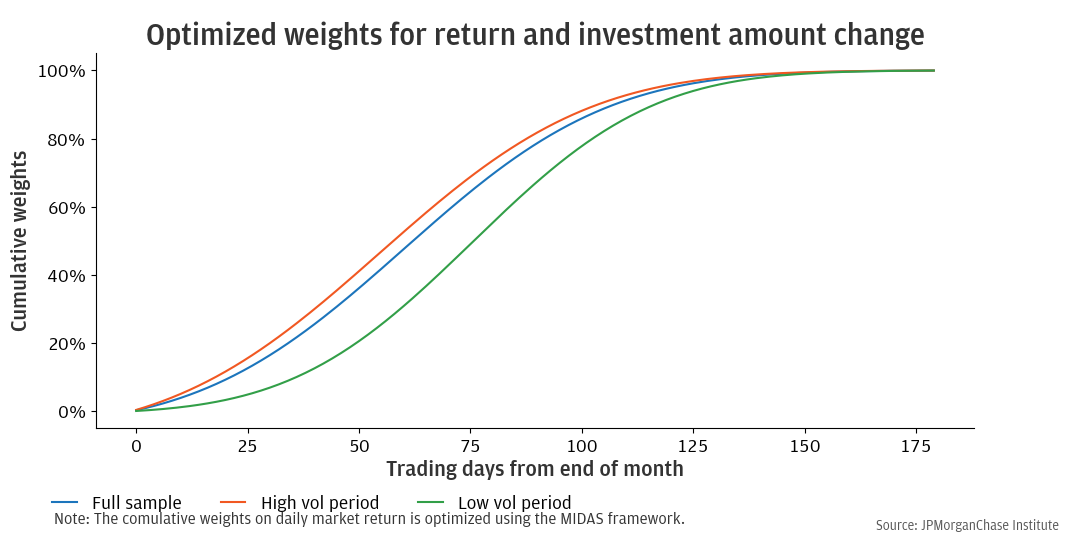
Figure A1 depicts the weights on lagged returns computed by the MIDAS method that appear in Models III and IV. For the full sample and high vol periods, the optimized weights place the majority of the emphasis on returns between 40 and 80 trading days (2–4 months) prior to month-end (the average calendar month contains a little over 20 trading days). The low vol period of 2012–2019, features a slightly longer lag: the majority of the weight is on returns lagged 60 to 100 days (3–5 months).
Figure A1: Optimized weights for return and investment amount change
Appendix II: Regression estimates
This section presents regressions analogous to those in Finding 2 with percent changes in investor share—i.e., the portion of our active checking account users transferring funds to investment accounts—as the dependent variable. The results are qualitatively similar to the regressions for investment amount changes, but the R-squared for respective specifications are lower.
|
Full sample (2008-2024) |
High vol. (2008-2011, 2020-2024) |
Low vol. (2012-2019) |
|||||||||
|
1 |
2 |
3 |
4 |
1 |
2 |
3 |
4 |
1 |
2 |
3 |
4 |
Return-chasing |
|
|
|
|
|
|
|
|
|
|
|
|
Lagged 3-month return |
0.211** |
0.425*** |
|
|
0.194* |
0.535*** |
|
|
0.221*** |
0.238*** |
|
|
|
(0.09) |
(0.12) |
|
|
(0.11) |
(0.15) |
|
|
(0.08) |
(0.07) |
|
|
Optimally weighted lagged return (MIDAS) |
|
|
0.953*** |
0.700*** |
|
|
1.212*** |
1.164*** |
|
|
0.425*** |
0.443*** |
|
|
|
(0.25) |
(0.16) |
|
|
(0.24) |
(0.26) |
|
|
(0.10) |
(0.11) |
Dip-buying |
|
|
|
|
|
|
|
|
|
|
|
|
Contemporaneous month return |
-0.088 |
|
|
|
-0.090 |
|
|
|
-0.116 |
|
|
|
|
(0.21) |
|
|
|
(0.27) |
|
|
|
(0.13) |
|
|
|
Contemporaneous month volatility |
|
0.329** |
0.493*** |
-0.023 |
|
0.514*** |
0.756*** |
0.642* |
|
-0.005 |
-0.013 |
-0.394 |
|
|
(0.16) |
(0.17) |
(0.18) |
|
(0.17) |
(0.16) |
(0.34) |
|
(0.09) |
(0.08) |
(0.38) |
Contemporaneous month variance |
|
|
|
0.781*** |
|
|
|
0.145 |
|
|
|
1.738 |
|
|
|
|
(0.30) |
|
|
|
(0.43) |
|
|
|
(1.66) |
Intercept |
-0.002 |
-0.049** |
-0.080*** |
-0.029 |
-0.009 |
-0.099*** |
-0.147*** |
-0.133*** |
0.005 |
0.004 |
0.000 |
0.017 |
|
(0.01) |
(0.02) |
(0.03) |
(0.02) |
(0.01) |
(0.03) |
(0.03) |
(0.04) |
(0.00) |
(0.01) |
(0.01) |
(0.02) |
R-squared |
0.039 |
0.130 |
0.169 |
0.208 |
0.029 |
0.203 |
0.269 |
0.270 |
0.105 |
0.095 |
0.139 |
0.147 |
N |
194 |
194 |
194 |
194 |
98 |
98 |
98 |
98 |
96 |
96 |
96 |
96 |
|
Male |
Female |
||||
|
Full sample |
High vol. |
Low vol. |
Full sample |
High vol. |
Low vol. |
Intercept |
-0.096* |
-0.159** |
0.028 |
-0.058* |
-0.102** |
0.037 |
|
(0.049) |
(0.067) |
(0.026) |
(0.031) |
(0.041) |
(0.025) |
Lagged 3-month return |
0.816*** |
0.970*** |
0.581*** |
0.756*** |
0.879*** |
0.540*** |
|
(0.238) |
(0.285) |
(0.209) |
(0.162) |
(0.187) |
(0.193) |
Contemporaneous month volatility |
0.669* |
0.948** |
-0.449* |
0.386* |
0.589** |
-0.479** |
|
(0.371) |
(0.411) |
(0.239) |
(0.228) |
(0.238) |
(0.222) |
R-squared |
0.183 |
0.277 |
0.157 |
0.169 |
0.246 |
0.154 |
N |
194 |
98 |
96 |
194 |
98 |
96 |
|
Below 40 |
Over 40 |
||||
|
Full sample |
High vol. |
Low vol. |
Full sample |
High vol. |
Low vol. |
Intercept |
-0.126** |
-0.214** |
0.04 |
-0.081** |
-0.133** |
0.023 |
|
(0.062) |
(0.084) |
(0.038) |
(0.041) |
(0.057) |
(0.021) |
Lagged 3-month return |
0.992*** |
1.168*** |
0.826*** |
0.790*** |
0.929*** |
0.548*** |
|
(0.300) |
(0.350) |
(0.296) |
(0.198) |
(0.238) |
(0.168) |
Contemporaneous month volatility |
0.881* |
1.260** |
-0.631* |
0.563* |
0.796** |
-0.369** |
|
(0.466) |
(0.505) |
(0.345) |
(0.312) |
(0.346) |
(0.183) |
R-squared |
0.165 |
0.264 |
0.164 |
0.206 |
0.297 |
0.167 |
N |
194 |
98 |
96 |
194 |
98 |
96 |
|
Below med. |
|
Over med. |
|
||
|
Full sample |
High vol. |
Low vol. |
Full sample |
High vol. |
Low vol. |
Intercept |
-0.134** |
-0.228*** |
0.031 |
-0.095* |
-0.161** |
0.028 |
|
(0.057) |
(0.077) |
(0.020) |
(0.049) |
(0.067) |
(0.026) |
Lagged 3-month return |
1.341*** |
1.612*** |
0.786*** |
0.831*** |
0.978*** |
0.639*** |
|
(0.277) |
(0.330) |
(0.164) |
(0.232) |
(0.276) |
(0.208) |
Contemporaneous month volatility |
0.988** |
1.392*** |
-0.381** |
0.658* |
0.943** |
-0.439* |
|
(0.435) |
(0.470) |
(0.174) |
(0.367) |
(0.405) |
(0.235) |
R-squared |
0.282 |
0.382 |
0.222 |
0.183 |
0.279 |
0.167 |
N |
194 |
98 |
96 |
194 |
98 |
96 |
Barberis, Nicholas, Andrei Shleifer, and Robert Vishny. "A model of investor sentiment." Journal of Financial Economics 49, no. 3 (1998): 307-343. https://doi.org/10.1016/S0304-405X(98)00027-0
Bordalo, Pedro, Nicola Gennaioli, Rafael La Porta, and Andrei Shleifer. "Belief overreaction and stock market puzzles." Journal of Political Economy 132, no. 5 (2024): 1450−1484. https://doi.org/10.1086/727713
Daniel, Kent, David Hirshleifer, and Avanidhar Subrahmanyam. "Investor psychology and security market under‐and overreactions." The Journal of Finance 53, no. 6 (1998): 1839−1885. https://doi.org/10.1111/0022-1082.00077
Ghysels, Eric, Arthur Sinko, and Rossen Valkanov. 2007. “MIDAS Regressions: Further Results and New Directions.” Econometric Reviews, 26(1): 53−90.
Greenwood, Robin and Andrei Shleifer. "Expectations of returns and expected returns." The Review of Financial Studies 27, no. 3 (2014): 714−746. https://doi.org/10.1093/rfs/hht082
LeRoy, Stephen F. and Richard D. Porter. "The present-value relation: Tests based on implied variance bounds." Econometrica: Journal of the Econometric Society (1981): 555−574. https://doi.org/10.2307/1911512
Ozik, Gideon, Ronnie Sadka, and Siyi Shen. “Flattening the Illiquidity Curve: Retail Trading During the COVID-19 Lockdown.” Journal of Financial and Quantitative Analysis, forthcoming, May 2021. http://dx.doi.org/10.2139/ssrn.3663970
Shiller, Robert J. "Do stock prices move too much to be justified by subsequent changes in dividends?." (1981): 421−436.
Wheat, Chris and George Eckerd. 2024a. “The Rise in Retail Investing: Roles of the Economic Cycle and Income Growth.” JPMorganChase Institute. https://www.jpmorganchase.com/institute/research/financial-markets/the-rise-in-retail-investing-roles-of-the-economic-cycle-and-income-growth
Wheat, Chris and George Eckerd. 2024b. “The changing demographics of retail investors.” JPMorganChase Institute. https://www.jpmorganchase.com/institute/research/financial-markets/the-changing-demographics-of-retail-investors
Wheat, Chris and George Eckerd. 2024c. “The purchasing power of household incomes: Worker outcomes through July 2024 by income and race.” JPMorganChase Institute. https://www.jpmorganchase.com/institute/all-topics/financial-health-wealth-creation/the-purchasing-power-of-household-incomes-worker-outcomes-through-july-2024-by-income-and-race
Wheat, Chris, Erica Deadman, Daniel M. Sullivan. 2024. “Household Pulse: Balances through February 2024.” JPMorganChase Institute. https://www.jpmorganchase.com/institute/research/household-income-spending/household-pulse-balances-through-february-2024
We thank our research team, especially Man Xu, for their contributions to the analysis. We also thank Liz Ellis, Annabel Jouard, Oscar Cruz, and Alfonso Zenteno for their support. We are indebted to our internal partners and colleagues, who support delivery of our agenda in a myriad of ways and acknowledge their contributions to each and all releases.
We would like to acknowledge Jamie Dimon, CEO of JPMorganChase, for his vision and leadership in establishing the Institute and enabling the ongoing research agenda. We remain deeply grateful to Peter Scher, Vice Chairman, Tim Berry, Head of Corporate Responsibility, Heather Higginbottom, Head of Research & Policy, and others across the firm for the resources and support to pioneer a new approach contributing to global economic analysis and insight.
This material is a product of JPMorganChase Institute and is provided to you solely for general information purposes. Unless otherwise specifically stated, any views or opinions expressed herein are solely those of the authors listed and may differ from the views and opinions expressed by J.P. Morgan Securities LLC (JPMS) Research Department or other departments or divisions of JPMorgan Chase & Co. or its affiliates. This material is not a product of the Research Department of JPMS. Information has been obtained from sources believed to be reliable, but JPMorgan Chase & Co. or its affiliates and/or subsidiaries (collectively J.P. Morgan) do not warrant its completeness or accuracy. Opinions and estimates constitute our judgment as of the date of this material and are subject to change without notice. No representation or warranty should be made with regard to any computations, graphs, tables, diagrams or commentary in this material, which is provided for illustration/reference purposes only. The data relied on for this report are based on past transactions and may not be indicative of future results. J.P. Morgan assumes no duty to update any information in this material in the event that such information changes. The opinion herein should not be construed as an individual recommendation for any particular client and is not intended as advice or recommendations of particular securities, financial instruments, or strategies for a particular client. This material does not constitute a solicitation or offer in any jurisdiction where such a solicitation is unlawful.
Wheat, Chris, and George Eckerd. 2024. “Returns-chasing and dip-buying among retail investors.” JPMorganChase Institute. https://www.jpmorganchase.com/institute/all-topics/financial-health-wealth-creation/returns-chasing-and-dip-buying-among-retail-investors
Authors

Chris Wheat
President, JPMorganChase Institute

George Eckerd
Research Director for Wealth and Markets, JPMorganChase Institute
Footnotes
See interactive plot from the Survey of Consumer Finances linked here. The share of households with stock holdings, inclusive of retirement accounts, rose from 37 percent to 53 percent from 1992 to 2001 and did not exceed that level until 2022, when the share rose to 58 percent. The average value of the S&P 500 index in 1992 was approximately 415, and in 2000 it was 1425. The price index did not make new all-time highs until 2013.
The Federal Reserve Survey of Consumer Finance provides a comprehensive view of household wealth in the U.S., but it is fielded only once every three years.
Papers by Shiller (1981) and Leroy and Porter (1981) find that stock prices are too volatile to explain with information about future dividends, the traditional basis of stock market value. A number of subsequent papers have attempted to resolve the “excess volatility puzzle.” See for example Bordalo et al. (2020).
Due to data limitations, this report does not quantify the magnitude of flows linked to either returns-chasing or dip-buying relative to overall market volumes. Parker (2023) considers the rise in Target Date Funds in retirement accounts and finds evidence of an effect of these funds—which add money to stocks after declines and vice-versa in order to maintain stable portfolio composition—in limiting overall market volatility. See also Ozik et al. (2021).
The difference in means after above/below median stock returns is statistically significant, which we discuss further in a regression framework in Finding 2.
This relationship is enshrined in the negative relationship between the CBOE Volatility Index (VIX Index), a market-based indicator of near-term market volatility and daily returns of the S&P 500.
See Greenwood and Shleifer (2014).
Barberis, Shleifer and Vishnua (1998) and Daniel, Hirshleifer, and Subrahmanyam (1998) find cases of both under- and overreaction in markets, which operate at different time horizons.