Findings

For this JPMorgan Chase Institute report, we analyze granular administrative retail bank data to explore the relationship between the U.S. stock market and consumer behavior, notably consumption and investment. Our research provides a historical perspective that can help policymakers understand how market fluctuations may be transmitted to the real economy over relatively short time horizons. This report documents a correlation between credit card spending and stock returns that plays out over the course of just a few months. This relationship appears to be driven disproportionately by specific types of activity—notably, temporary spending spikes on credit cards—and investor status or gender.

In addition to spending patterns, we examine retail flows to investment accounts. These transfers suggest "returns chasing" behavior; they track lagged stock market changes with an R-squared of over 20 percent. In sum, procyclical behavior can be seen on both spending and investment fronts, and the magnitudes vary across gender and wealth indicators. Specifically, in our sample, credit card spending by men and investors was more responsive to stocks than that of women and non-investors. With respect to investment flows, gender differences were smaller; the sensitivity of male investment flows to market returns was only modestly above the estimate for women. Our data cover much of the period following the Great Recession, from 2012 through mid-2020. Importantly, we separate the COVID-crisis from the rest of the sample, to prevent outliers from this unique shock from driving the results. This perspective can help policymakers understand how dynamics play out within a business cycle and illuminate tradeoffs associated with short-term “management” of the cycle through markets. Since our sample is mainly limited to one economic expansion, we study separately how individuals’ spending and investment flows played out during the COVID shock to illustrate similarities and contrasts with the dynamics observed in the preceding years. The analysis can be summarized in the following four findings:

01

Consumer spending is responsive to stock market movements, led by spending bursts on credit cards.

In our credit card sample, a 10 percent rise in stock prices is associated with a rise in average spending of just under 1 percent. The effect is somewhat smaller, 0.8 percent, at the center of the spending change distribution, while the right tail of that distribution—characterized by spending increases of double or triple a person’s steady-state spending rate—is about two times as sensitive. The time horizon for this relationship is relatively short, with the stock market leading by less than 4 months.3 Over the period in question, the relationship is not seen for spending via checking accounts or changes in individuals’ labor income, suggesting that consumer credit availability or the state of households’ liquid assets may play a role in mediating the relationship between stocks and the economy.

Line graph describes sensitivity of credit card spending changes to stock market returns

Line graph which displays the regression-predicted effect of stock market returns on the distribution of individual-level credit card spending changes related to their typical levels. Estimates are presented at 5 percentage point intervals from the 5th to 95th quantiles of that distribution along the x-axis, as well as the coefficient for the mean spending change as a dotted line just under 1.0 percent. Higher estimates for the upper quantiles imply that the right tail of the distribution (characterized by spending "splurges" of two to three times a person's usual spending level) moves by more than the middle and lower end of the distribution following stock market changes.

Source: JPMorgan Chase Institute

01

The spending response to stock market movements is stronger for customers identified as male investors than for non-investor men and for women.

Following stock market changes, the median of the distribution of spending by male investors shifts by about 10 percent more than female non-investors, but this gap increases to about double at the 95th percentile. The higher sensitivity for male investors is consistent with a wealth effect interpretation of the stock market-spending correlation, although labor market differences between genders may also be at play. Heterogeneity in our estimates implies that the short-term connection between the stock market and households is amplified by large changes from narrow segments and is less broad-based than suggested by aggregate spending. As such, the macro-financial relationship is subject to change with shifts in the structure of the economy, including inequality, credit availability, and shifting preferences.

Line graph describes sensitivity of credit card spending changes to stock market returns, by investor-gender groups

Line chart showing the regression-predicted effect of stock market returns on the distribution (by quantile) of individual-level credit card spending changes relative to their typical level by category: male investors, female investors, male non-investors, and female non-investors. The spending response to stock market movements is stronger for customers identified as male investors than for all other categories. Following stock market changes, the median of the distribution of spending by male investors shifts by about 10 percent more than female non-investors, but this gap increases to about double at the 95th percentile.

Source: JPMorgan Chase Institute

01

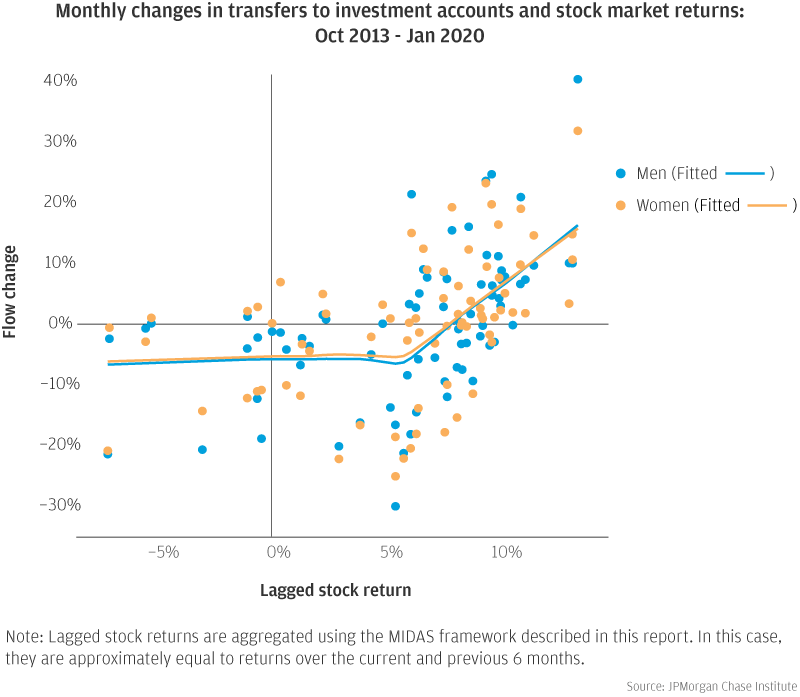
Flows into investment accounts are notably sensitive to changes in the stock market—a 10 percent rise in stocks translates to a short-term increase in the magnitude of transfers of over 10 percent for both men and women—showing a pattern of returns chasing.

These sensitivities are much larger than those observed for spending, as are the correlations. The number of people transferring net funds to their investment accounts also increases with stock market gains, suggesting an element of herding behavior among retail investors. In our data, the relationship is asymmetric; stock market gains predict stronger flows to investment accounts, but stock market losses have little average effect.

Line graph describes monthly changes in transfers to investment accounts and stock market returns: Oct 2013 - Jan 2020

Scatterplot showing monthly changes in transfers to investment accounts and lagged stock returns (aggregated using the MIDAS framework described in this report; in this case, they are approximately equal to returns over the current and previous six months). Plot shows for both men (blue dots) and women (orange dots). Flows into investment accounts are notably sensitive to changes in the stock market—a 10 percent rise in stocks translates to a short-term increase in the magnitude of transfers of over 10 percent for both men and women, showing a pattern of returns chasing.

Source: JPMorgan Chase Institute

01

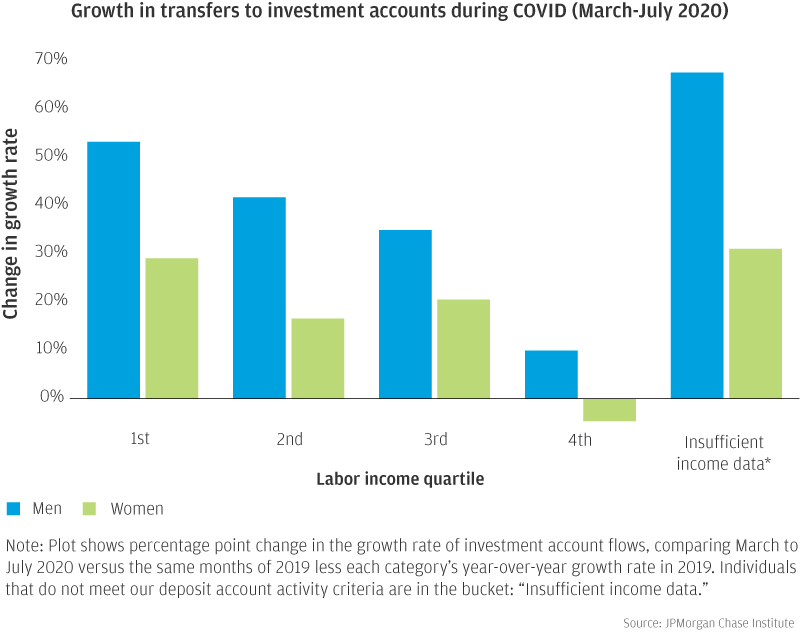
The COVID shock to the economy, which strongly dampened consumer spending, resulted in a large spike in transfers to investment accounts, especially for men.

This rise in household investments is consistent with the aggregate increase in the personal savings rate starting in March 2020. The increase in the growth rate of investment flows in the several months following the COVID national emergency was about two times stronger for men than for women.

Bar graph describes growth in transfers to investment accounts during COVID (March-July 2020)

Bar graph showing the percentage point change in the growth rate of investment account flows for men (blue bars) and women (green bars) by labor income quartile, comparing March to July 2020 versus the same months of 2019 less each category’s year-over-year growth rate in 2019. Individuals that do not meet our deposit account activity criteria are in the bucket: “Insufficient income data.” The COVID-19 shock to the economy resulted in a large spike in transfers to investment accounts, especially for men, whose increase in growth rate of investment flows was about two times stronger than for women.

Source: JPMorgan Chase Institute

Implications

Our findings imply that policies seeking to exert control over business cycles via the stock market may be successful over short time horizons. However, stock market gains are associated with spending “splurges” on credit cards and flows into investment brokerage accounts, suggesting that stimulus aimed at supporting asset prices can come with costs in the form of households’ financial vulnerability. If gains in stock prices are not followed by an improving labor market, households that over-extend themselves in terms of credit card spending or equity market exposure would face risks. More research should be done to fully understand how credit availability and liquid assets may influence the breadth and intensity of households’ responses to market movements. Finally, heterogeneity in response to stocks across gender and investor status suggest that macro-financial linkages are likely to change over time, and rising inequality could narrow the segments of the population that respond directly to financial market changes.

Authors

Diana Farrell

Diana Farrell

Founding and Former President & CEO

George Eckerd

George Eckerd

Financial Markets Research Lead