
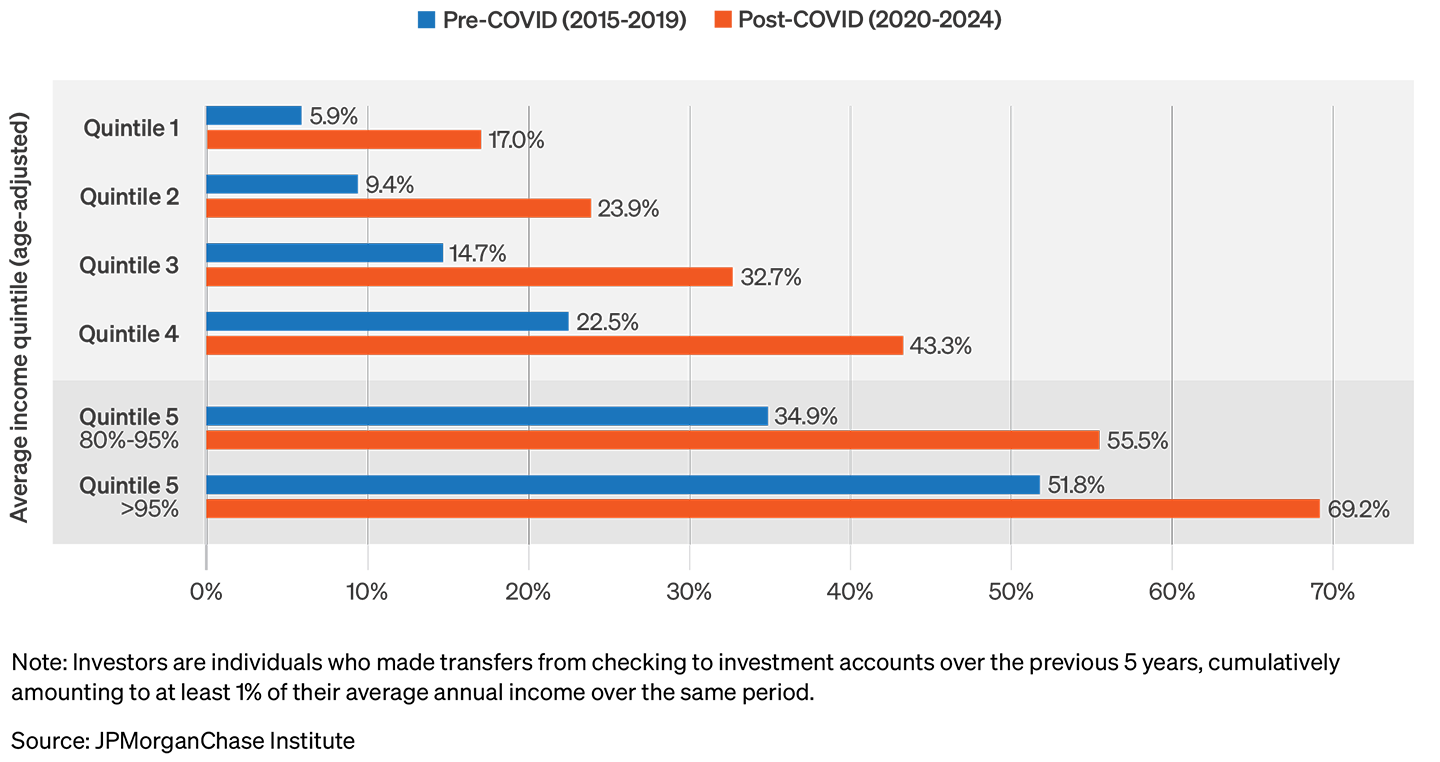
Figure 1: The increase in the investing since 2020 was most notable in percent terms for lower income individuals.

Creating thriving communities together
See how our clients and partners—from small business owners to workforce training leaders—work with JPMorganChase to drive meaningful impact and economic growth where they live and work.
Learn moreLatest news

Veteran’s Unconventional Path to Landing her Dream Job in Tech
U.S. Army Veteran Ashley Wigfall transitioned to a civilian role and charted her path to technologist through mentorship and skills training at the JPMorgan Chase tech hub in Plano, Texas.
Learn more
Research
A collaborative analysis by the JPMorganChase Institute and Commonwealth
March 24, 2026
The JPMorganChase Institute has tracked a sharp rise in retail investing in recent years, especially among younger and lower-income Americans. At the same time, the policy landscape is evolving. The “One Big Beautiful Bill” and proposed legislation1 promote new tax-advantaged ways for a broader part of the population to start building wealth through investing. As more households enter the financial markets, understanding the experience of new investors is increasingly important to ensure they can build wealth over the long term.
To help inform policymakers and industry leaders, the Institute partnered with Commonwealth, a nonprofit focused on building financial security and opportunity among those earning low and moderate incomes (LMI). This research effort builds on the existing JPMorganChase collaboration with Commonwealth, which includes a retail investing pilot with J.P. Morgan Wealth Management and our joint efforts to drive innovations in workplace benefits that help LMI Americans build long-term wealth. The Commonwealth team fielded a survey of new LMI investors in partnership with the BlackRock Foundation, which formed the basis of their Investor Diaries project that tracks individuals who started investing during or after the pandemic. Institute researchers worked with the Commonwealth team to generate insights from large-scale financial data to complement the survey findings. The joint research report is now available from Commonwealth.
As part of the collaboration, the Institute's analysis examined investing patterns over 2020-24, a period covering a large cohort of first-time investors' initial years engaging in financial markets driven by the pandemic savings boom. The research documents the shares of individuals funding investment accounts across income groups, the quantities transferred to investments, and how frequently individuals add money to their accounts.
The findings—based on deidentified transactions data covering 25 million active deposit account users—show new detail on investing across income levels. Substantial growth in engaging with financial markets among lower income individuals presents an opportunity for lasting improvement in their financial health. However, lower-income investors put a smaller share of their income into investments and do so less frequently than higher-income investors, suggesting the potential for significant growth. This piece covers the main takeaways from the Institute's contribution to the collaborative effort.
Implications of the analysis point to opportunities to build on the growing engagement of a new set of retail investors. Additionally, spreading and tailoring financial education to new investors can play a role in realizing lasting wealth accumulation opportunities through the growth of retail investing. Pairing this analysis with insights from the Commonwealth survey provides a more complete perspective on the growing population of investors than either could in isolation.
Investing increased during the pandemic and post-pandemic years, as covered in prior Institute research.2 Here, we detail the rise in the share investing for each income quintile, comparing the 2020-24 period to 2014-19. We define investors as individuals who transfer more than 1 percent of average annual income into investment accounts. Increases in the share of investors range from 11 to 21 percentage points, somewhat higher in percentage point terms for those with middle- and upper-middle incomes. Since the share of investors—both pre- and post-pandemic—tends to rise with income, the percent rise is notably larger for lower-income individuals: the share investing among bottom-income-quintile individuals rose by 150 percent, compared to about 50 percent for the highest quintile.3
This suggests investors with lower incomes are more likely to have limited investment experience: proportionally more of them started in the early 2020s, versus longer time horizons for higher-income investors.
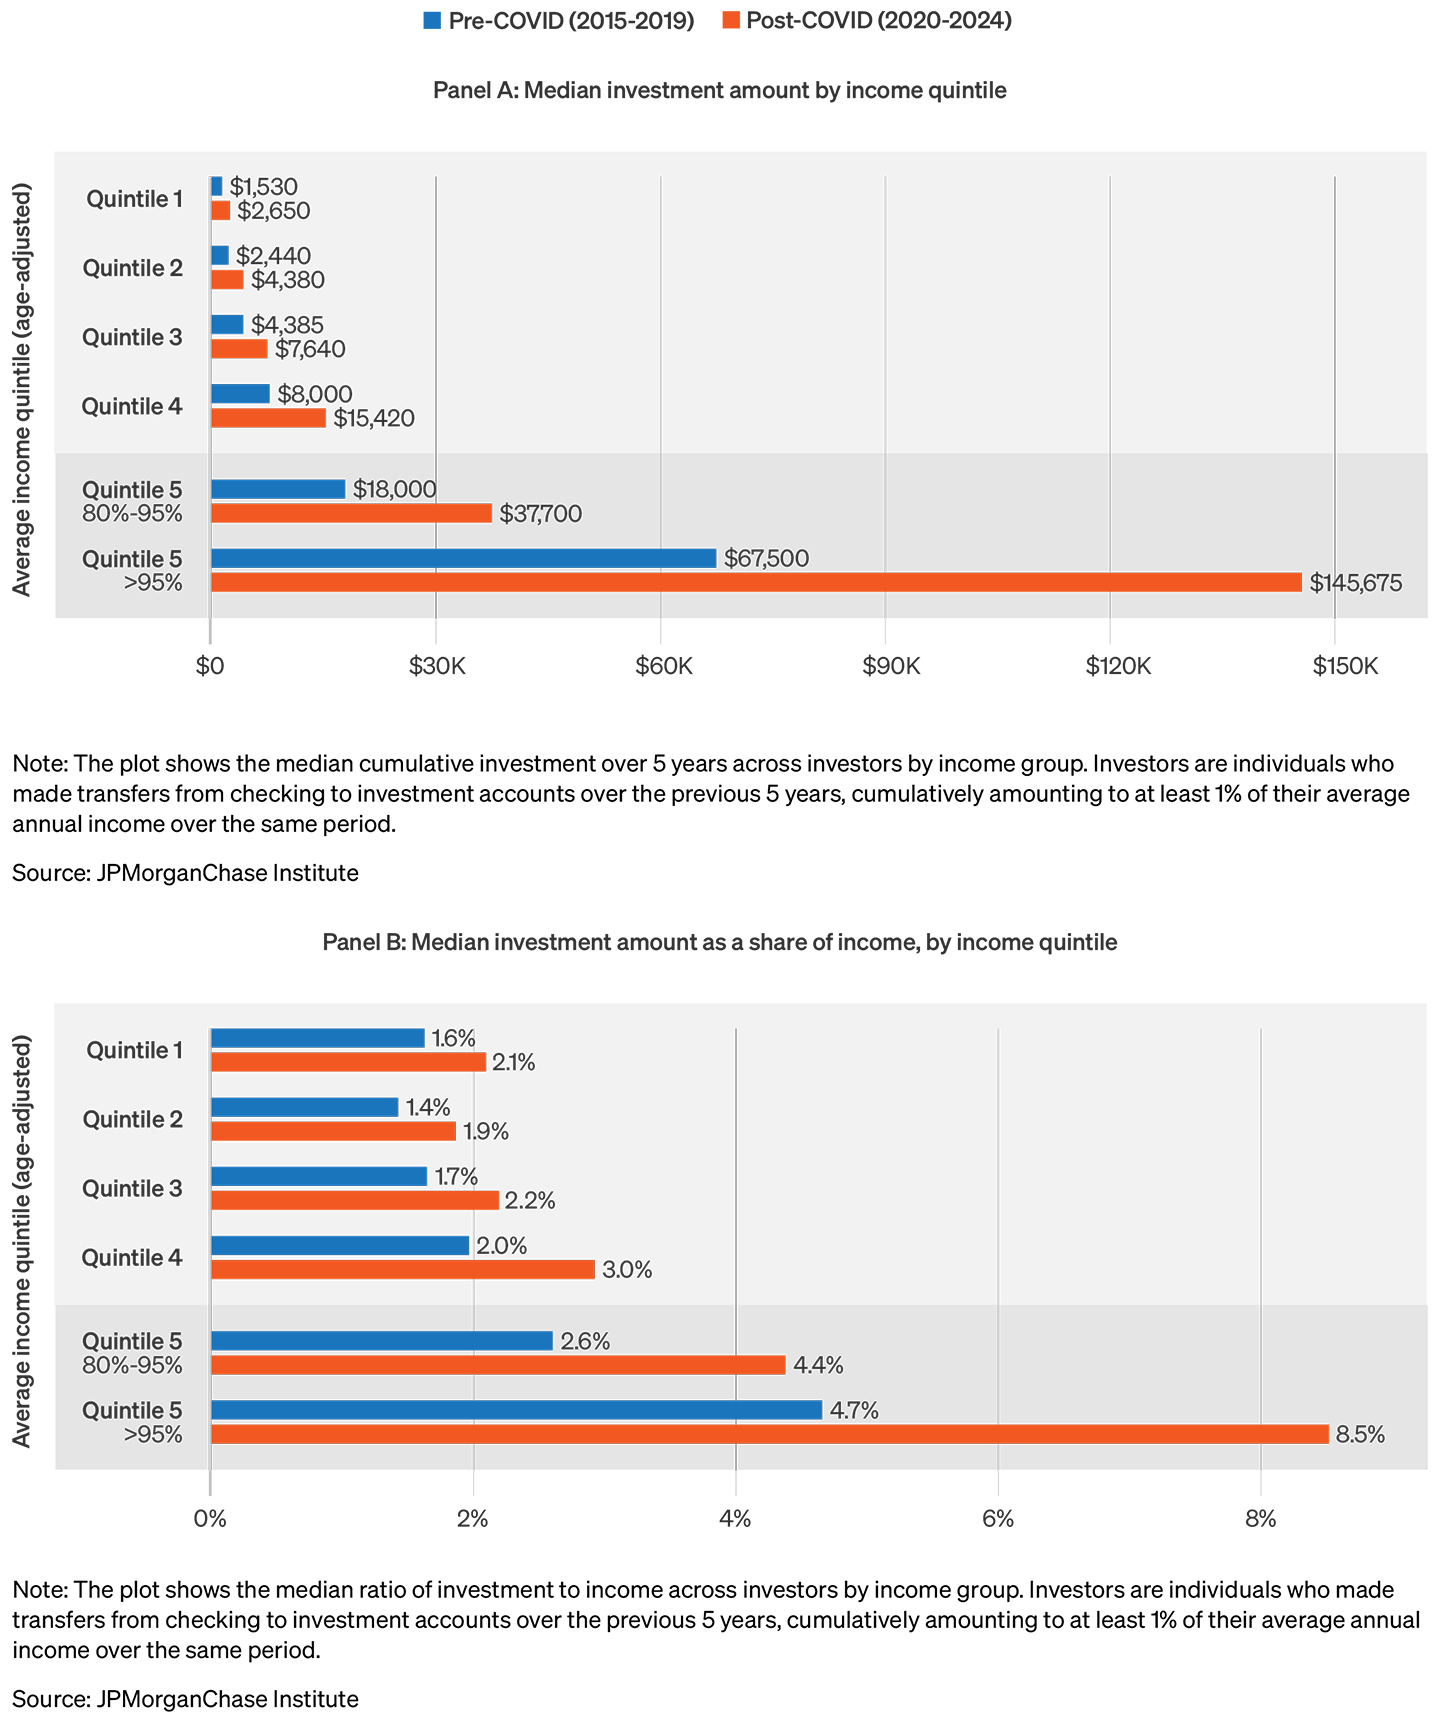
For people making investments, the median amounts moved into financial assets increased from the late 2010s to the early 2020s. This was true for each income group. However, the increase among those with higher incomes was greater, even when scaled to income.
Across the bottom three income quintiles, the median individual making investments transferred $2,650 to $7,640 into their accounts over 2020-24. This equates to about 2 percent of average annual take-home pay for the respective income groups, a 30 percent increase relative to income from 2014-19. For the highest earners—those at or above the 95th percentile of income—the amount invested relative to annual income was notably higher, at 8 percent over 2020-24, an increase of 80 percent from the 2014-19 share of income for that group.
Many investors do not add money to their taxable investment accounts every year, and only a small fraction invests every month. Figure 3 shows the share of investors investing at different frequencies in 2024 compared to 2019. We classify individuals as investors based on transfers to investment accounts at any point in the five-year window. For example, the share of investors with no investments in 2024 comprises people that had at least one investing transfer over 2020-23 and then none in 2024.
Lower-income investors were more likely not to add any funds to their investment accounts in both 2024 and 2019. For bottom-income-quintile individuals that have investment accounts, 57 percent of them did move additional money into them in 2024, compared to 41 percent for top-income-quintile investors. Automatic investing appeared to be limited to a small fraction of individuals in both years, but it was somewhat lower in 2024 than in 2019. In 2024, the share adding funds to investments every month of 2024 was only 4–6 percent across income groups, compared to 5–8 percent in 2019.
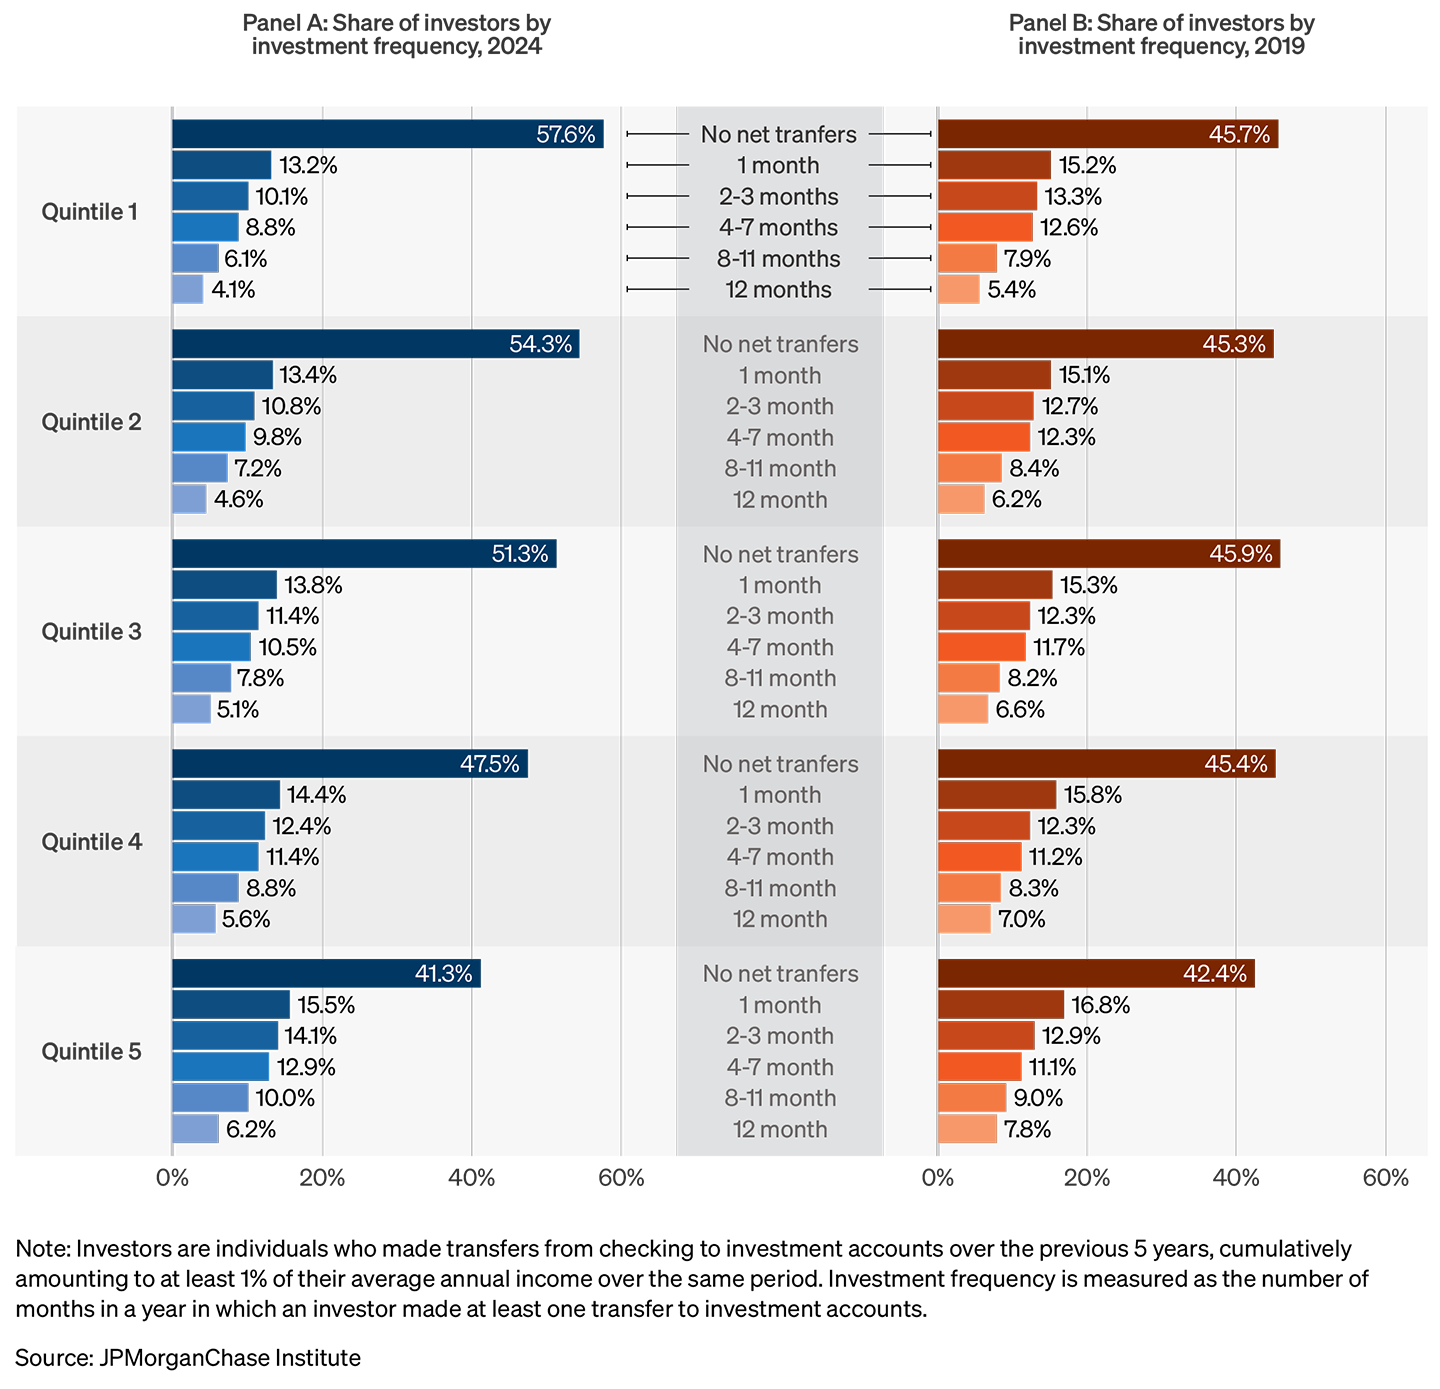
The apparent decline in investing frequency among investors from 2019 to 2024 may be a counterintuitive byproduct of the expansion of the set of investors to a significantly broader group of people. Those that may have been unlikely to invest during normal times received a powerful “nudge” during the pandemic savings boom, which led to a powerful temporary rise in household cash balances.4 Individuals induced to become investors due to that shock may be less likely to add money in subsequent years, relative to the average investor prior to the pandemic. Additionally, the aggregate savings rate was lower in 2024 compared to 2019, potentially dragging down the amount of investable cash after spending.5
These findings point to opportunities and challenges for the trend of investing among lower- and middle-income investors. The proliferation of investment account ownership since 2020 has lowered logistical barriers that might have historically held down investing among this population. At the same time, stock market ownership remains highly unequal: the top 20 percent by income own approximately 87 percent of stock market wealth.6 Growing the role of financial investing among the LMI population will take time, including sustaining engagement through market cycles. Insights into the experiences of the new entrants to the market—both from large scale financial data paired with insights from surveys—can inform policies, financial education, and products for the large number of investors earning lower and middle incomes with less investing experience.
Wheat, Chris, and George Eckerd. 2024. “The rise in retail investing: Roles of the economic cycle and income growth.” JPMorganChase Institute. https://www.jpmorganchase.com/institute/all-topics/financial-health-wealth-creation/the-rise-in-retail-investing-roles-of-the-economic-cycle-and-income-growth
Wheat, Chris, and George Eckerd. 2025. “A decade in the market: How retail investing behavior has shifted since 2015.” JPMorganChase Institute. https://www.jpmorganchase.com/institute/all-topics/financial-health-wealth-creation/a-decade-in-the-market-how-retail-investing-behavior-has-shifted-since-2015
Senators introduced the Retirement Savings for Americans Act of 2025 April 2025. Additionally, the Trump Administration has indicated support for legislation that would expand access to retirement savings accounts (See: Axios, “Trump announces new retirement plan at State of the Union,” 25 February 2026).
See Wheat and Eckerd (2025).
Median income in 2024 for people in each income quintile are as follows: Quintile 1: $29,192; Quintile 2: $51,491; Quintile 3: $73,707; Quintile 4: $106,067; Quintile 5 (80-95th percentile): $164,040; Quintile 5 (top-5 percent): $310,619.
Controlling for other factors, including income level, investors are more likely to add money to investment accounts when their cash liquidity is above their past average level (Wheat and Eckerd, 2024).
As of the second quarter of 2025, according to the Federal Reserve Board’s Distributed Financial Accounts.

George Eckerd
Wealth and Markets Research Director, JPMorganChase Institute