
Figure 1: Descriptive associations of BNPL use and financial indicators, by mortgage type
Latest news

An Ohio-based company is protecting first responders around the world
With support from JPMorganChase, Fire-Dex is providing protective equipment to firefighters in 100 countries and all 50 states.
Learn moreLatest news

Veteran’s Unconventional Path to Landing her Dream Job in Tech
U.S. Army Veteran Ashley Wigfall transitioned to a civilian role and charted her path to technologist through mentorship and skills training at the JPMorgan Chase tech hub in Plano, Texas.
Learn more
Research
March 3, 2026
Buy Now, Pay Later (BNPL) has grown quickly over the past few years. BNPL spending increased to $75 billion in 2023 from roughly $2 billion in 2019. Even with this growth BNPL still makes up a relatively small share of overall consumer credit.
About one in five consumers has used BNPL at least once in 2022 alone. BNPL usage is more common among younger consumers and individuals with lower credit scores, but it is present across all income and credit levels. Despite its growing popularity, a significant portion of these loans are not consistently reported to credit bureaus, especially Pay-in-4 loans. As a result, these loans often do not appear in traditional credit reports, making it more difficult to understand how BNPL fits into a consumer’s full financial picture, including its interaction with mortgage obligations. Because BNPL is deeply embedded in everyday shopping and its visibility in credit files is limited, understanding its role in household finances is increasingly important.
This report examines how homeowners use BNPL to manage their liquidity needs. Most BNPL users already carry other types of debt, particularly credit cards—and for homeowners, mortgage payments. Since mortgages are usually the largest and most difficult expense to adjust, we focus on how mortgage borrowers use BNPL to manage cash flow and meet their obligations over time.
Our findings suggest that BNPL has evolved beyond being merely a checkout convenience. For many homeowners, it has become a tool to smooth expenses, manage tight budgets, and bridge financial gaps during major life events.
Key findings
Buy Now, Pay Later (BNPL) loans have become an increasingly visible part of the consumer credit landscape. Recent research, including work by the Federal Reserve Bank of New York, indicates that BNPL serves distinct roles for different consumers. For financially fragile households, it often acts as a liquidity tool to manage short-term expenses, while financially stable households report using it as a convenient, interest-free payment option (Aidala et al., 2023). Regardless of the motivation, the sector has expanded rapidly. Reports show purchase volumes rose from roughly $2 billion in 2019 to over $75 billion by 2023 (CFPB 2022, Ngo 2024).
Even with this growth, BNPL remains small compared with mainstream credit products. In 2024, BNPL transaction volume was roughly 2.7 percent of large-bank consumer card purchase volume (Federal Reserve Bank of Philadelphia 2026; Broadbent 2025). Even at this comparatively smaller scale, BNPL now appears alongside credit cards and other liabilities in many household budgets as usage expands, and as borrowers take on larger loan amounts (CFPB, 2025).
As of 2022 about one in five consumers had used BNPL at least once (CFPB 2023). Several studies find that BNPL use is disproportionately concentrated among younger consumers and individuals with lower credit scores, though higher-income households also use BNPL (Aidala et al., 2023). Public surveys, including the CFPB and the Federal Reserve’s Survey of Household Economics and Decisionmaking (SHED), show rising BNPL awareness and usage, including among homeowners, but they lack the detailed information linking real-time BNPL activity to other debts in credit reports. Without comprehensive, standardized reporting, it remains difficult to determine how BNPL fits into consumers’ overall financial portfolios.
To address these gaps, recent industry efforts to add BNPL activity to the credit reporting system show both progress and limits. One large provider now furnishes BNPL loan data to credit bureaus, and FICO has announced models that incorporate BNPL payment history. However, reporting of short-term Pay-in-4 loans remains uneven across firms. By contrast, longer-term, interest-bearing BNPL loans, typically used for large durable purchases, are more frequently reported to bureaus (FICO 2025; Bomel 2025; Affirm Holdings 2025; Klarna Bank AB, 2024).1 Yet these developments are at an early stage, and reporting remains limited in scope. This limited visibility underscores the need to consider how households manage BNPL spending alongside other debts.
At the household level, most BNPL users carry other forms of debt, particularly revolving debt and, for homeowners, mortgage payments. In other words, BNPL is rarely used in isolation. This makes its interaction with other credit products important to monitor. Because mortgages are typically among the largest and least flexible expenses, we focus on how mortgage borrowers use BNPL to manage their cash flow and debt obligations over time.
Accordingly, in this report, we document how BNPL fits into the financial lives of homeowners. Through linked bank transactions and credit bureau data, we observe both mortgage payments and BNPL flows, allowing us to develop a portrait of BNPL usage across these mortgage segments. First, we document BNPL usage patterns across borrowers with government-insured and conventional mortgages. Second, we examine how BNPL use interacts with other forms of debt and cash flow measures in the face of liquidity shocks, such as a first-time home purchase and the onset of job loss. Finally, we assess whether more intensive BNPL use is associated with early-stage mortgage payment stress.
Our analysis relies on an analytical panel that links anonymized bank accounts with individual credit bureau records from 2019–2023. This linkage provides a detailed view of cash inflows, spending, and debts reported to the credit bureau alongside BNPL payments that are otherwise invisible in credit reports. Through the bureau linkages, we verify mortgage type and identify debt-related tradelines, credit scores, and new credit inquiries.
Next, we build a longitudinal sample of homeowners with active first-lien mortgages and first-time buyers, whom we track before and after a home purchase. Within each group, we distinguish government-insured (FHA) loans from conventional mortgages sold to or guaranteed by the government-sponsored enterprises (GSEs).2 The combined sample comprises roughly 4.5 million homeowners. To track overall adoption and prevalence, we use a supplementary random sample of 759,000 individuals.3 Our BNPL analyses focus exclusively on the interest-free Pay-in-4 loan, which functions as an everyday cash management tool. We exclude longer-term, interest-bearing BNPL plans often used for large durable purchases (such as furniture or electronics), to avoid mixing day-to-day budgeting with installment financing preferences.4 Economically, these two products play different roles in household finances; longer-term BNPL loans resemble traditional installment or personal loans and are more likely to be reported to credit bureaus. For the purposes of this analysis, we classify someone as a BNPL user if the linked transactions show at least one Pay-in-4 plan.5
To study these patterns, we use panel models to examine when homeowners use BNPL and what factors drive BNPL spending intensity. Finally, we conduct two event studies to track BNPL use around major cash flow shocks: buying a first home and an involuntary job loss.6
BNPL among homeowners is higher for those with maxed credit cards and tight budgets and lower for those with larger savings buffers.
To understand the circumstances under which homeowners turn to BNPL, we examine who uses BNPL and when by looking at how usage varies with financial characteristics across homeowner segments. We focus on two populations served by distinct mortgage programs: FHA borrowers, who typically qualify under more flexible underwriting standards, and conventional (GSE) borrowers, who generally adhere to stricter credit requirements. FHA borrowers in our sample tend to have lower credit scores, smaller savings buffers, and higher payment-to-income ratios than conventional borrowers; these differences provide a clear lens for understanding BNPL usage across homeowner segments. Public sources such as the CFPB and the Federal Reserve’s SHED provide aggregate prevalence measures of BNPL usage among homeowners, but they do not separate outcomes by mortgage type. Differentiating between FHA and conventional borrowers highlights differences that may be relevant for credit assessment.
To go beyond static credit metrics, we construct a cash-flow measure of budget strain, which we call financial tightness. This indicator measures the share of recurring income used for essential expenses and non-discretionary debt payments, showing how much room remains for additional obligations. Our cash-flow-based view complements existing studies that rely mainly on self-reported surveys or credit-report-based measures like scores and balances.
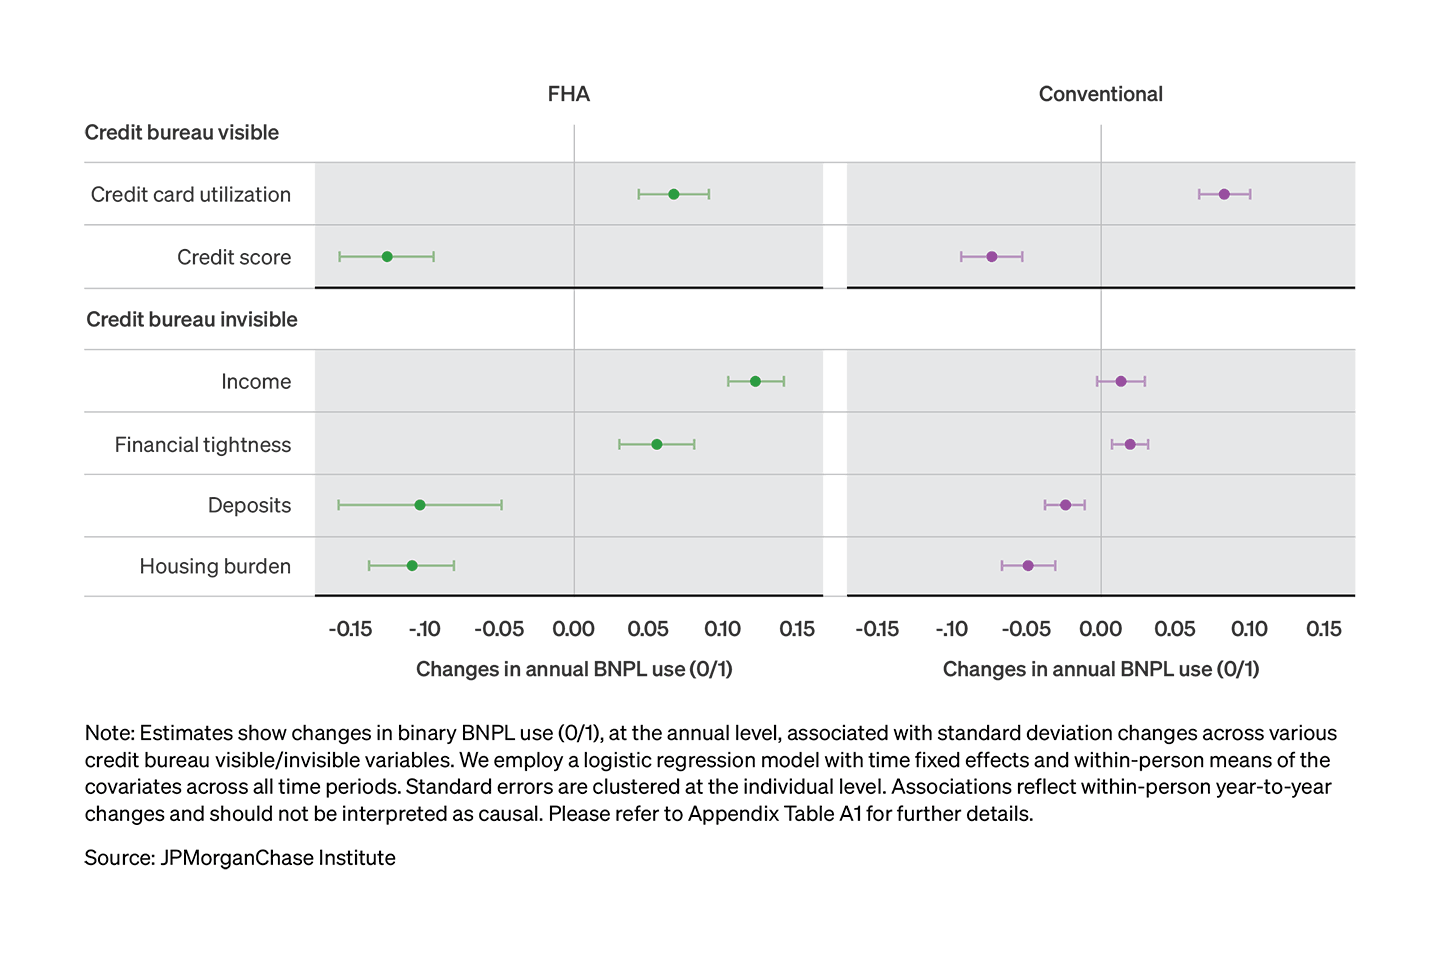
Figure 1: Descriptive associations of BNPL use and financial indicators, by mortgage type
With these measures in place, Figure 1 summarizes results at the extensive margin—that is, whether a homeowner uses BNPL in a given month or not.7 We find that usage is significantly more likely when borrowers’ credit card utilization and financial tightness rise above their own typical levels. A one-standard-deviation increase in utilization is associated with approximately a 7–8 percent increase in the odds of using BNPL for both FHA and conventional borrowers. According to Federal Reserve analyses, higher credit card utilization is associated with higher BNPL use rates; consumers using 75–100 percent of their available credit had BNPL use rates roughly 2.5 times higher than those at 10–25 percent utilization (Larrimore et al., 2024). When examining financial tightness, we find a similar positive relationship between budget headroom and BNPL use: a one-standard-deviation increase in financial tightness corresponds to a 5.7 percent increase in the odds of using BNPL for FHA borrowers. This effect is nearly four times larger than the 1.6 percent increase observed for conventional borrowers.8 In short, BNPL use is most likely in months when homeowners have less spare cash after covering essential expenses and other debts.
Looking at indicators of stability, when deposit balances rise above a homeowner’s own norm, the likelihood of BNPL use declines. This effect is particularly pronounced in the FHA segment, where a one-standard-deviation increase in deposits corresponds to a 9.8 percent reduction in the odds of use. Moreover, we find that higher credit scores are likewise associated with less frequent use for both mortgage types, consistent with survey and administrative evidence (Greene et al., 2024; Larrimore et al., 2024).
For homeowners who already use BNPL, spending follows the same pattern. Intensive margin regressions (reported in the Technical Appendix) show that annual BNPL spending tends to rise when budgets are tighter and savings are lower. For instance, a 10 percent decline in deposits is associated with a 1.5 percent increase in annual BNPL spending for FHA borrowers. However, this relationship is constrained by overall debt levels. The positive association between financial tightness and BNPL spending is smaller when a household is also carrying high revolving debt. For FHA homeowners already using a high share of their credit lines, additional budget tightness leads to a smaller increase in BNPL spending than for those with lower utilization. This pattern implies that overall budget constraints limit further increases in BNPL use when both revolving balances and fixed expenses are high (Figure A.2).
Overall, BNPL complements credit cards (Di Maggio et al., 2023), and its usage intensifies precisely when household balance sheets are most stretched. Because financial tightness combines non-discretionary spending and existing debt payments, increases in budget tightness alongside higher BNPL use mean the cash left to make required payments, including the mortgage, shrinks. BNPL obligations tend to rise when cash flow is more variable, as homeowners turn to Pay-in-4 loans to manage cash flow gaps in the short run. The trade-offs between liquidity and mainstream credit usage align with evidence that BNPL engagement is more common among consumers facing tighter budgets and higher debt burdens (deHaan et al., 2024; Dong et al., 2025).
Frequent BNPL users cut card balances 12-13 percent before purchasing a first home and increase BNPL use nearly four-fold after closing.
To explore BNPL use in a concrete cash-flow shock setting, we focus on first-time homebuyers, tracing their spending patterns before and after buying a home. Many first-time buyers are recent renters. At this transition, their primary housing payment shifts from rent to mortgage and expenses increase, often while other debt commitments remain in place. This period often involves balance sheet management: prospective buyers increase savings and adjust debt levels. Focusing on first-time buyers shows how BNPL spending evolves through this housing tenure transition.
To isolate shifts in credit mix and balance sheets, we group individuals by BNPL usage frequency. This classification differentiates repeat BNPL use from one-off convenience use that could mask important differences. We define frequent users as those averaging two or more Pay-in-4 series per year after their first use of BNPL (eight or more installments) during the study window. Frequent users comprise 58.5 percent of our overall sample, suggesting that once adopted, users are likely to make repeat purchases (Akana and Zeballos Doubinko 2024).9 This conservative threshold separates sustained use from occasional usage that is not representative of an ongoing payment stream. Excluding individuals with isolated payments and keeping only first-time buyers reduces the sample to 372,722 individuals. We find that both groups adjust their financial behavior around the home purchase, but pre-existing BNPL use shapes how their short-term credit mix evolves throughout the purchase process.10
In the year before the home purchase, all first-time buyers deleverage on their revolving credit accounts. Figure 2 shows their credit card balances declining steadily and reaching a low point in the final month before purchase.11 For frequent users in the FHA segment, in the month before purchase, balances fall by 12.8 percent relative to their initial baseline. By comparison, infrequent users exhibit similar, albeit smaller percentage declines.
BNPL usage follows a different trajectory from credit cards. Among infrequent users, BNPL spending as a share of outflows remains relatively flat throughout the year around the purchase. Among frequent users, by contrast, BNPL spending shares rise steadily over the year before purchase, peaking about four months before purchase at roughly 34 percent for FHA and 38 percent for those with conventional loans relative to the level a year earlier. In other words, frequent users trim revolving balances while keeping BNPL elevated; the card-debt reduction is not one-for-one with the rise in BNPL payments.
Figure 2: Evolution of credit card balances and BNPL spending among first-time buyers by mortgage type and BNPL use frequency.
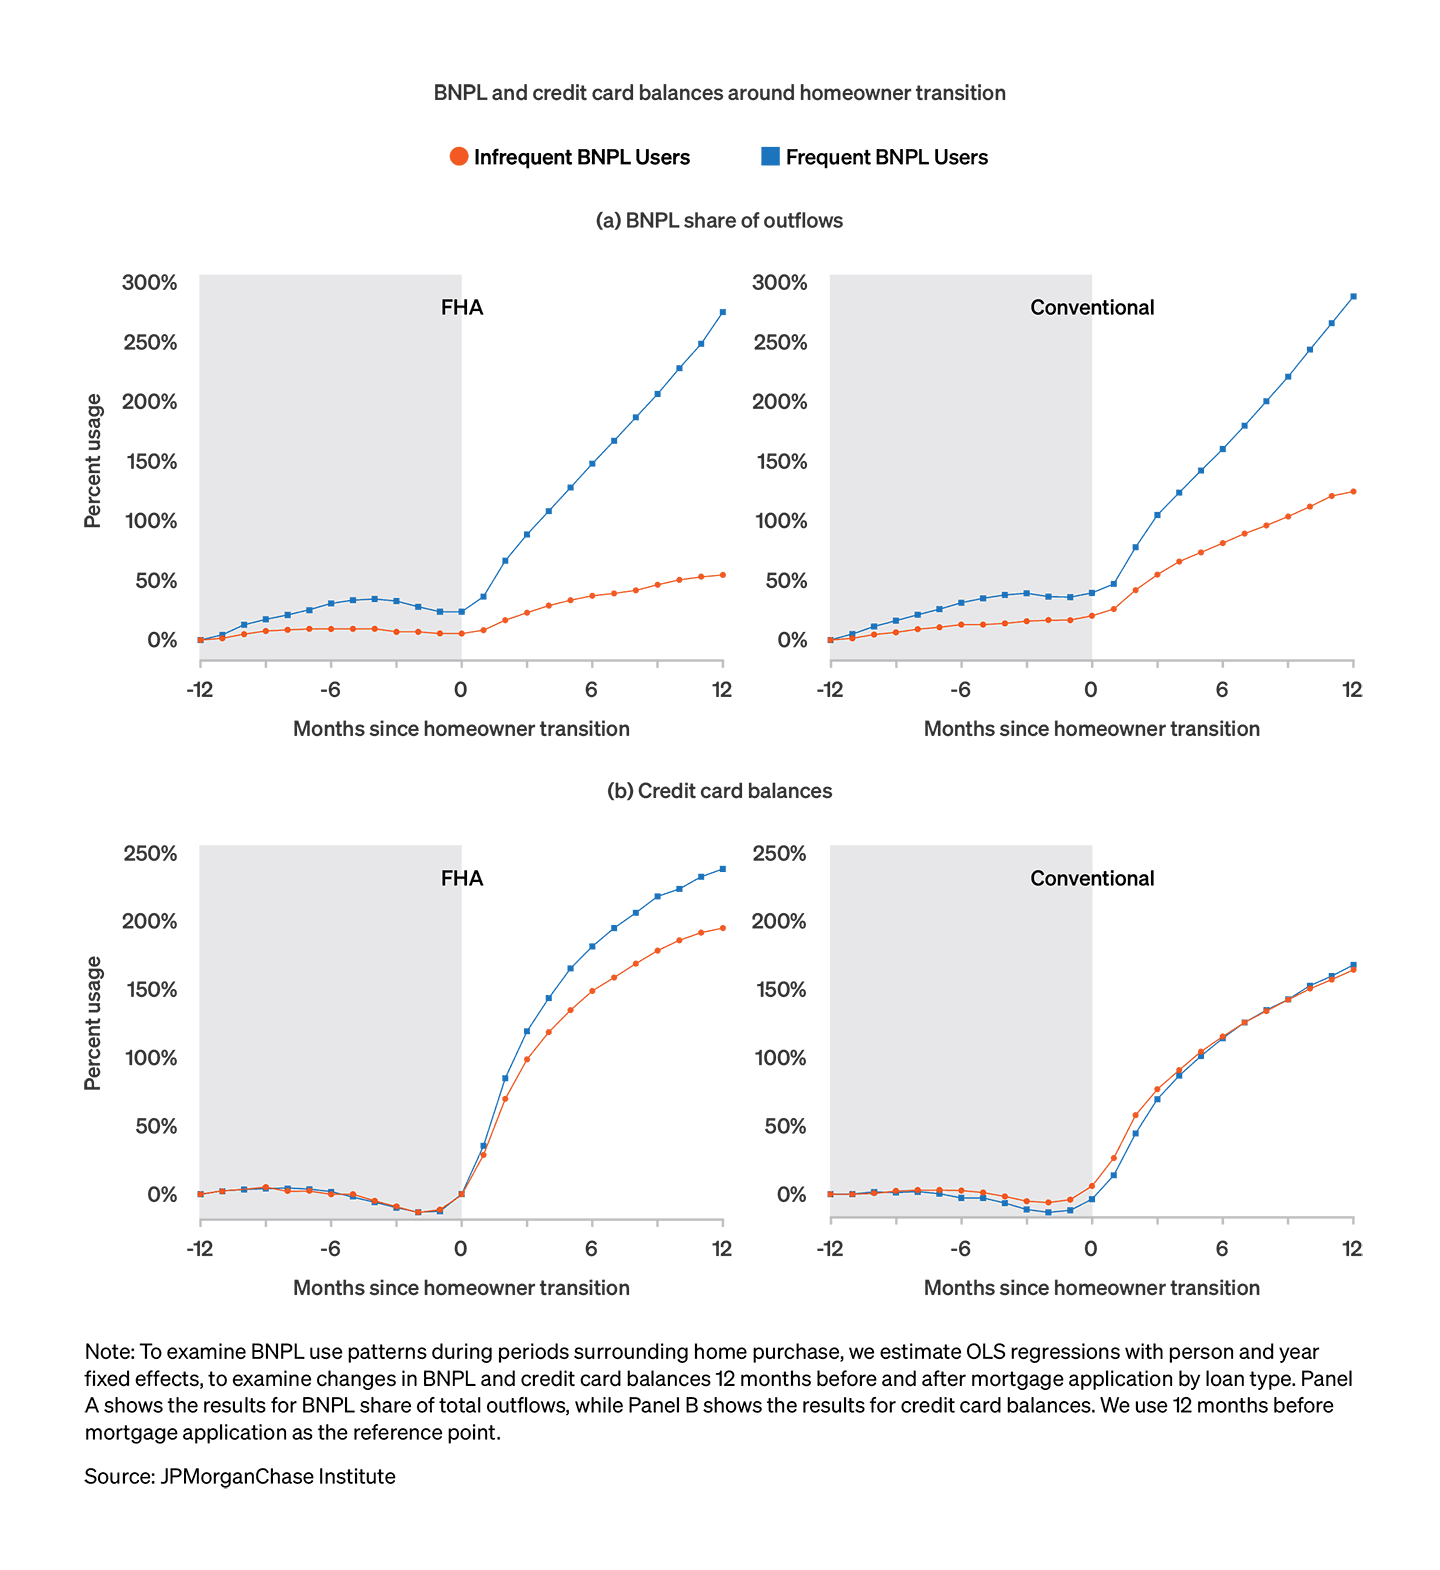
The mortgage closing generally marks an inflection point for both user groups. After purchase, we observe a broad-based increase in credit usage. Credit card balances and BNPL spending both rebound, and reliance on BNPL accelerates more sharply for frequent users. By the end of the observation window, frequent users’ BNPL spending is nearly four times the pre-purchase baseline. This steady increase in BNPL use outpaces the recovery in credit card balances; frequent users emerge from the purchase with persistently higher BNPL spending shares, even as card spending intensity also surges post-purchase. These patterns suggest a preference for diversifying the mix of credit tools used across both first-time user groups, a trend that holds even among casual users.
To quantify the scale of these patterns, we analyze the distribution of BNPL payments relative to income during the six months before closing and compare them to credit card balances at closing as a share of income. Figure 3 shows that for most prospective buyers, BNPL as a share of income is small. For the median buyer, BNPL loans over the six-month window amount to less than 1 percent of annual income.
Figure 3: Distribution of credit balances and 6-month BNPL spend by mortgage type and BNPL use frequency.
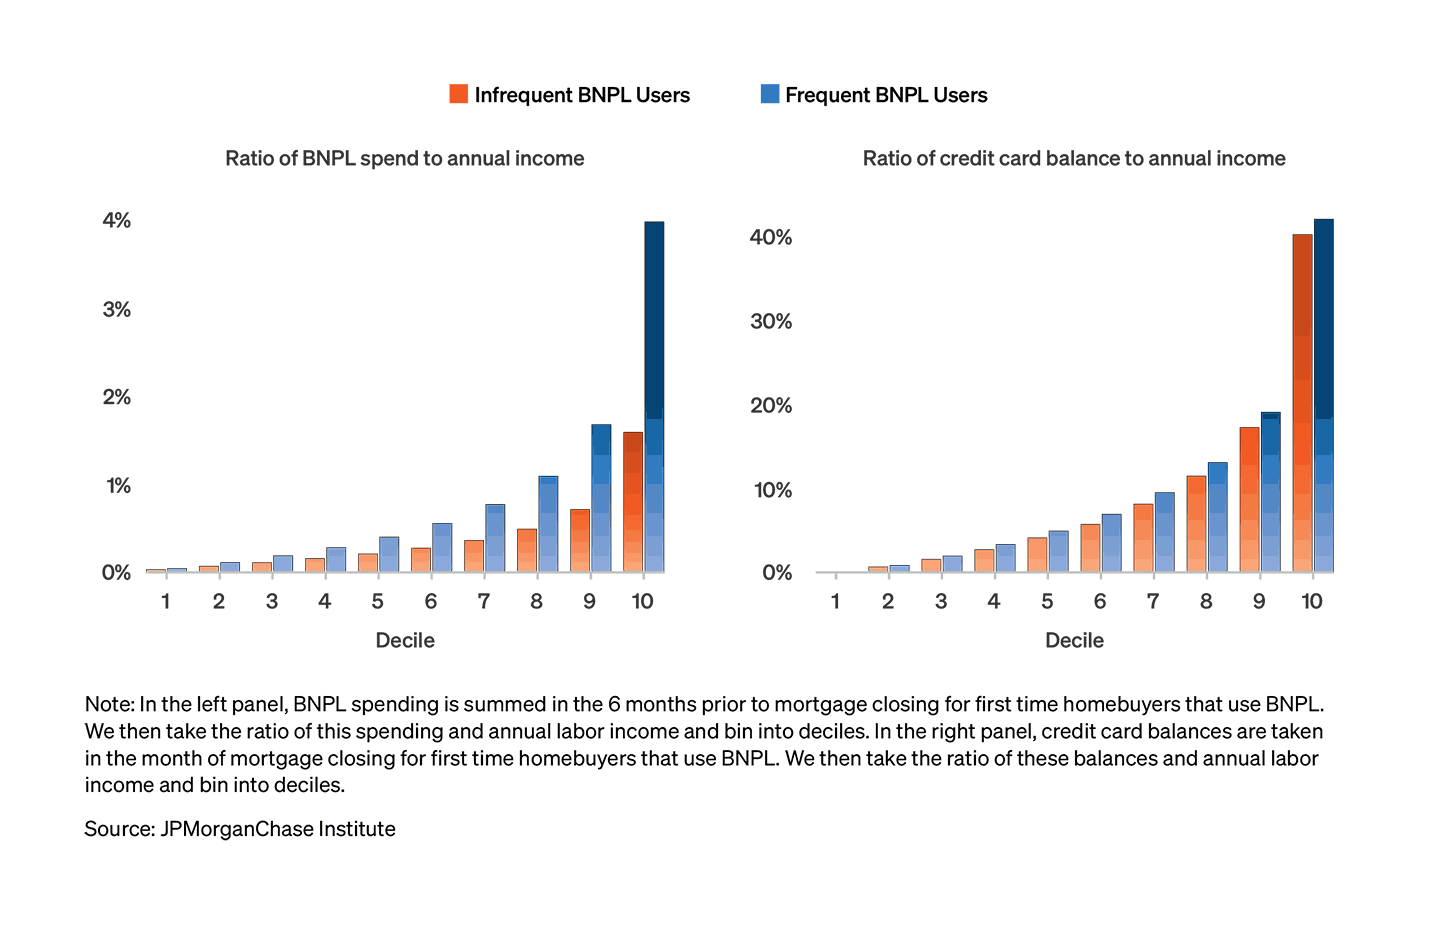
Among frequent users in the upper part of the distribution, however, BNPL installments reach about 4 percent of income, and this group holds the highest credit card balances relative to income at closing, with card balance-to-income ratios around 42 percent. In other words, this upper-tail group enters homeownership with both higher reported revolving debt and higher BNPL-to-income ratios than other first-time buyers. This diversified credit mix suggests BNPL financing is a distinct component of monthly obligation at origination for a specific segment of soon-to-be buyers, even though it remains modest for most.
BNPL as a share of spending rises after job loss, exceeding 20 percent of spending for lower-income FHA homeowners.
Job loss can be a clear source of financial stress for homeowners. To examine how BNPL use evolves around this type of shock, we identify homeowners who begin receiving unemployment insurance (UI) and track their BNPL spending and credit card balances from several months before UI starts to six months after.12 The sample includes only individuals with at least one BNPL transaction, and we compare homeowners in the bottom and top income quintiles, separately for FHA and conventional (GSE) loans. Figure 4 shows BNPL spending as a share of total outflows and credit card balances over this period.
BNPL use increases after job loss across all groups in our sample, but the timing and magnitude differ by income and mortgage type.13 Among FHA borrowers in the bottom income quintile, BNPL’s share in the month UI begins is about 4 percent higher than in the previous month, more than twice the increase observed for bottom-quintile GSE borrowers.14 In the following months, BNPL reliance continues to build. By six months after UI starts, BNPL’s share of spending for bottom-quintile FHA borrowers is roughly 30 percent above its pre-shock level, compared with about a 22 percent increase for bottom-quintile GSE borrowers. This pattern is consistent with broader evidence that households use flexible liquidity options to smooth spending after job loss, even when UI benefits are available (Ganong and Noel, 2019).
Figure 4: BNPL spending shares and credit card balances around unemployment inflows by mortgage type and BNPL intensity
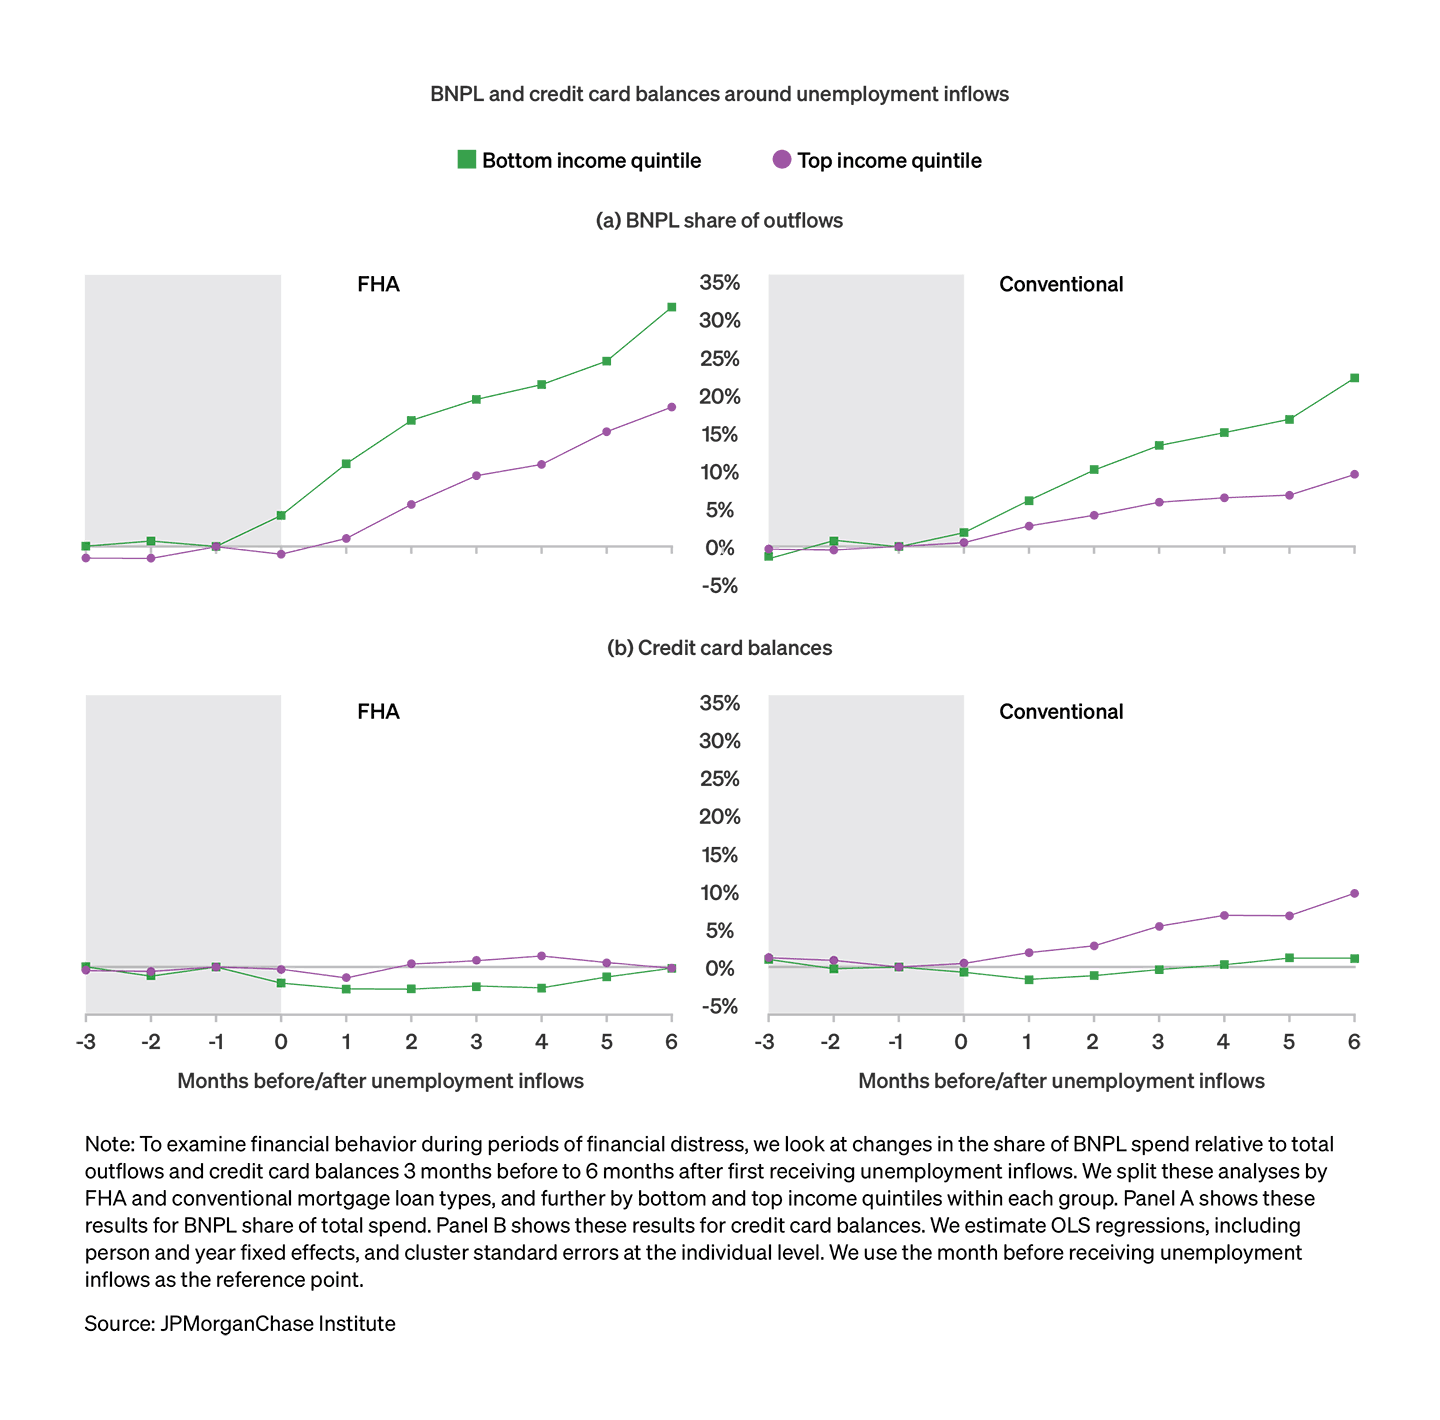
Higher-income homeowners also increase BNPL use after job loss, but their responses are smaller and more gradual. For both FHA and GSE borrowers in the top income quintile, estimated changes in BNPL’s share are near zero in the first few months after UI begins. By six months after UI starts, BNPL’s share is about 18 percent above baseline for top-quintile FHA borrowers and about 10 percent above baseline for top-quintile GSE borrowers indicating that reliance on BNPL continues to rise, but less sharply than in the lower-income groups. Across income groups, FHA borrowers tend to exhibit larger post-shock increases in BNPL reliance than GSE borrowers with similar incomes.
Credit card balances provide useful context for these changes. As shown in the lower panels of Figure 4, card balances remain relatively stable for most job-loss groups, with modest declines for FHA borrowers and some increase for top-income GSE borrowers. Overall, the rise in BNPL’s share of spending after job loss is not accompanied by a corresponding increase in revolving debt for most homeowners in the short run. Instead, BNPL appears to be the channel that adjusts most in the months following an unemployment shock, even as reported card balances change little. Economically, adjustments after job loss show up more in BNPL than in credit cards. One interpretation is that households keep bureau-reported credit card balances low and shift incremental spending to BNPL, which is easily accessed at checkout and often seen as cost-free compared with cards.
Our descriptive results indicate that after job loss, many mortgage borrowers shift more of their reduced cash flow to BNPL-financed spending, with the largest and most immediate increases concentrated among lower-income FHA borrowers.15 Because card balances do not fall as much, the additional BNPL spending displayed in Figure 4 (top panel) represents extra short-term commitments alongside the mortgage at a time when income is temporarily lower. These findings align with recent work that associates heavier BNPL with weaker indicators of financial health and a higher likelihood of subsequent delinquency on other debts (deHaan et al., 2024; Larrimore et al., 2024; Greene et al., 2024).
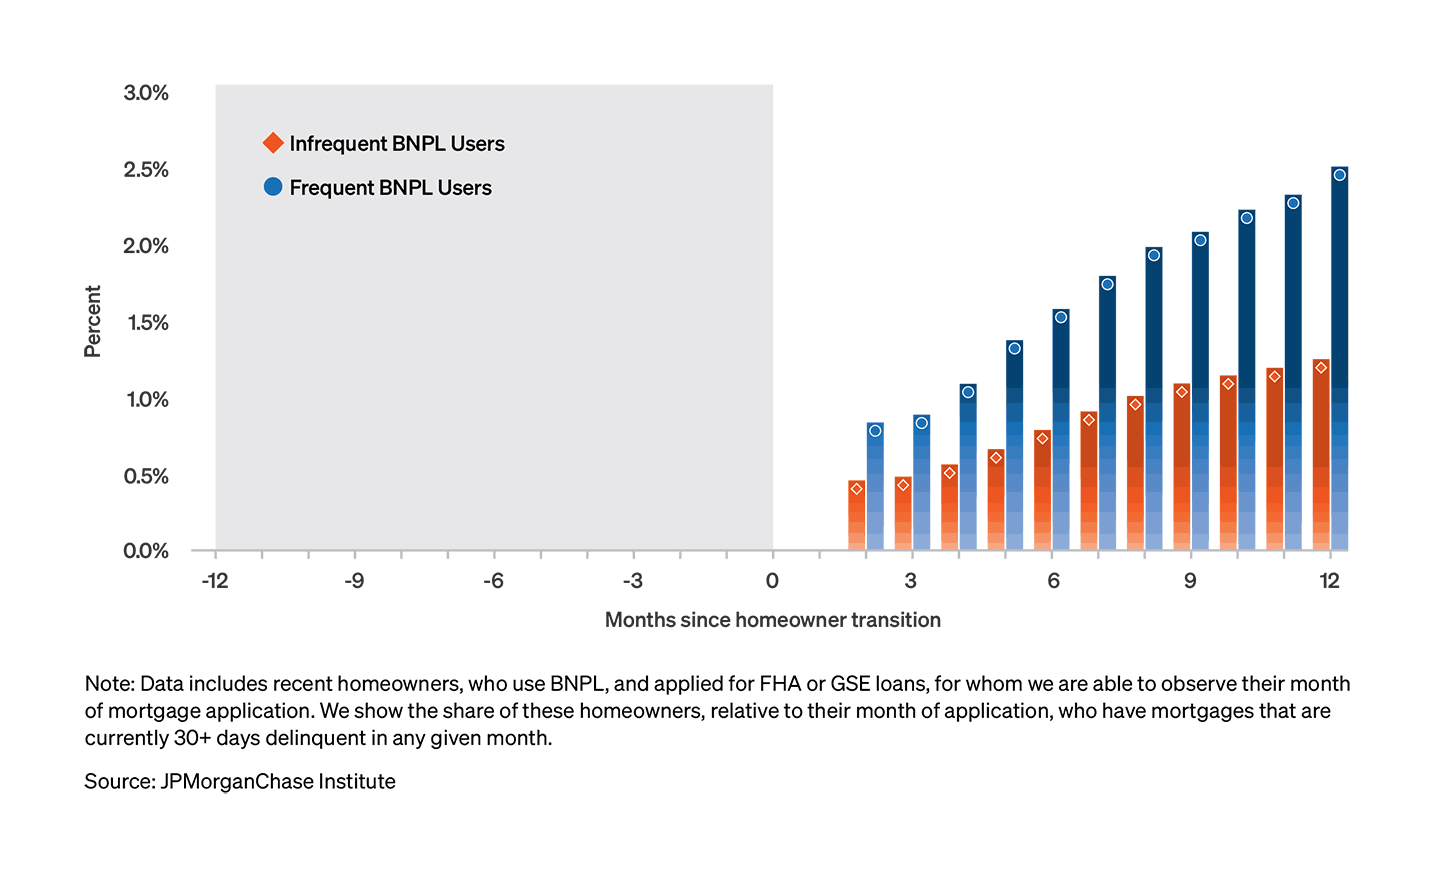
First-time homebuyers who use BNPL frequently have over an 8 percent higher chance of missing a payment within a year of purchase.
Building on findings around home purchase and job loss, we next examine whether BNPL intensity is linked to early mortgage payment stress among first-time buyers. We limit the sample to recent buyers who used BNPL at least once and track individuals month by month, recording any transition into 30+ days past due on their first mortgage. In this setting, our results compare differences within BNPL-using recent buyers, not between users and non-users. We focus on early-stage mortgage delinquency because a first 30-day past due (30+ DPD) episode in the first year is a common marker of payment stress during the transition into homeownership, when households are adjusting to a new housing obligation alongside other recurring expenses and debt commitments.
Figure 5 shows a descriptive timeline for the first year after purchase. Within six months of the home purchase, 1.6 percent of frequent users have experienced a 30+ DPD event compared to 0.8 percent of infrequent users. Over the first year, the share of users with reported 30+ DPD occurrences increases steadily; by month 12, the shares are 2.5 and 1.2 percent, respectively. In this window, early-stage payment stress among frequent users is more than double that of infrequent users, and the gap widens gradually rather than appearing at a single point in time.
Figure 5: Share of first-time homebuyers with early-stage mortgage delinquency by BNPL usage frequency
As BNPL use becomes more widespread, it is increasingly important to understand how BNPL loans are situated within households’ finances as a whole.
Our findings suggest that BNPL can play different roles in household finances depending on the circumstances. Many homeowners use BNPL as an additional source of credit when budgets are tight, while for others it remains an occasional convenience. During cash flow shocks such as buying a first home or losing a job, homeowners with less savings and weaker credit profiles use BNPL for more of their spending. Around a home purchase, a concentrated group of first-time buyers carry BNPL obligations of about 4 percent of their income. For this small but meaningful segment, BNPL loans are extra short-term commitments that are not routinely visible in standard credit bureau files.
As BNPL adoption broadens, there are opportunities for policymakers and educators to improve awareness:
Although the divergences depicted in Figure 5 are informative, they are not conclusive, since frequent and infrequent users can differ on factors that also matter for mortgage performance. To summarize these patterns in a model that adjusts for standard credit profile and liquidity measures, we estimate month-level logistic regressions of transitions into 30+ DPD within the first year of purchase. Because an association between BNPL intensity and delinquency can vary across the credit score distribution, we stratify models by credit-score bins and evaluate results by score group to assess whether any association between BNPL intensity and payment stress is concentrated among borrowers with weaker profiles or broadly distributed.
As discussed previously, we classify frequent and infrequent users by pre-purchase use patterns and find a positive association between BNPL intensity and early-stage payment stress. In our adjusted models, a one-standard-deviation increase in pre-mortgage BNPL intensity is associated with about 8.1 percent higher odds of a 30-day mortgage delinquency. The corresponding estimate for infrequent users differs in sign, consistent with the idea that casual BNPL users may include episodic or convenience users whose patterns do not track payment stress in the same way.
Our credit score stratified models similarly indicate a positive relationship between BNPL intensity and payment stress, though the relationship is not uniform. The intensity-stress association is most evident among borrowers with scores of 661–715 and those with subprime scores. Among borrowers with subprime scores, the same one-standard-deviation change in BNPL intensity is associated with a 4.7 percent increase in the odds of a 30+ DPD mortgage delinquency. For users with scores of 661–715, the estimated odds of an early-stage payment occurrence rise by 6.2 percent. Estimates for users with strong credit scores are smaller and not statistically distinguishable from zero.
Interpreted cautiously, these descriptive regression results suggest that heavier use within our first-time buyer sample is modestly associated with a higher likelihood of early-stage payment delinquency. This pattern is more pronounced in segments where budgets are tighter and credit capacity is more limited, rather than across all BNPL-using homeowners. These regression-adjusted estimates describe associations conditional on observables and do not identify causal effects of BNPL on mortgage delinquency. Delinquency rates are modest in absolute terms, but the ranking across intensity groups persists through the first year after adjusting for observable differences in credit scores, credit card utilization, and bank-account liquidity measures. These results echo emerging evidence from other studies that show heavier BNPL use coincides with weaker financial health and higher delinquency rates on other debts (deHaan et al., 2024; Larrimore et al., 2024; Greene et al., 2024).
Data and methods
We supplement our BNPL-users build with a 10 percent random sample of all Chase customers to profile drivers of adoption and gauge representativeness against the Survey of Household (SHED).16 These benchmarks confirm that the distributions of income, credit score, and age in our sample are broadly representative.
Figure A.1: Distribution of key demographics among BNPL-using homeowners by mortgage type (FHA vs GSE)
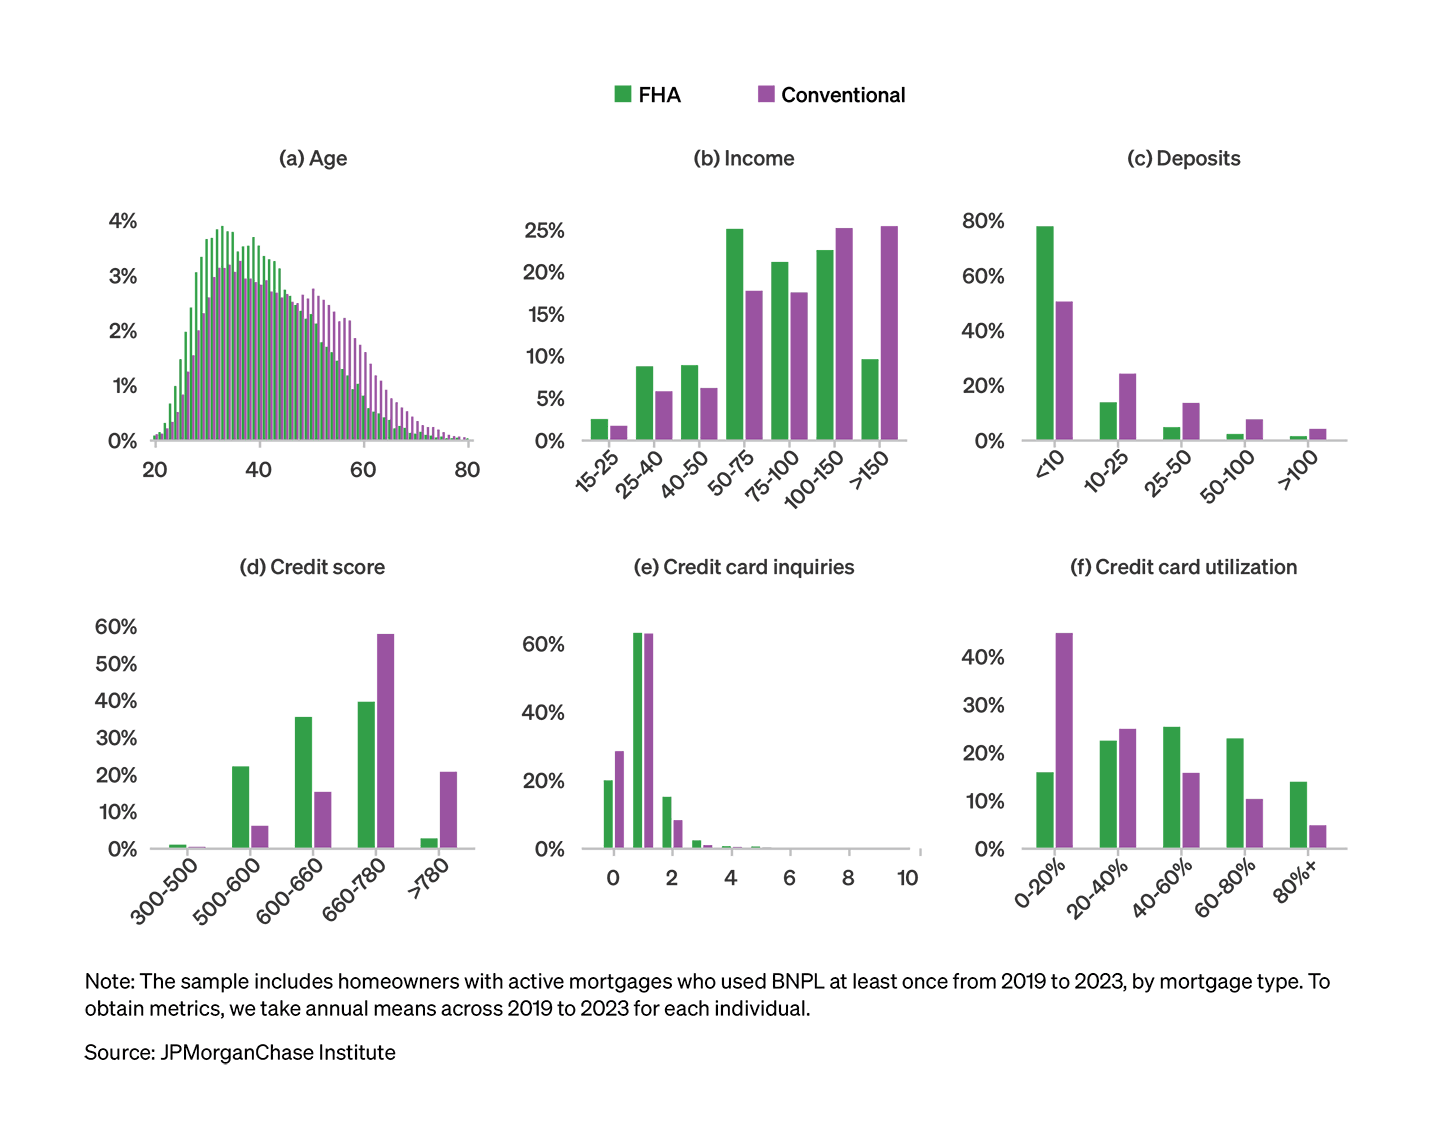
To test narratives about BNPL’s role and impact on financial stability, we segment the sample by mortgage type: Federal Housing Administration (FHA) insured or conforming Government Sponsored Enterprises (GSEs).17 Because FHA and GSE loans are designed to serve different borrower populations, this segmentation provides a straightforward proxy for underlying financial constraints or credit access. To measure financial pressures facing households, we define several key variables. Financial tightness is a cash flow-based measure of non-discretionary spending relative to recurrent monthly inflows. This non-discretionary spending metric captures semi-fixed outflows, including non-housing debt payments, groceries, transportation, insurance, and utilities.
Housing burden, an affordability metric, measures the individual’s mortgage payment relative to their recurrent monthly inflows. Credit card utilization is the ratio of reported balances to credit limits. We also observe liquid savings through deposit balances, and household income via tagged labor inflows (recurrent income).
Figure A.2: Homeowners intensify BNPL spending in response to near-term financial strain, such as dwindling cash buffers, tightening budgets, and diminished credit card lines.
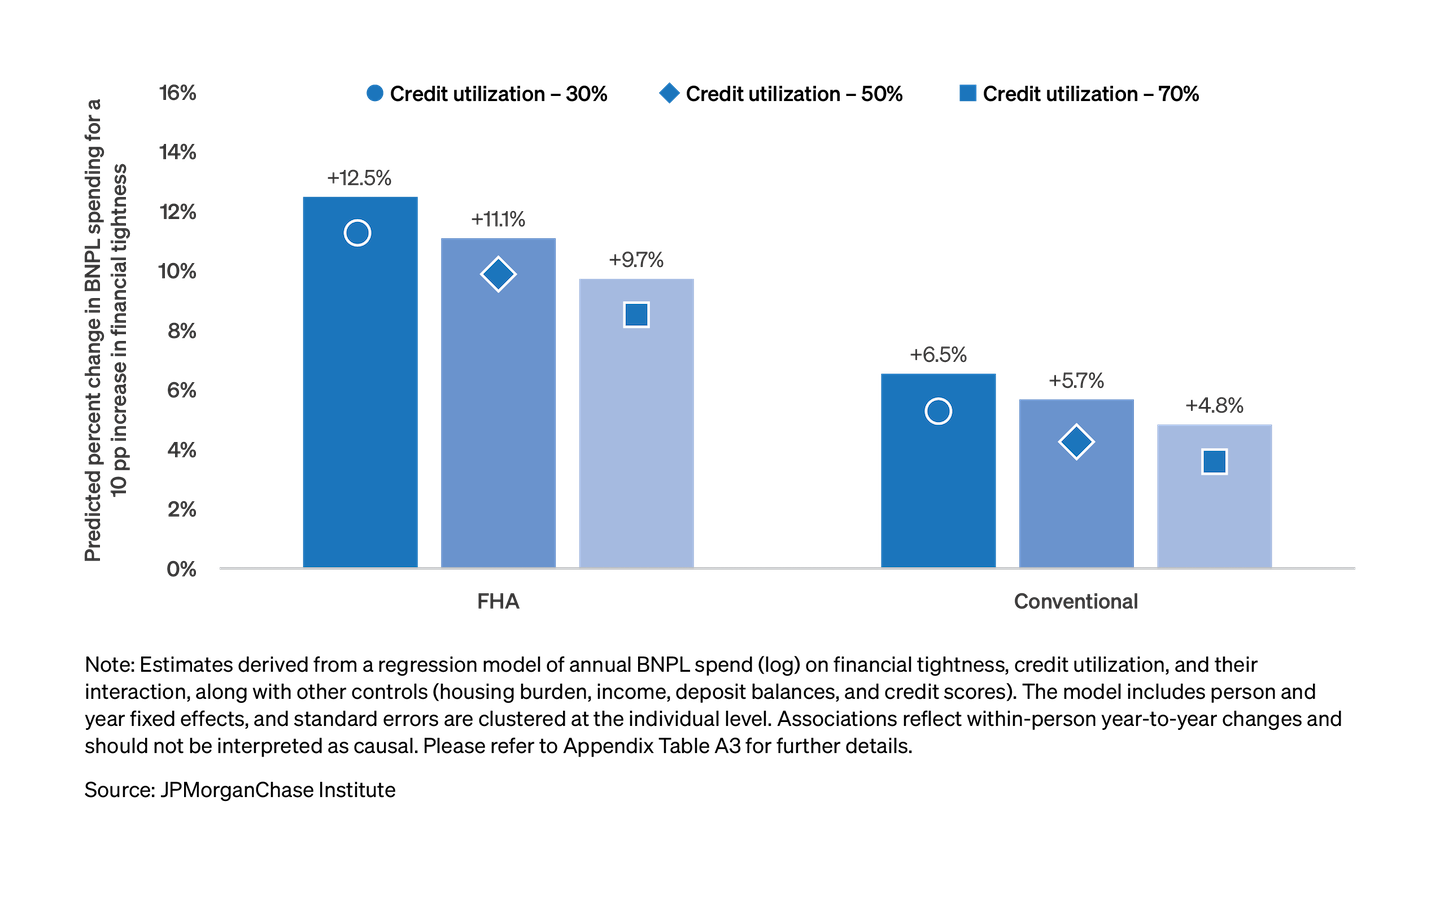
Figure A.3: Evolution of purchase-readiness markers by mortgage type and BNPL-use frequency
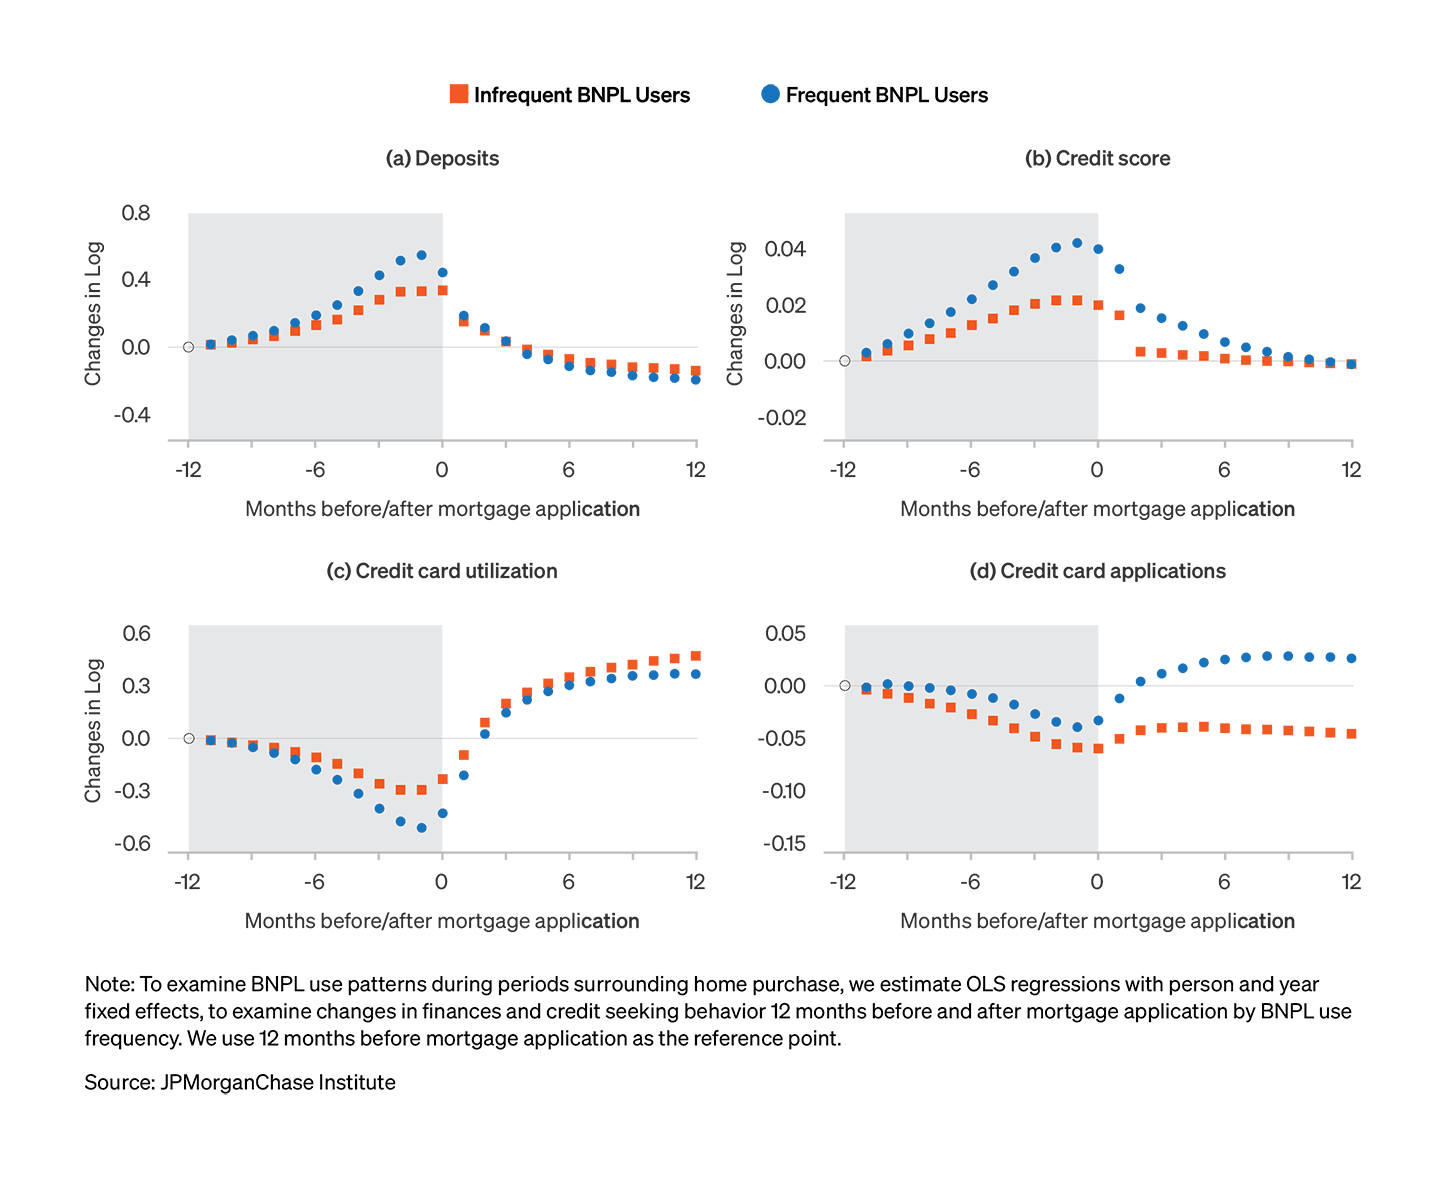
Figure A.4: Heat map of BNPL use intensity by credit card utilization and financial tightness, by mortgage type (FHA vs. GSE)
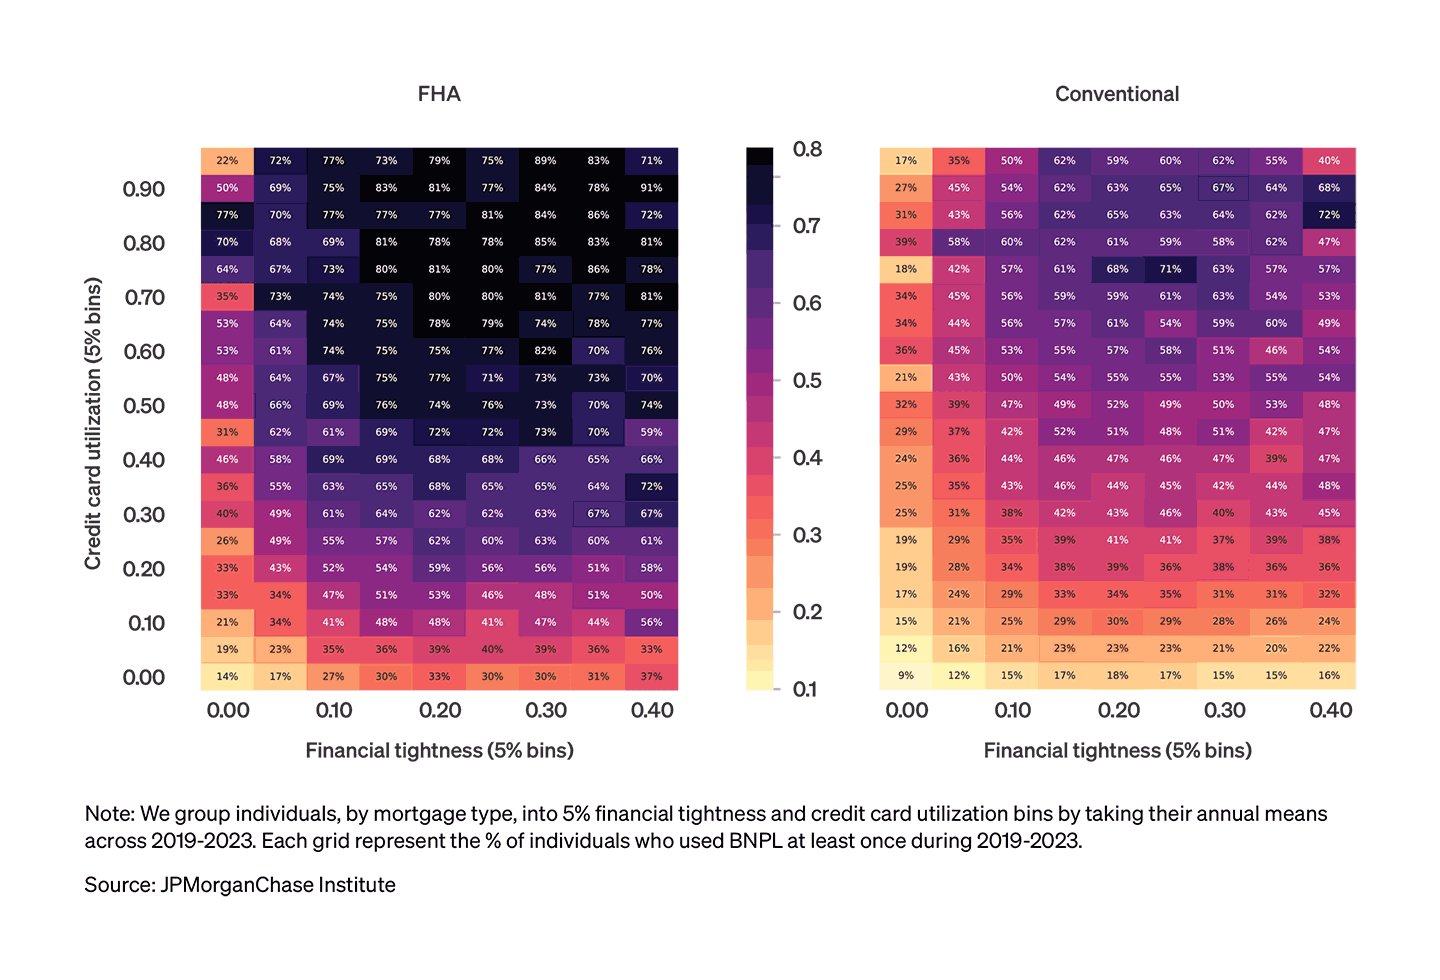
Table A1: Logistic regressions of annual BNPL use
| Annual BNPL Use | Annual BNPL Use |
Model: | FHA | Conventional |
Panel A: Credit Bureau Visible | ||
Credit Card Utilization | 0.0667*** (0.0122) | 0.0793*** (0.0087) |
Credit Score | -0.1261*** (0.0161) | -0.0771*** (0.0106) |
Panel B: Credit Bureau Invisible | ||
Financial Tightness | 0.0556*** (0.0128) | 0.0154** (0.0062) |
Housing Burden | -0.1093*** (0.0146) | -0.0748*** (0.0085) |
Deposits | -0.1036*** (0.0239) | -0.0280*** (0.0069) |
Income | 0.1218*** (0.0222) | 0.0096 (0.0080) |
Panel C: Covariate Means | ||
Credit Card Utilization (Mean) | -0.0747*** (0.0163) | -0.1832*** (0.0120) |
Credit Score (Mean) | -0.5440*** (0.0200) | -0.7973*** (0.0136) |
Financial Tightness (Mean) | 0.0691*** (0.0166) | 0.1974*** (0.0082) |
Housing Burden (Mean) | -0.2803*** (0.0206) | -0.2946*** (0.0126) |
Deposits (Mean) | -0.1589*** (0.0314) | -0.2049*** (0.0101) |
Income (Mean) | 0.1306*** (0.0263) | 0.1912*** (0.0097) |
Fixed Effects | ||
Year | Yes | Yes |
Fit statistics | ||
Observations | 136,896 | 716,534 |
Squared Correlation | 0.13287 | 0.10575 |
Pseudo R² | 0.10282 | 0.10374 |
Notes: All independent variables are in standard deviation changes.
Table A.2: OLS regressions of annual BNPL use intensity
Dependent Variable: | Annual Pay-in-4 BNPL Spend (Log) | Annual Pay-in-4 BNPL Spend (Log) |
Model: | FHA | Conventional |
Panel A: Interaction Effects | ||
Credit Card Utilization | 0.7059*** (0.0349) | 0.5431*** (0.0273) |
Financial Tightness | 1.361*** (0.0574) | 0.7483*** (0.0297) |
Credit Card Utilization X Financial Tightness | -0.6183*** (0.0867) | -0.3953*** (0.0603) |
Panel B: Other Covariates | ||
Housing Burden | -0.2564*** (0.0265) | -0.1687*** (0.0152) |
Credit Score (Log) | -0.3047*** (0.0773) | -1.141*** (0.0665) |
Deposits (Log) | -0.1385*** (0.0057) | -0.1141*** (0.0036) |
Income (Log) | 0.9679*** (0.0195) | 0.5544*** (0.0112) |
Fixed Effects | ||
Individual | Yes | Yes |
Year | Yes | Yes |
Fit statistics | ||
Observations | 880,037 | 2,081,742 |
R² | 0.6597 | 0.63375 |
Notes: Credit card utilization, financial tightness, and housing burden are reported in percentage point terms. All other variables are in natural log (with constant 1) terms.
Table A.3: Logistic regressions of mortgage delinquencies post-closing
Dependent Variable: | Mortgage Currently Delinquent (0/1)
|
| ||||||
| Panel A: BNPL Frequent User | Panel B: Credit Scores |
| |||||
Model: | Infrequent (0) | Frequent (1) | Fair or Below | Good | Very Good | Excellent | ||
BNPL Share of Outflows | -0.0821** (0.0273) | 0.0779*** (0.0173) | 0.0463** (0.0149) | 0.0606* (0.0252) | -0.0198 (0.0577) | -0.0512 (0.0827) | ||
Credit Card Utilization | 0.2301*** (0.0303) | 0.2707*** (0.0368) | 0.3153*** (0.0424) | 0.2123*** (0.0504) | 0.2064* (0.0882) | 0.0672 (0.1356) | ||
Credit Score | -0.3040*** (0.0725) | -0.3339*** (0.0664) | -0.3349*** (0.0610) | -0.2269* (0.0905) | -0.1309 (0.1260) | -0.0336 (0.1567) | ||
Income | 0.0015 (0.0191) | 0.0276. (0.0168) | 0.0489*** (0.0120) | 0.0039 (0.0289) | 0.0318 (0.0664) | -0.1201 (0.0764) | ||
Total Outflows | -0.1129** (0.0433) | -0.0694* (0.0342) | -0.0575. (0.0304) | -0.0102 (0.0446) | 0.0757 (0.0592) | 0.1942** (0.0748) | ||
Deposits | -0.1595*** (0.0293) | -0.1723*** (0.0316) | -0.1855*** (0.0254) | -0.1904*** (0.0285) | -0.0705 (0.0665) | -0.0025 (0.0684) | ||
|
|
|
|
|
|
| ||
Fixed Effects |
|
|
|
|
|
| ||
Quarter | Yes | Yes | Yes | Yes | Yes | Yes | ||
Observations | 1,080,318 | 2,173,577 | 912,909 | 1,083,334 | 482,798 | 696,881 | ||
Pseudo R² | 0.00615 | 0.00994 | 0.02469 | 0.0029 | 0.00073 | 6.15e-5 | ||
R² | 0.06666 | 0.07069 | 0.0839 | 0.05334 | 0.04042 | 0.01596 | ||
|
|
|
|
|
|
|
|
|
Notes: All independent variables are lagged 3 months and in standard deviation changes. Panel A shows results for recent homeowners grouped by BNPL frequent use, and Panel B shows them grouped by their Vantage Score groups (Fair or Below is 660 or below, Good is between 660 and 715, Very Good is between 715 and 747, and Excellent is above 747).
Table A.4: Distribution of credit balances and 6-month BNPL spend by mortgage type and BNPL use frequency.
BNPL to Annual Income Ratio: | Credit card balance to Annual Income Ratio: | |||
Decile: | Frequent: | Infrequent: | Frequent: | Infrequent: |
1 | 0.0005 | 0.0003 | 0.0011 | 0.0007 |
2 | 0.0011 | 0.0007 | 0.0087 | 0.0068 |
3 | 0.0019 | 0.0011 | 0.0198 | 0.0159 |
4 | 0.0028 | 0.0016 | 0.0334 | 0.0273 |
5 | 0.0040 | 0.0021 | 0.0494 | 0.0413 |
6 | 0.0056 | 0.0028 | 0.0693 | 0.0585 |
7 | 0.0077 | 0.0036 | 0.0950 | 0.0813 |
8 | 0.0109 | 0.0049 | 0.1307 | 0.1147 |
9 | 0.0167 | 0.0071 | 0.1904 | 0.1723 |
10 | 0.0397 | 0.0159 | 0.4195 | 0.4010 |
Notes: Empirical data from Figure 3 showing the ratio of BNPL spend and credit card balances to annual income binned by deciles.
Affirm Holdings, Inc. 2025. “Affirm Expands Credit Reporting with Experian to Include All Pay-Over-Time Products.” Affirm Investor Relations. March 19, 2025. https://investors.affirm.com/news-releases/news-release-details/affirm-expands-credit-reporting-experian-include-all-pay-over
Aidala, Felix, Daniel Mangrum, and Wilbert Van der Klaauw. "How and Why Do Consumers Use “Buy Now, Pay Later”?." Liberty Street Economics (2024).
Akana, Tom, and Valeria Zeballos Doubinko. "4-in-6 Payment Products—Buy Now, Pay Later: Insights from New Survey Data." Federal Reserve Bank of Philadelphia, Consumer Finance Institute, February 22 (2024).
Bian, Wenlong, Lin William Cong, and Yang Ji. The rise of e-wallets and buy-now-pay-later: Payment competition, credit expansion, and consumer behavior. No. w31202. National Bureau of Economic Research, 2023.
Berends, Marissa. 2025. “How Buy Now, Pay Later Loans Are Starting to Affect Your Credit Score.” Capitol Lien. October 16, 2025. https://capitollien.com/how-buy-now-pay-later-loans-are-starting-to-affect-your-credit-score/
Berg, Tobias, Valentin Burg, Jan Keil, and Manju Puri. "The Economics of Buy Now, Pay Later (BNPL) from a Merchant's Perspective." (2024).
Bomey, Nathan. 2025. “FICO to Incorporate Buy-Now-Pay-Later Loans into Credit Scores.” Axios, June 23, 2025. https://www.axios.com/2025/06/23/fico-credit-scores-bnpl-buy-now-pay-later.
Brevoort and Kambara, “CFPB Data Point: Becoming Credit Visible” (June 2017) at https://www.consumerfinance.gov/about-us/newsroom/consumer-financial-protection-bureau-study-finds-consumers-lower-income-areas-are-more-likely-become-credit-visible-due-negative-records/ .
Broadbent, Grace. 2025. "BNPL Growth Is Slowing as the Industry Matures." eMarketer. March 3, 2025. https://www.emarketer.com/content/bnpl-growth-slowing-industry-matures.
Cocheo, Steve. 2024. “Buy Now, Pay Later Needs to Pay Off in 2024.” The Financial Brand. January 25, 2024. https://thefinancialbrand.com/news/buy-now-pay-later/bnpl-efforts-evolve-as-credit card-become-tougher-for-some-174279.
Consumer Financial Protection Bureau. The Buy Now, Pay Later Market. December 10, 2025. https://www.consumerfinance.gov/data-research/research-reports/the-buy-now-pay-later-market/.
DeHaan, Ed, Jungbae Kim, Ben Lourie, and Chenqi Zhu. "Buy now pay (pain?) later." Management Science 70, no. 8 (2024): 5586-5598.
Di Maggio, Marco, Emily Williams, and Justin Katz. Buy now, pay later credit: User characteristics and effects on spending patterns. No. w30508. National Bureau of Economic Research, 2022.
Dong, Yanfei, Jiayin Hu, Yiping Huang, Han Qiu, and Yingguang Zhang. "The use and disuse of FinTech credit: When buy-now-pay-later meets credit reporting." Available at SSRN 4783923 (2024).
Federal Reserve Bank of New York, Research and Statistics Group. Quarterly Report on Household Debt and Credit, 2023: Q4. Released February 2024. https://www.newyorkfed.org/medialibrary/interactives/householdcredit/data/pdf/hhdc_2023q4.pdf?sc_lang=en.
Federal Reserve Bank of Philadelphia. Large Bank Credit Card and Mortgage Data. Accessed Jan. 22, 2026, https://www.philadelphiafed.org/surveys-and-data/large-bank-credit-card-and-mortgage-data.
FICO. 2025. “FICO Unveils Groundbreaking Credit Scores That Incorporate Buy Now, Pay Later Data.” Press release, June 23, 2025. Businesswire. https://www.businesswire.com/news/home/20250623623014/en/FICO-Unveils-Groundbreaking-Credit-Scores-That-Incorporate-Buy-Now-Pay-Later-Data.
Greene, Claire, Julian Perry, and Joanna Stavins. "Consumer Payment Behavior by Income and Demographics." (2024).
Guttman-Kenney, Benedict, Chris Firth, and John Gathergood. "Buy now, pay later (BNPL)... on your credit card." Journal of Behavioral and Experimental Finance 37 (2023): 100788.
Gambacorta, Leonardo, Yiping Huang, Han Qiu, and Jingyi Wang. "How do machine learning and non-traditional data affect credit scoring? New evidence from a Chinese fintech firm." (2019).
Jagtiani, Julapa, and Catharine Lemieux. "Fintech lending: Financial inclusion, risk pricing, and alternative information." Risk Pricing, and Alternative Information (December 26, 2017) (2017).
Klarna Bank AB. 2024. “Why Klarna Does Not Report BNPL Payments to US Credit Bureaus.” Press release, May 13, 2024. https://www.klarna.com/international/press/why-klarna-does-not-report-bnpl-payments-to-us-credit-bureaus/.
Klarna Bank AB, 2024. “Klarna Will Begin Sharing Term Loan Data with Credit Bureaus.” Klarna International. September 26, 2024. https://www.klarna.com/international/press/klarna-will-begin-sharing-term-loan-data-with-credit-bureaus/
Larrimore, Jeff, Alicia Lloro, Zofsha Merchant, and Anna Tranfaglia. "" The Only Way I Could Afford It": Who Uses BNPL and Why." (2024).
Laudenbach, Christine, Elin Molin, Kasper Roszbach, and Talina Sondershaus. "Buy Now Pay (Less) Later: Leveraging Private BNPL Data in Consumer Banking." Available at SSRN 5117651 (2025).
Maesen, Stijn, and Dionysius Ang. "Buy now, pay later: Impact of installment payments on customer purchases." Journal of marketing 89, no. 3 (2025): 13-35.
Ngo, Hien An. 2024. “Why More Americans Are Turning to Buy Now, Pay Later Payment Plans, in 4 Charts.” CNN, December 15, 2024. https://www.cnn.com/2024/12/15/business/buy-now-pay-later-services-shopping-dg.
Shupe, Cortnie, Greta Li, and Scott Fulford. "Consumer Use of Buy Now, Pay Later Insights from the CFPB Making Ends Meet Survey." Consumer Financial Protection Bureau Office of Research Reports Series 23-1 (2023).
Stavins, Joanna. "Buy now, pay later: Who uses it and why." Federal Reserve Bank of Boston Research Paper Series Current Policy Perspectives Paper 2024-3 (2024).
We are thankful to the many people who made essential contributions to this research. We are indebted to our internal partners and colleagues who support delivery of our agenda in a myriad of ways, and we acknowledge their contributions to all of our work.
This material is a product of JPMorganChase Institute and is provided to you solely for general information purposes. Unless otherwise specifically stated, any views or opinions expressed herein are solely those of the authors listed and may differ from the views and opinions expressed by J.P. Morgan Securities LLC (JPMS) Research Department or other departments or divisions of JPMorgan Chase & Co. or its affiliates. This material is not a product of the Research Department of JPMS. Information has been obtained from sources believed to be reliable, but JPMorgan Chase & Co. or its affiliates and/or subsidiaries (collectively J.P. Morgan) do not warrant its completeness or accuracy. Opinions and estimates constitute our judgment as of the date of this material and are subject to change without notice. No representation or warranty should be made with regard to any computations, graphs, tables, diagrams or commentary in this material, which is provided for illustration/reference purposes only. The data relied on for this report are based on past transactions and may not be indicative of future results. J.P. Morgan assumes no duty to update any information in this material in the event that such information changes. The opinion herein should not be construed as an individual recommendation for any particular client and is not intended as advice or recommendations of particular securities, financial instruments, or strategies for a particular client. This material does not constitute a solicitation or offer in any jurisdiction where such a solicitation is unlawful.
Wheat, Christopher, Makada Henry-Nickie, Scott Kim, Michael Neal, and Anthony Francisco. 2026. "Convenience or Liquidity Valve? Buy Now, Pay Later and Homeowner Balance Sheets." JPMorgan Chase Institute.
Footnotes
Affirm now reports to Experian and TransUnion and has publicly argued that full-fill reporting gives consumers an opportunity to build credit when they repay on time. By contrast, several other large providers have stated that they will not report short-term Pay-in-4 loans under current U.S. scoring conventions while agreeing to report longer-term, interest-bearing loans (Klarna, 2024), Meanwhile some analysts argue that reporting Pay-in-4 loans warrants caution citing concerns that legacy models treat these loans as high-utilization, short-maturity tradelines that can depress scores even when payments are made on schedule (Berends, 2025).
We leverage a fundamental division between FHA-insured and conventional mortgages. FHA has a stated mission to increase access to homeownership by serving borrowers who may not meet conventional underwriting standards governing credit scores and downpayments. In contrast, conventional, conforming loans purchase by the GSEs adhere to tighter requirements that typically dictate higher credit scores, lower debt-to-income ratios, and larger downpayments. The programmatic differentiation allows us to observe financial behaviors across different dimensions of financial constraints.
This supplementary sample is a 10 percent random sample of all individuals in the customer base who meet the standard bank activity criteria. The sample includes both BNPL-using and non-BNPL using individuals regardless of housing tenure.
Our data shows the average total purchase amount for Pay-in-4 by homeowners is $123.68.
To quantify BNPL prevalence we use the 10 percent random sample filtered to 2022, and find that 21.5 percent of our customer sample used BNPL, this adoption rate is in line with estimates from CFPB and the Federal Reserve Bank of Philadelphia’s Consumer Finance Institute Survey Data.
Regression tables detailing model specifications are available in the appendix.
Figure 1 displays estimates from our extensive margin regression model that analyzes the decision to use BNPL across years. We use standardized estimates for ease of comparison; coefficients represent the effect of a one standard deviation change in the respective factor on likelihood of ongoing reliance.
We exponentiated terms from coefficients in Appendix Table A1 to convert the change in the log odds of an outcome into the change in odds.
Within the frequent-user group, series counts are widely dispersed; many initiate more than 4 series and roughly 70% are at or below 12 series.
The mortgage event is shown at t = 0 in Figure 2. Since new mortgage tradelines appear in credit bureau data with a reporting lag, we anchor t = 0 to 30 days before the tradeline’s first report, aligning our event timeline with the actual closing date.
Estimates include person fixed effects, which difference out each individual’s overall characteristics or propensities, such as typical spending levels, BNPL tendencies or other unobservable attributes. We also include calendar fixed effects, to net out seasonality, broader secular growth, and economy wide trends that affect all homeowners in the sample. The event-time paths shown in Figure 2 reflect within-household deviations. We restrict all analyses to include Pay-in-4 loans only as it concentrates in essential, everyday retail sectors rather than durables as with monthly BNPL installment loans. This restriction mitigates concerns about compositional spending shifts or additional selection effects, such as sector mix, that affects some consumer segments more than others. We conducted robustness checks by including time-varying controls as an extension of the parsimonious models and find very similar results.
A share/ratio outcome normalizes BNPL by the household’s contemporaneous spending scale, making the coefficient interpretable as BNPL’s contribution relative to the household’s overall spend rather than a level effect that mechanically scales with income or account size. Because the outcome is a ratio, a post-event increase can reflect growth in BNPL dollars, a contraction in the base, or both. We rely on flat pre-trends, fixed effects, and cross-model coherence to interpret the post-loss increase as substantive rather than purely mechanical.
Our OLS model includes person fixed effects to difference out time-invariant household characteristics and time fixed effects to absorb common shocks. We also include controls for deposits, credit scores, credit card utilization, and income, which indicate indicating no anticipatory BNPL use before receiving UI.
We group homeowners by top and bottom income quintiles based on their recurrent income inflows in the three months preceding receiving unemployment insurance.
Not a compositional artifact of unemployment duration; results are qualitatively consistent when segmenting samples by length of UI spells.
19.5% of our homeowners use BNPL products in every quarter after their first use and 38.3% use BNPL in at least 75% of quarters following their first use of BNPL.
We leverage a fundamental division between FHA-insured and conventional mortgages. FHA has a stated mission to increase access to homeownership by serving borrowers who may not meet conventional underwriting standards governing credit scores and downpayments. In contrast, conventional, conforming loans purchase by the GSEs adhere to tighter requirements that typically dictate higher credit scores, lower debt-to-income ratios, and larger downpayments. The programmatic differentiation allows us to observe financial behaviors across different dimensions of financial constraints.
Authors

Chris Wheat
President, JPMorganChase Institute

Makada Henry-Nickie
Housing Finance Research Director, JPMorganChase Institute

Anthony Francisco
Housing Finance Senior Associate

Michael Neal
Senior Fellow, Housing Finance Policy Center, Urban Institute

Scott Kim
Former Housing Finance Research Associate
Media Contact
Shelby Wagenseller, Shelby.Wagenseller@jpmchase.com