
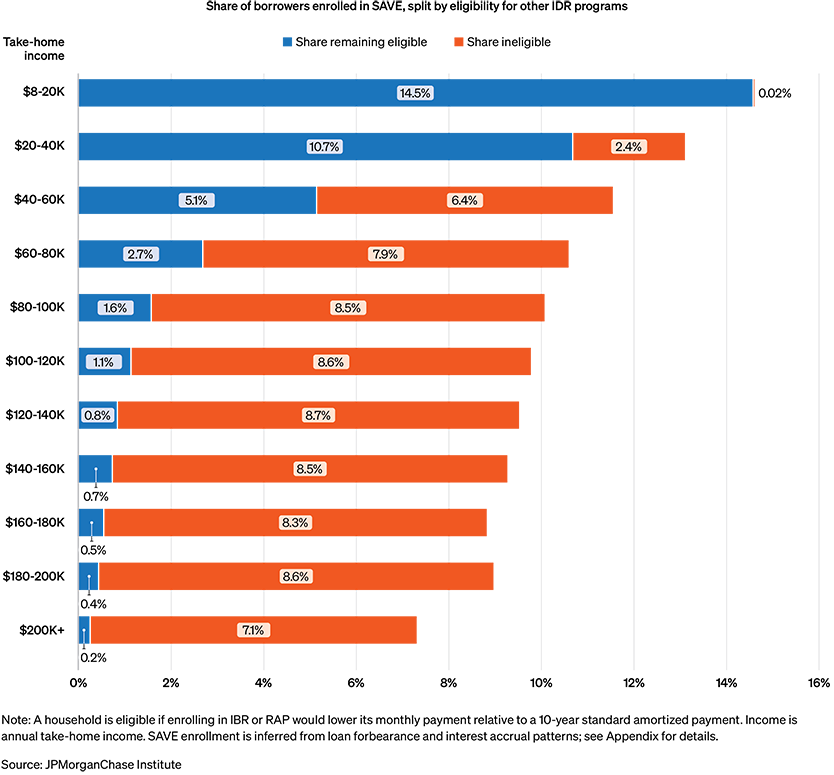
Figure 1: Share of borrowers enrolled in SAVE, split by eligibility for other IDR programs

Creating thriving communities together
See how our clients and partners—from small business owners to workforce training leaders—work with JPMorganChase to drive meaningful impact and economic growth where they live and work.
Learn moreLatest news

Veteran’s Unconventional Path to Landing her Dream Job in Tech
U.S. Army Veteran Ashley Wigfall transitioned to a civilian role and charted her path to technologist through mentorship and skills training at the JPMorgan Chase tech hub in Plano, Texas.
Learn more
Research
October 8, 2026
About 7 million borrowers will need to choose a new repayment plan and resume payments with the end of the Saving on a Valuable Education (SAVE) student loan repayment program. New JPMorganChase Institute research examines which borrowers could still lower their monthly payments through another income-driven repayment (IDR) plan—providing a benchmark for what successful re-enrollment could look like and mean for household budgets.
This page provides a summary of key insights (2 min read). You can read the full report with additional figures and methodologies here.
Most SAVE borrowers with lower incomes remain eligible for reduced payments through a remaining IDR plan, while higher-income borrowers make up the majority of those expected to lose eligibility. With full re-enrollment of eligible borrowers, IDR participation and payment burdens would be similar to those before the pandemic.
By the numbers: We find that 37 percent of SAVE borrowers could lower their payments through another IDR plan, and re-enrollment would make a substantial difference in their payment burden.
Payment burden hinges on enrollment: Eligible borrowers who re-enroll in IDR typically face payments around 3% of take-home income; without IDR, burdens rise to roughly 12%.
The 37 percent eligibility estimate is a benchmark for “full” IDR re-enrollment among former SAVE borrowers. If observed IDR enrollment lands meaningfully below that level, it may indicate frictions (awareness, paperwork, servicing bottlenecks) that keep some eligible borrowers from getting lower payments.
We analyzed de-identified administrative banking and matched credit bureau data covering ~740,000 households to compare projected student loan payments with current income and spending.
Read the report to explore how payments could change after SAVE and how borrower eligibility varies by income and age.
Authors
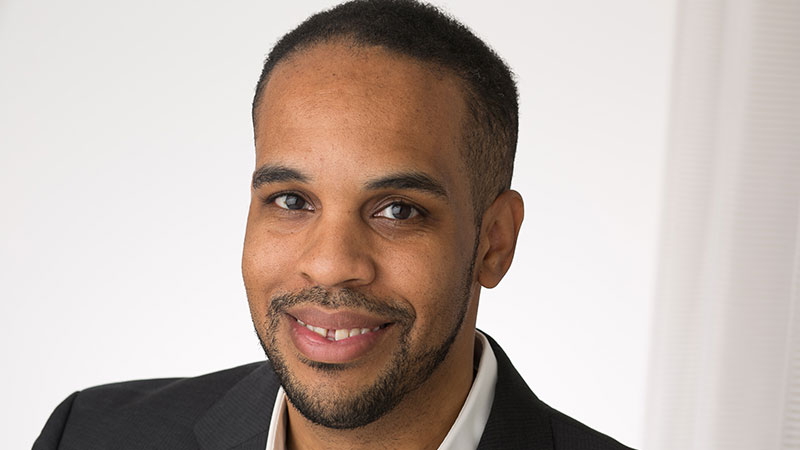
Chris Wheat
President, JPMorganChase Institute
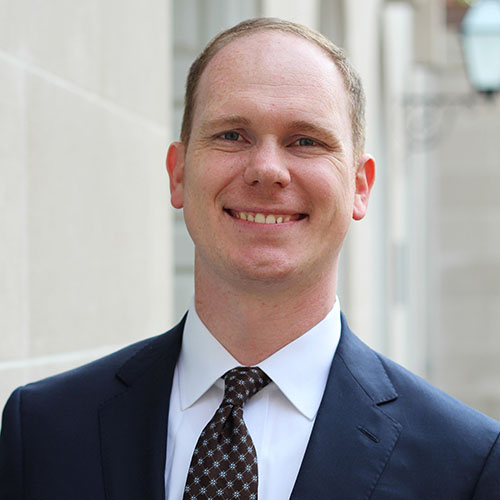
Daniel M. Sullivan
Consumer Research Director, JPMorganChase Institute

Alexandra Lefevre
Consumer Research Vice President, JPMorganChase Institute
Media Contact
Shelby Wagenseller,
Shelby.Wagenseller@jpmchase.com