Research

Paying Out-of-Pocket

The Healthcare Spending of 2 Million U.S. Families

August 1, 2017

Findings

Executive summary  Data

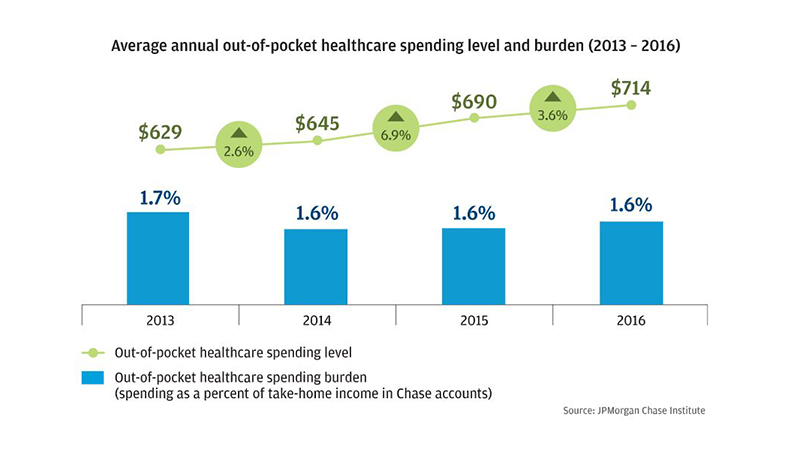
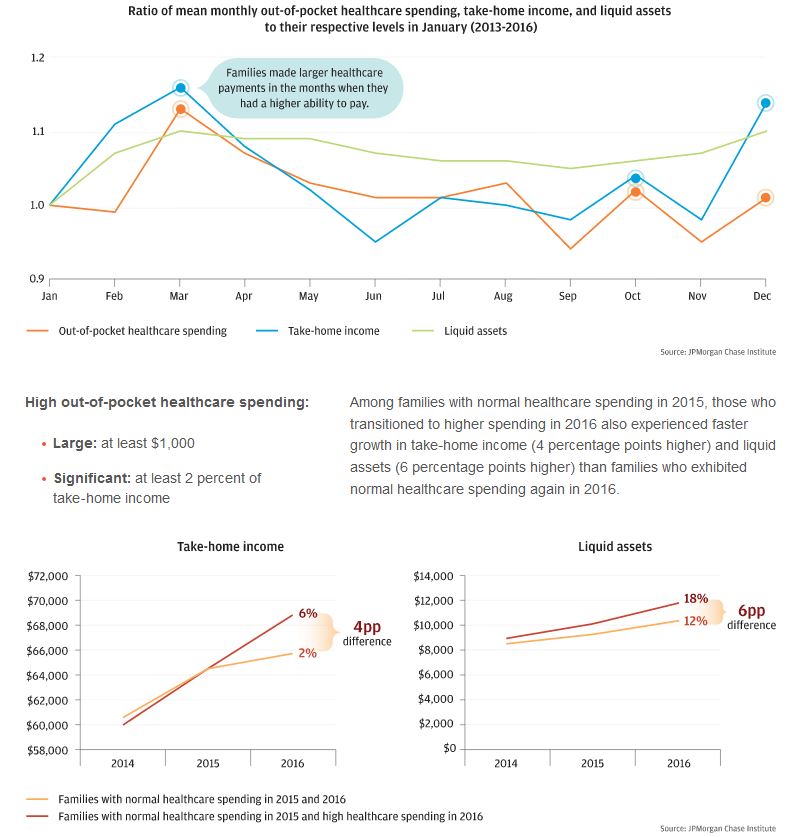
Healthcare costs are rising for families. In 2015, the US spent 18 percent of Gross Domestic Product (GDP) on healthcare, up from 13 percent in 2000. For every dollar spent on healthcare, families paid 11 cents out-of-pocket and 28 cents after including insurance costs. While the Centers for Medicare and Medicaid Services projects health spending to continue to grow faster than GDP through 2025, the future of family-paid healthcare costs also rests with policy choices currently being debated. Out-of-pocket costs are a key piece of that picture.

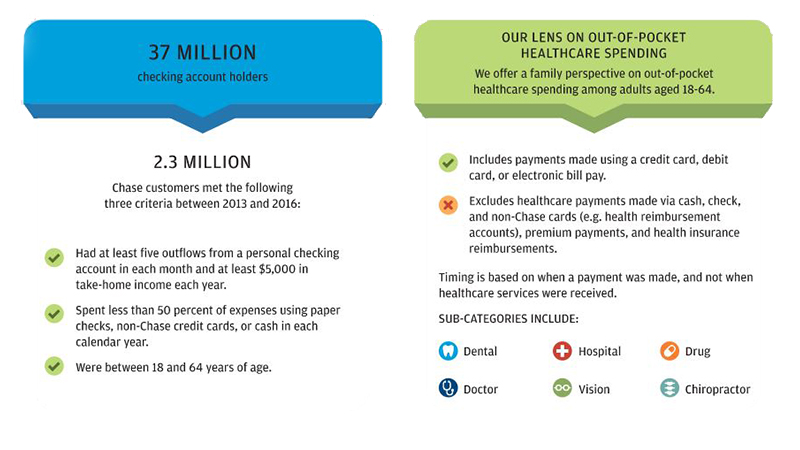
The JPMorgan Chase Institute set out to better understand out-of-pocket healthcare spending among US households. Building off a sample of 2.3 million de-identified core Chase customers aged 18 to 64 between 2013 and 2016, we created the JPMorgan Chase Institute Healthcare Out-of-pocket Spending Panel (JPMCI HOSP). We explored the levels, concentration, and growth of out-of-pocket healthcare spending and the implications of these spending trends for overall household financial health. The JPMCI HOSP provides a first-ever look into out-of-pocket healthcare spending for households on a month-to-month basis, at the state, metro, and county level, and as recent as 2016. In this report, we describe the creation of, and initial insights gleaned from, this new data asset.

01

Out-of-pocket healthcare spending grew between 2013 and 2016, but remained a relatively constant share of take-home income.

Families spent on average $714 or 1.6 percent of their take-home income on out-of-pocket healthcare spending in 2016. Out-of-pocket healthcare spending grew by an average annual rate of 4.3 percent.

Average annual out-of-pocket healthcare spending level and burden (2013-2016)

Year Spending burden Spending level Year-over-year growth rate in spending level
2013 1.7% $629 N/A
2014 1.6% $645 2.6%
2015 1.6% $690 6.9%
2016 1.6% $714 3.6%

Source: JPMorgan Chase Institute

01

The financial burden of out-of-pocket healthcare spending was highest for older, lower-income, and female account holders and increased in 2016 for low-income account holders.

Out-of-pocket healthcare spending as a percent of take-home income by year and demographic characteristics of the primary account holder

By age

Age 2015 2016
18-25 1.2% 1.2%
26-34 1.4% 1.4%
35-44 1.6% 1.6%
45-54 1.6% 1.7%
55-64 1.9% 1.9%


By quintile of take-home income

Quintile of take-home income 2015 2016
1: <$24,000 2.5% 2.8%
2: $24,000 to $38,000 1.6% 1.6%
3: $38,000 to $57,000 1.4% 1.4%
4: $57,000 to $92,000 1.3% 1.3%
5: >$92,000 1.0% 1.0%


By gender

Gender 2015 2016
Women 1.8% 1.8%
Men 1.4% 1.5%

Source: JPMorgan Chase Institute

01

Doctor, dental, and hospital payments accounted for more than half of observed healthcare spending. Dental and hospital payments were less common but larger in magnitude.

Percent of total out-of-pocket healthcare spending by healthcare category in 2016

Doctor, dental, and hospital payments accounted for more than half of observed healthcare spending. Dental and hospital payments were less common but larger in magnitude.

Percent of total out-of-pocket healthcare spending by healthcare category in 2016

Category Percent
Doctor 22%
Drug 8%
Dental 21%
Vision 10%
Hospital 12%
Chiropractor 3%
Other* 24%


Category Percent
Doctor 52%
Drug 44%
Dental 32%
Vision 32%
Hospital 27%
Chiropractor 8%
Other* 53%


Average positive healthcare spending by healthcare category in 2016

Category Average spending
Doctor $293
Drug $125
Dental $465
Vision $232
Hospital $325
Chiropractor $268
Other* $330

*Other healthcare services included non-doctor services or products, such as medical supplies, lab tests, and home health services.

Source: JPMorgan Chase Institute

© 2018 JPMorgan Chase & Co.

01

Out-of-pocket healthcare spending was highly concentrated among a few families—often the same families year-over-year. The top 10 percent spent 9 percent of their take-home income on out-of-pocket healthcare expenses.

Percent of total out-of-pocket healthcare spending by precentile of healthcare spending in 2016

OUT-OF-POCKET HEALTHCARE SPENDING WAS HIGHLY CONCENTRATED AMONG A FEW FAMILIES—OFTEN THE SAME FAMILIES YEAR-OVER-YEAR. THE TOP 10 PERCENT SPENT 9 PERCENT OF THEIR TAKE-HOME INCOME ON OUT-OF-POCKET HEALTHCARE EXPENSES.

Out-of-pocket healthcare spending was highly concentrated among a small segment of the population. The top 10 percent of healthcare spenders contributed 49 percent of total out-of-pocket spending in 2016. Seventeen percent of families had no healthcare spending in 2016.

Percent of total out-of-pocket healthcare spending by precentile of healthcare spending in 2016


Percentile of healthcare spending Percent of total out-of-pocket healthcare spending
0-10th 0%
10-20th 0%
20-30th 1%
30-40th 2%
40-50th 3%
50-60th 5%
60-70th 8%
70-80th 12%
80-90th 21%
90-100th 49%


The top 10 percent of families in terms of healthcare burden spent 9 percent of their take-home income on out-of-pocket healthcare expenses—as much as a typical family spends on all combined utility and cell phone bills in a year—and 48 percent of them did so again the following year.

Year one

The top 10 percent of families in terms of healthcare burden spent 9% of their take-home income on out-of-pocket healthcare expenses.

That 9% is roughly the amount that one family spends on cell phone and utility bills per year.

Year two

Roughly HALF of these families spent 9% of their take-home income AGAIN the next year.

Source: JPMorgan Chase Institute

© 2018 JPMorgan Chase & Co.


The top 10 percent of families in terms of healthcare burden spent 9 percent of their take-home income on out-of-pocket healthcare expenses—as much as a typical family spends on all combined utility and cell phone bills in a year—and 48 percent of them did so again the following year.

01

Families made larger healthcare payments in the months and the years when they had a higher ability to pay. Elevated dental and hospital payments primarily contributed to high healthcare spending.

Monthly out-of-pocket healthcare spending was highly correlated with monthly take-home income. In each year during 2013-2016, families had the highest out-of-pocket healthcare spending in months of elevated income: March and April (tax refund season), October, and December.

Ratio of mean monthly out-of-pocket healthcare spending, take-home income, and liquid assets to their respective levels in January (2013-2016)

FAMILIES MADE LARGER HEALTHCARE PAYMENTS IN THE MONTHS AND THE YEARS WHEN THEY HAD A HIGHER ABILITY TO PAY. ELEVATED DENTAL AND HOSPITAL PAYMENTS PRIMARILY CONTRIBUTED TO HIGH HEALTHCARE SPENDING.

Monthly healthcare spending was highly correlated with monthly take-home income. In each year during 2013-2016, families had the highest out-of-pocket healthcare spending in months of elevated income: March and April (tax refund season), October, and December.

Ratio of mean monthly out-of-pocket healthcare spending, take-home income, and liquid assets to their respective levels in January (2013-2016)


Month Out-of-pocket healthcare spending Take-home income Liquid assets
Jan 1.00 1.00 1.00
Feb 0.99 1.11 1.07
Mar 1.13 1.16 1.10
Apr 1.07 1.08 1.09
May 1.03 1.02 1.09
Jun 1.01 0.95 1.07
Jul 1.01 1.01 1.06
Aug 1.03 1.00 1.06
Sep 0.94 0.98 1.05
Oct 1.02 1.04 1.06
Nov 0.95 0.98 1.07
Dec 1.01 1.14 1.10


High healthcare spending is defined by:

  • Large: at least $1,000
  • Significant: at least 2 percent of take-home income

Among families with normal healthcare spending in 2015, those who transitioned to higher spending in 2016 also experienced faster growth in take-home income (4 percentage points higher) and liquid assets (6 percentage points higher) than families who exhibited normal healthcare spending again in 2016.


Take-home income

  Take-home income for families with normal healthcare spending in 2015 and 2016 Take-home income for families with normal healthcare spending in 2015 and high healthcare spending in 2016
Year Level Percent growth from 2015 to 2016 Level Percent growth from 2015 to 2016
2014 $55,688 N/A $55,179 N/A
2015 $59,034 N/A $59,193 N/A
2016 $60,366 2% $62,659 6%


Liquid assets

  Liquid Assets for families with normal healthcare spending in 2015 and 2016 Liquid Assets for families with normal healthcare spending in 2015 and high healthcare spending in 2016
Year Level Percent growth from 2015 to 2016 Level Percent growth from 2015 to 2016
2014 $8,590 N/A $8,789 N/A
2015 $9,393 N/A $10,090 N/A
2016 $10,487 12% $11,896 18%

Source: JPMorgan Chase Institute

© 2018 JPMorgan Chase & Co.

01

There was dramatic variation in out-of-pocket healthcare spending across and within our 23 states. Families in Colorado spent the most on healthcare, while families in Louisiana spent the highest fraction of their gross income on healthcare.

JPMCI HOSP Data Asset

From a universe of 37 million checking account holders, we assembled a de-identified sample of approximately 2.3 million Chase customers. We offer a family perspective on out-of-pocket healthcare spending among adults aged 18 to 64.

2.3 million Chase customers met the following three criteria between 2013 and 2016

From a universe of 37 million checking account holders, we assembled a de-identified sample of approximately 2.3 million Chase customers. We offer a family perspective on out-of-pocket healthcare spending among adults aged 18 to 64.

2.3 million Chase customers met the following three criteria between 2013 and 2016:

  • Had at least five outflows from a personal checking account in each month and at least $5,000 in take-home income each year.
  • Spent less than 50 percent of expenses using paper checks, non-Chase credit cards, or cash in each calendar year.
  • Were between 18 and 64 years of age.

OUR LENS ON OUT-OF-POCKET HEALTHCARE SPENDING

We offer a family perspective on out-of-pocket healthcare spending among adults aged 18-64.

  • Includes payments made using a credit card, debit card, or electronic bill pay.
  • Excludes healthcare payments made via cash, check. and non-Chase cards (e.g. health reimbursement accounts), premium payments, and health insurance reimbursements.

Timing is based on when a payment was made, and not when healthcare services were received.

SUB-CATEGORIES INCLUDE:

  • Dental
  • Hospital
  • Drug
  • Doctor
  • Vision
  • Chiropractor

Source: JPMorgan Chase Institute

Conclusion

The JPMorgan Chase Institute Healthcare Out-of-pocket Spending Panel (JPMCI HOSP) offers several key insights as we evaluate proposed changes to our healthcare policies. First, out-of-pocket healthcare expenses represent a stable share of household income in aggregate, but are a source of financial strain for certain families. Healthcare reform should take into consideration the impact on households who are more financially burdened by healthcare expenses—specifically older, low-income, and female account holders. Second, healthcare spending may be large, unexpected, and concentrated in the months and years when families have a higher ability to pay. As such, consumers would benefit from more transparent pricing and payment options to better manage healthcare expenses. Third, cost containment measures, including value-based care, could have meaningful impacts on costs borne by families, not just by insurers and healthcare providers. Finally, wide variation in levels and burden of healthcare spending across geographies underscores the importance of healthcare as a state and local policy issue.

References

2.

Average estimated annual gross income reflects the annual pre-tax estimate of family income for each account holder ascertained by JPMorgan Chase using individual, third-party, and zip code-level data.

Authors

Diana Farrell

Diana Farrell

Founding and Former President & CEO

Fiona Greig

Fiona Greig

Former Co-President