
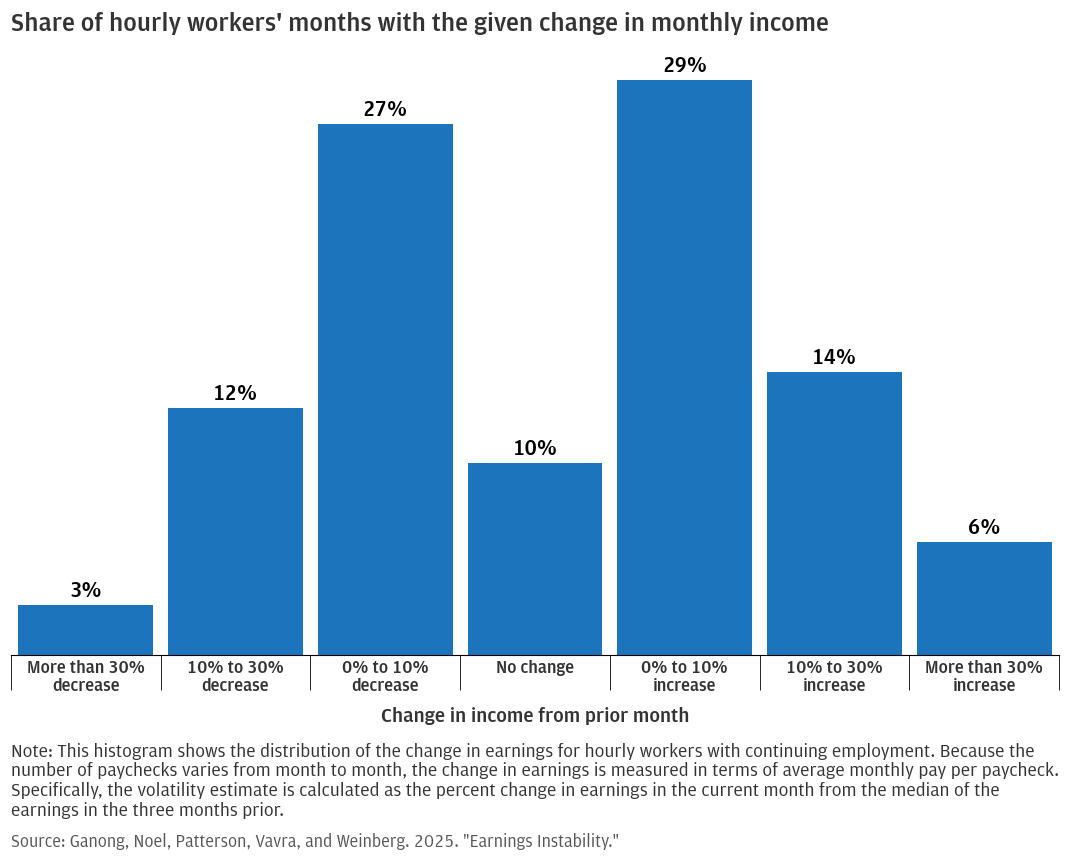
Figure 1: Month-to-month changes in hourly workers’ pay are rarely zero and often negative.
Latest news

An Ohio-based company is protecting first responders around the world
With support from JPMorganChase, Fire-Dex is providing protective equipment to firefighters in 100 countries and all 50 states.
Learn moreLatest news

Veteran’s Unconventional Path to Landing her Dream Job in Tech
U.S. Army Veteran Ashley Wigfall transitioned to a civilian role and charted her path to technologist through mentorship and skills training at the JPMorgan Chase tech hub in Plano, Texas.
Learn more
Research
September 30, 2025
For many workers, steady employment does not lead to steady income. While workers’ annual incomes and hourly wages are relatively stable, new research using JPMorganChase Institute data finds that workers’ incomes vary considerably month-to-month. This is a source of significant financial risk for many households: unpredictable paychecks make it hard to plan spending and bill payments and can make households less resilient to unplanned expenses.
The research finds:
These findings imply that a worker’s employment status and annual income can belie significant financial insecurity—two workers with the same annual income but different amounts of earnings stability may face very different financial risks. Moreover, this month-to-month earnings instability is nearly impossible to detect in the annual data used by most analysts. Finally, because workers are more likely to quit jobs with less earnings stability, increasing the stability of workers’ earnings could benefit both workers and employers.
There are many reasons why a worker’s hours and paycheck might change from one pay period to the next. An employer might schedule a worker for fewer hours than normal. A worker might be sick or give a shift to a co-worker to care for their child. How much does this instability in earnings cost workers? If instability is rare, or driven mostly by workers’ own desire for flexibility, it may not be costly at all. If earnings instability is common and driven more by employers’ needs or choices, it could impose significant costs on workers. When pay is unpredictable, it becomes harder to prioritize bill payments and more generally plan future spending. Institute research has previously found that many households rely on their discretionary income to deal with emergency expenses. Unexpected disruptions to discretionary income could leave a household financially vulnerable.
New research by JPMorganChase Institute fellows at the University of Chicago provides evidence that earnings instability is common among hourly workers, is driven primarily by employers, and is very costly. Workers value earnings stability, and when employers can find solutions to reduce earnings instability, it can benefit both workers and employers. Read the full report here.
Fortunately, earnings instability is not very persistent: if a worker’s earnings drop suddenly in a given month, they have a high chance of bouncing back quickly. These changes are typically short-term shocks that do not carry over from one year to the next. However, this means detecting earnings instability is nearly impossible using annual data, which is much more commonly available than the monthly earnings data used here. As a result, standard annual income measures may give the impression of stability, while workers are actually navigating frequent financial ups and downs.
Figure 1: Month-to-month changes in hourly workers’ pay are rarely zero and often negative.
For most workers, regular seasonal fluctuations in the labor market do not explain the significant earnings instability observed in the data, nor does unpaid leave hourly workers may take to care for family or go on vacation. The majority of earnings instability appears to be driven by employers. Employers frequently change the total number of hours they demand from workers—if a manufacturing firm gets an unusually small number of orders, all workers may get their hours cut—and this accounts for roughly half of workers’ earnings instability. Idiosyncratic scheduling also contributes significantly—that is, the firm needs the same amount of labor every month but any specific worker’s schedule changes from month to month.
How much does earnings instability cost workers? One way to measure the cost is by looking at consumption. If a worker can fully adapt to and anticipate the fluctuations in their earnings, it suggests that instability imposes very little inconvenience. However, the data show that almost a quarter of earnings instability is passed through to workers’ spending. When earnings instability increases 10 percentage points, spending instability increases by 2.3 percentage points.
Another way to measure the costs of earnings instability is to compare how much workers prefer low-volatility employers to high-volatility ones based on job quit rates and wage differentials. How often are workers willing to take a job with more stability even though it pays a little less? The research finds that workers are more likely to quit more volatile employers. The revealed preference of workers for jobs with more stability makes it possible to estimate directly how much workers value stability. Estimates in the report suggest that the typical hourly worker would accept a pay cut of 4–11 percent to have the same volatility as the typical salaried worker. That is, reducing schedule and earnings uncertainty is as valuable to workers as a moderate pay raise.
Taken together, these findings point to broader implications for financial security and inequality, with important considerations for workers, firms, and policymakers.
This material is a product of JPMorganChase Institute and is provided to you solely for general information purposes. Unless otherwise specifically stated, any views or opinions expressed herein are solely those of the authors listed and may differ from the views and opinions expressed by J.P. Morgan Securities LLC (JPMS) Research Department or other departments or divisions of JPMorgan Chase & Co. or its affiliates. This material is not a product of the Research Department of JPMS. Information has been obtained from sources believed to be reliable, but JPMorgan Chase & Co. or its affiliates and/or subsidiaries (collectively J.P. Morgan) do not warrant its completeness or accuracy. Opinions and estimates constitute our judgment as of the date of this material and are subject to change without notice. No representation or warranty should be made with regard to any computations, graphs, tables, diagrams or commentary in this material, which is provided for illustration/reference purposes only. The data relied on for this report are based on past transactions and may not be indicative of future results. J.P. Morgan assumes no duty to update any information in this material in the event that such information changes. The opinion herein should not be construed as an individual recommendation for any particular client and is not intended as advice or recommendations of particular securities, financial instruments, or strategies for a particular client. This material does not constitute a solicitation or offer in any jurisdiction where such a solicitation is unlawful.
We are thankful to the many people who made essential contributions to this research, especially the JPMorganChase Institute fellows and others who authored the original study: Peter Ganong, Pascal Noel, Christina Patterson, Joseph S. Vavra, and Alexander Weinberg. This summary of the research was written by Daniel M. Sullivan.
In addition, we are indebted to our internal partners and colleagues, who support delivery of our agenda in a myriad of ways and acknowledge their contributions to each and all releases.
Media Contact
Shelby Wagenseller,
Shelby.Wagenseller@jpmchase.com