

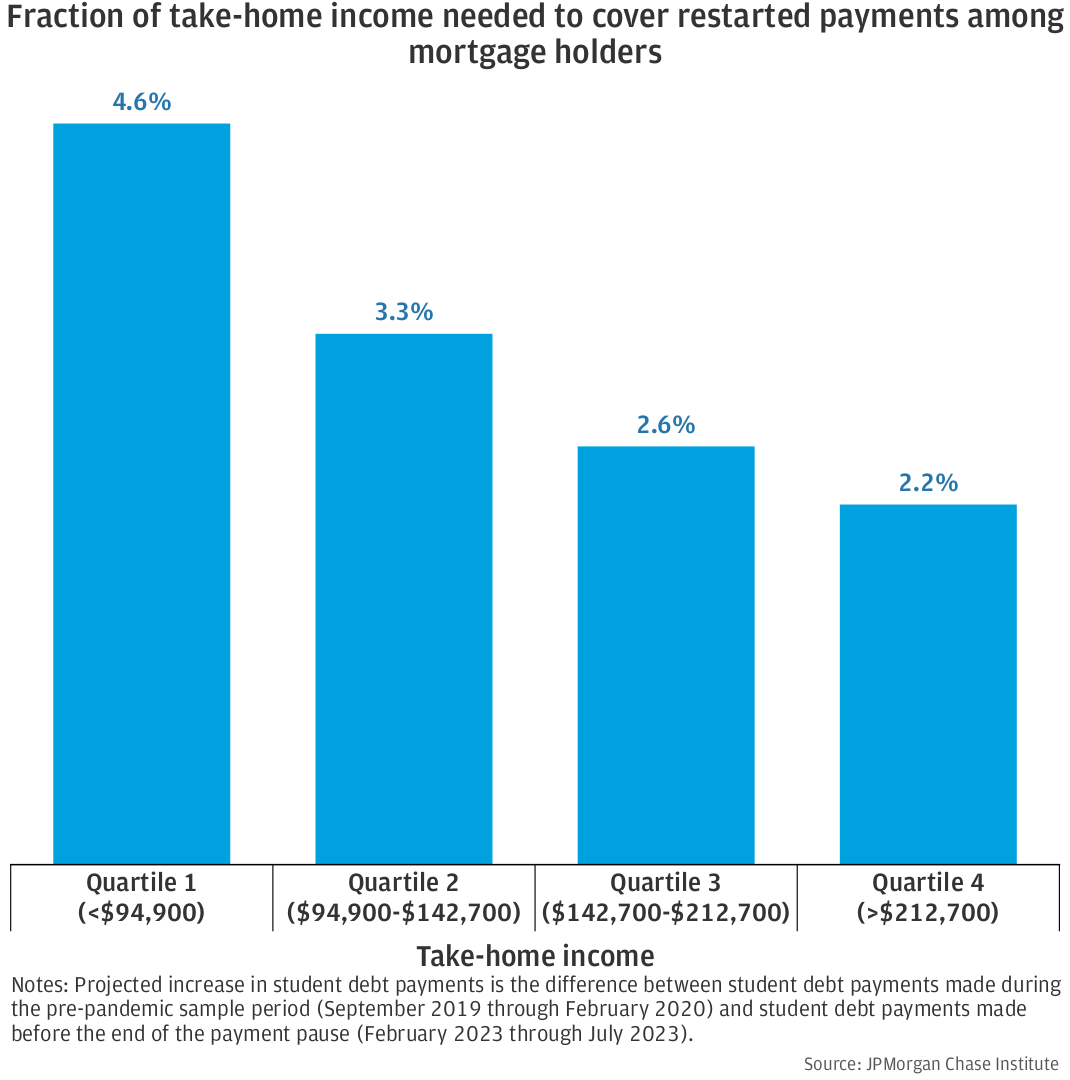
Figure 1 : Lower-income mortgage holders will need to adjust their budgets more to account for restarted payments
Latest news

An Ohio-based company is protecting first responders around the world
With support from JPMorganChase, Fire-Dex is providing protective equipment to firefighters in 100 countries and all 50 states.
Learn moreLatest news

Veteran’s Unconventional Path to Landing her Dream Job in Tech
U.S. Army Veteran Ashley Wigfall transitioned to a civilian role and charted her path to technologist through mentorship and skills training at the JPMorgan Chase tech hub in Plano, Texas.
Learn more
With the three-year moratorium on student loan payments having ended in October 2023, more than 28 million borrowers are now confronted with the reality of resuming payments.1 Household finances have changed dramatically since the beginning of the pandemic: Incomes have risen, but so has the cost of living.2 Consumers built up large cash buffers in 2020 and 2021, but those excess cash reserves are now depleted for many.3 Student loan payments may not fit into borrowers’ budgets like they did before the pandemic. This situation is particularly acute for borrowers who are managing both student debts and mortgage obligations, as historically high mortgage rates have made refinancing or downsizing much more costly.
This report sheds light on the possible spending adjustments these households will need to make in the face of their restarted student loan payments. We use de-identified administrative banking data from Chase checking and savings accounts to measure households’ income and expenses, and we project how much a household’s student loan payments will increase in coming months based on their student loan payments right before the pandemic.
Our analysis suggests that budget reallocations will be modest for most households, but many may need to decrease their other expenses to cover their student debt payments. Our key findings are:
Overall, we find that the student debt payment restart should have modest effects. We estimate that a relatively small portion (15 percent) of mortgage holders in our sample are also expected to restart student debt payments, and among those households, the median payment amount will be roughly 3 percent of take-home income. However, these seemingly small figures mask crucial nuances. Many households will need to reduce their other expenses in some way to make their restarted student debt payments without drawing on savings or incurring additional debt. It’s important to note that we would expect a natural decrease in discretionary spending to occur—independently of the payment restart—as households finish spending down the excess savings they accumulated in 2020 and 2021.4 Nevertheless, we project budget adjustments will be slightly larger for lower-income households, and these households may have more difficulty making these adjustments. And while the Biden administration has taken some steps to allow flexibility in how people resume payments, additional monitoring of households’ response to the end of the pause, as well as their financial security, is warranted.
Our analysis uses the bank transaction data of 455,000 deidentified households’ personal checking and savings accounts. Households are included in our sample if they meet two criteria. First, they must have held a Chase-serviced mortgage during the six months spanning February through July 2023. Second, they must have had a Chase checking account that meets minimum usage requirements to ensure that the household conducts most of its financial activity through these accounts.5 We calculate each household’s average monthly expenses and take-home income from the transactions in these accounts.6
We flag households as being involved in student debt repayment if they made student debt payments in at least five of the six months before the start of the pandemic (September 2019 through February 2020).7,8 We use the monthly average of the household’s student payments in these pre-pandemic months as their baseline student debt payment, and we assume that households will resume paying this amount once the payment pause ends. We calculate the projected additional amount households will need to pay after the resumption of student debt payments as the difference between this pre-pandemic baseline amount and the monthly average of payments the household made from February through July 2023.9
We use February through July 2023 to establish the steady state spending before the end of the payment pause for several reasons. Because our question of interest is how well households will fit the re-started payments into their month-to-month budget, we want to estimate households steady-state payment habits. As such, we do not want to include one-time, lump-sum payments on loans in our estimate of households’ routine monthly behavior, and work by other researchers found a surge in such payments beginning in August 2023.10 Similarly, we do not want to include debt payment data later in 2023 because of borrower confusion about when payments were due, inconsistency in servicer communication to borrowers, and the Biden administration’s decision not to report borrowers as delinquent on their payments for the first year after the payment restart. As a result, only 60 percent of borrowers with payments due in October had made those payments by mid-November (Kvall 2023).
To assess how much capacity household budgets will have for restarted student debt payments, we calculate the fraction of a household’s income was used for expenses before the pandemic and right before the restart of payments and present the results in Table 1. Of our sample of homeowners, 15 percent made regular student debt payments before the pandemic.
No student debt payments | Regular debt payments before pandemic | |||
| Pre-pandemic | End of pause | Pre-pandemic | End of pause | |
(Sept '19 - Feb '20) | (Feb - July '23) | (Sept '19 - Feb '20) | (Feb - July '23) | |
Fraction of take-home income left after | ||||
all expenses except student debt | 5.9% | 3.1% | ||
all expenses | 6.9% | 3.0% | 1.4% | 2.2% |
all expenses plus projected increase | -0.8% | |||
in student debt after end of pause | ||||
| Annualized take-home income | $83,637 | $106,052 | $111,479 | $142,723 |
Notes: “Pre-pandemic” period is September 2019 through February 2020. “End of pause” period is February 2023 through July 2023. “Regular student debt payments before pandemic” means that a household made student debt payments in at least 5 of the 6 months in the “pre-pandemic” period. All dollar values are nominal. Projected increase in student debt payments is the difference between average student debt payments made during the pre-pandemic sample period and average student debt payments made before the end of the payment pause. Sample of homeowners is Chase checking account customers who also held a Chase mortgage in the 6 months before payments resume and whose checking account activity meet minimum activity thresholds.
The first two rows of Table 1 describe what fraction of their income homeowners used to cover expenses right before the pandemic and right before the end of the payment pause. These expenses include all outflows from the household’s accounts except for account-to-account transfers, including mortgage and other debt payments, credit card payments, and debit card spending such as food, clothing, and transportation. In the six months before the pandemic, the median homeowner not making student debt payments had 6.9 percent of their take-home income remaining after all expenses. For homeowners who made regular student debt payments before the pandemic, the median was lower at 1.4 percent. When looking only at non–student debt expenses, student debt payers still use a higher share of their income on expenses, with only 5.9 percent of take-income left over.
Over the pandemic, both groups used more of their take-home income. The median non–student debt homeowner had 3 percent of their take-home income left after expenses in the six months ending July 2023 and the median student debt–homeowner had 3.1 percent of their income left after all non-student debt expenses. Some households continued to make student debt payments despite the payment pause: adding these payments decreases median income remaining to 2.2 percent, a difference of 0.9 percentage points.
We next consider the hypothetical scenario that households spent the same amount of money on student debt payments in 2023 as they did right before the pandemic. In this scenario, the median household would have a shortfall of 0.8 percent of take-home income assuming they made student payments at the same level as before the pandemic and did not alter any of their spending or other expenses. That is, they would have to spend 100.8 percent of their take-home income, a difference of 3.0 percentage points relative to actual expenses. This suggests that the median household will need to reallocate roughly 3 percent of their take-home income, either from spending or saving, to make their restarted student debt payments.
Households with a projected income shortfall will either need to use savings to cover their spending and full student debt payments or they will need to decrease their other consumption slightly to avoid drawing down savings. It is important to note that even without the restart in payments, we anticipate that households will likely decrease their spending during the period of the payment restart as households finish spending down the excess savings they accumulated in 2020 and 2021. As Wheat and Eckerd (2023a) show, households tend to maintain a target cash buffer on hand. When their cash buffer rises above this target, households increase their spending. By construction, for a household to spend down their savings, they must have expenses exceeding their income. As a household’s cash buffer approaches their target, they decrease their spending back to baseline levels and resume their usual saving rate. As Wheat, Deadman, and Sullivan (2024) show, households spent out of their excess savings (and transferred to other accounts) throughout 2023. And while many lower-income households have resumed their usual spending and saving patterns, higher-income households—which are disproportionately represented in our sample—are not done dissaving.
Finally, we consider how much households of different incomes will need to budget for their restarted payments. Figure 1 shows that the fraction of take-home income needed to cover restarted payments decreases with income, ranging from 4.6 percent for our lowest income quartile and decreasing to 2.2 percent for our highest income quartile. This is consistent with past Institute findings that student debt payment burdens (i.e., monthly payments divided by monthly income) are negatively correlated with income (Farrell, Greig, and Sullivan 2020).
Figure 1 : Lower-income mortgage holders will need to adjust their budgets more to account for restarted payments
We find that many households will need to reallocate a small part of their spending, the student debt payment restart should have modest effects on those homeowners who were previously making student debt payments. Most households’ incomes have grown faster than inflation while student debts are not adjusted for inflation. A $500 monthly payment in 2019 is now the equivalent of $419 after adjusting for inflation, and we project that the median student debt payment burden among homeowners will fall from 4.5 percent of take-home income to 3.9 percent. Moreover, as the vast majority of mortgage holders (85 percent in our sample) were not making student debt payments before the pandemic, the effect of the payment restart on mortgage holders in aggregate should be small.11
This optimistic conclusion should not overshadow the fact that some households will need to make potentially difficult budget adjustments. Homeowners are now using a larger share of their incomes for non–student debt expenses, and we project that the median homeowner will need to decrease those expenses by roughly 1 percent of their take-home income to maintain positive cash flow. To the extent that this observed increase in non–student debt spending is discretionary—for example, people spending down the excess cash buffers they accumulated in 2020 and 2021—this adjustment should be fairly easy. However, to the extent increased spending is driven by additional obligations, like car payments, the adjustment may be more difficult.
Two facets of the payment restart implementation may make these adjustments easier for households and mitigate any affect the adjustments might have on the macroeconomy. First, the Biden administration has said it will not report student debt borrowers delinquent to credit bureaus if they miss during the first year after the payment restart. Since interest on student debt does not compound, this makes the cost of missing payments effectively zero, which gives borrowers more time to adjust. Second, the income-driven repayment (IDR) program has been made significantly expanded, lowering the maximum amount take-home income households need to pay toward student debt payments. Previous Institute research found that under pre-pandemic IDR rules, the median IDR participant used only 2.7 percent of their take-home income on student debts versus 4-5 percent in the wider population.12 However, that research also found IDR enrollment to be very low—roughly one-third of eligible borrowers.
Because of these needed spending adjustments, and the potentially limited take-up of the above mitigating administrative measures, additional monitoring of households’ response to the end of the pause is warranted.
Autor, David, Arindrajit Dube, and Annie McGrew. 2023. “The Unexpected Compression: Competition at Work in the Low Wage Labor Market.” NBER Working Paper No. 31010.
https://www.nber.org/system/files/working-papers/w31010/w31010.pdf
Farrell, Diana, Fiona Greig, and Daniel M. Sullivan. 2020. "Student Loan Debt: Who is Paying it Down?" JPMorgan Chase Institute. https://www.jpmorganchase.com/institute/all-topics/financial-health-wealth-creation/student-loan-debt.
Greig, Fiona, Daniel M. Sullivan, and Bernard Ho. 2022. “Income Driven Repayment: Who needs student loan payment relief?” JPMorgan Chase Institute. https://www.jpmorganchase.com/institute/all-topics/financial-health-wealth-creation/student-loan-income-driven-repayment
Kvall, James. 2023. “A First Look at Student Loan Repayment After the Payment Pause.” Homeroom: The official blog of the U.S. Department of Education. United States Department of Education. December 15. https://blog.ed.gov/2023/12/a-first-look-at-student-loan-repayment-after-the-payment-pause/
Wheat, Chris, Erica Deadman, Daniel M. Sullivan. 2024. “Household Pulse: Balances through October 2023.” JPMorgan Chase Institute. https://www.jpmorganchase.com/institute/all-topics/financial-health-wealth-creation/household-pulse-cash-balances-through-october-2023
Wheat, Chris, and George Eckerd. 2023a. “Household Cash Buffer Management from the Great Recession through COVID-19.” JPMorgan Chase Institute. https://www.jpmorganchase.com/institute/all-topics/financial-health-wealth-creation/household-cash-buffer-management-from-the-great-recession-through-covid-19
Wheat, Chris, and George Eckerd. 2023b. “The Purchasing Power of Household Incomes: Worker outcomes through August 2023 by income and race.” JPMorgan Chase Institute. https://www.jpmorganchase.com/institute/all-topics/financial-health-wealth-creation/purchasing-power-of-household-incomes-august-2023
See, for example, Autor, Dube, and McGrew (2023) and Wheat and Eckerd (2023b).
Wheat and Eckerd (2023a) discuss how households tend to keep a target amount of cash savings on hand, and when they have savings in excess of this target, they will spend down excess savings until they reach their target. Wheat, Deadman, and Sullivan (2024) documents that higher-income households continue to dissave out of their excess cash reserves while lower-income households may have returned to saving behavior similar to pre-pandemic trends.
To be included in our sample, a household must meet the following minimum usage criteria: have at least one checking account with five transactions in every month between September 2019 and July 2023; $12,000 annualized income in each of the periods September 2019 through February 2020 (our pre-pandemic period) and February 2023 through July 2023 (our end of payment pause period); households must use at least 10 percent of their income for account outflows that are not account-to-account transfers.
Monthly expenses are calculated as the sum of all account outflows except for account-to-account transfers, such as transfers between checking and savings accounts, transfers to checking accounts at other banks, and transfers to investment and brokerage accounts. Income is similarly calculated as all account inflows excluding account-to-account transfers. This includes payroll income, cash and check deposits, peer-to-peer app-based payments, child support payments, unemployment insurance, social security payments, and other non-transfer deposits.
Note that we cannot determine whether the household is paying down its own debt or the debt of others. Findings in Farrell, Greig, and Sullivan (2020) suggest that a significant portion of these households do not hold any student debt and are, for example, parents making payments on their adult children’s debt.
Households who made between one and four months of payments were excluded from the analysis.
For example, suppose that a household had an average monthly student debt payment of $500 before the pandemic. If their average monthly student debt payment in February through July 2023 was $100, then we project that their required increase in student debt payments will be $400.
There are likely homeowners who were not making payments before the pandemic who will start making payments for the first time once the payment pause ends, increasing the share of homeowners affected by the payment restarted. However, there are also many pre-pandemic borrowers who have paid off their loans during the pandemic, decreasing the overall share affected by the payment restart.
We thank our research team, specifically Guillaume Kasten-Sportes, Khushboo Chougule, and Edward Biggs, for their hard work and contribution to this research. Additionally, we thank Kaitlin Finnerty, Annabel Jouard, Oscar Cruz and Alfonso Zenteno for their support. We are indebted to our internal partners and colleagues, who support delivery of our agenda in a myriad of ways, and we acknowledge their contributions to each and all releases.
We are also grateful for the invaluable constructive feedback we received from external experts and partners. We are deeply grateful for their generosity of time, insight, and support.
We would like to acknowledge Jamie Dimon, CEO of JPMorgan Chase & Co., for his vision and leadership in establishing the Institute and enabling the ongoing research agenda. We remain deeply grateful to Peter Scher, Vice Chairman, Tim Berry, Head of Corporate Responsibility, Heather Higginbottom, Head of Research, Policy & Insights, and others across the firm for the resources and support to pioneer a new approach to contribute to global economic analysis and insight.
This material is a product of JPMorgan Chase Institute and is provided to you solely for general information purposes. Unless otherwise specifically stated, any views or opinions expressed herein are solely those of the authors listed and may differ from the views and opinions expressed by J.P. Morgan Securities LLC (JPMS) Research Department or other departments or divisions of JPMorgan Chase & Co. or its affiliates. This material is not a product of the Research Department of JPMS. Information has been obtained from sources believed to be reliable, but JPMorgan Chase & Co. or its affiliates and/or subsidiaries (collectively J.P. Morgan) do not warrant its completeness or accuracy. Opinions and estimates constitute our judgment as of the date of this material and are subject to change without notice. No representation or warranty should be made with regard to any computations, graphs, tables, diagrams or commentary in this material, which is provided for illustration/reference purposes only. The data relied on for this report are based on past transactions and may not be indicative of future results. J.P. Morgan assumes no duty to update any information in this material in the event that such information changes. The opinion herein should not be construed as an individual recommendation for any particular client and is not intended as advice or recommendations of particular securities, financial instruments, or strategies for a particular client. This material does not constitute a solicitation or offer in any jurisdiction where such a solicitation is unlawful.
Wheat, Chris, Daniel M. Sullivan, Makada Henry-Nickie. 2024. “Balancing restarted student loan payments and a mortgage: How will household budgets adapt?” JPMorgan Chase Institute. https://www.jpmorganchase.com/institute/all-topics/community-development/balancing-restarted-student-loan-payments-and-a-mortgage-how-will-household-budgets-adapt

Chris Wheat
President, JPMorganChase Institute
Daniel M. Sullivan
Consumer Research Director, JPMorganChase Institute

Makada Henry-Nickie
Housing Finance Research Director, JPMorganChase Institute