

Figure 1: For every person on IDR, there are roughly two people who could be in IDR
Latest news

An Ohio-based company is protecting first responders around the world
With support from JPMorganChase, Fire-Dex is providing protective equipment to firefighters in 100 countries and all 50 states.
Learn moreLatest news

Veteran’s Unconventional Path to Landing her Dream Job in Tech
U.S. Army Veteran Ashley Wigfall transitioned to a civilian role and charted her path to technologist through mentorship and skills training at the JPMorgan Chase tech hub in Plano, Texas.
Learn more
In March 2020, the federal government paused payments on all $1.5 trillion of federal student loans then outstanding in order to provide financial relief to borrowers during the COVID-19 pandemic.1 Federal student loans now total $1.6 trillion spread across 43 million borrowers. With the prospect of student loan forbearance ending and payments on this debt resuming, policymakers and student debt groups have put forward various proposals to further help struggling borrowers. These proposals have included efforts to reduce payment burdens for existing borrowers through outright forgiveness of debt2 or changes to programs such as income driven repayment (IDR).3 Other reforms aim to make higher education more affordable and thus limit future borrowing4 The ultimate goal of these proposals is to alleviate the financial burden of student debt: monthly payments for some borrowers can constitute a large portion of take-home income and carrying such large debts can be an obstacle to greater financial health, (see, e.g., Farrell, Greig, and Sullivan 2020).
IDR is a collection of repayment relief plans available to certain borrowers to lower their monthly payment and potentially provide loan forgiveness. Under IDR, monthly payments are capped based on the borrower’s income, and if the borrower completes a certain number of IDR payments, any remaining loan balance is forgiven. While conceptually straightforward, the IDR programs have been criticized for a number of reasons, most of which argue that these programs do not provide sufficient relief to struggling borrowers.5
Expanding relief through IDR could take many forms. It could be as simple as getting more currently eligible borrowers enrolled by reducing paperwork burdens, increasing awareness of the program, or even automatically enrolling all borrowers in IDR. Policymakers could also change the underlying parameters of IDR to lower monthly payments, decrease the amount of time borrowers spend in repayment, and increase the number of borrowers who are eligible for IDR.
However, there is a lack of information about borrowers who are currently eligible for IDR but not enrolled—their payment levels, their incomes, their wider financial situation—and this information is necessary to design relief programs and predict their effects. Specifically, how many are not enrolled because of obstacles to enrollment versus choosing not to enroll? How do their finances differ from other borrowers? Data on these borrowers is limited, especially data on borrowers’ current incomes, which is a primary criterion for IDR eligibility. Without this data it is impossible to know how many people might be eligible for current IDR programs or how many people might be eligible for expanded or revised IDR programs.
In this paper, we use administrative banking and credit bureau data to shed light on this group of borrowers. These data cover 117,000 borrowers and include measures of income, monthly scheduled payments, and actual payments made and thus provide a uniquely detailed window into the finances of student debt borrowers. Our finding are as follows:
These findings have several implications for the design of policies to relieve student debt. First and foremost, the IDR programs are complex and can have counterintuitive effects on borrowers’ finances. Lowering monthly payments extends the amount of time borrowers spend in repayment and carry the debt on their credit report, potentially increasing the amount of interest they pay as well as increasing the cost of other debt. For some borrowers this is a worthwhile tradeoff, and for others it is not.
In our data, we see many borrowers eligible for IDR but not enrolled who could see substantial monthly savings. This suggests that making IDR participation easier by, for example, reducing initial and recurring paperwork, could be highly beneficial. Nevertheless, the net benefits available for many other IDR-eligible borrowers are less obvious and avoiding IDR may be best for these borrowers’ finances.
Together, this implies that any move to automatically enroll borrowers in an IDR program should be accompanied by information about the tradeoffs of lower monthly payments and other aids to help borrowers.
Income Driven Repayment (IDR) is a collection of programs offered by the Department of Education that allow borrowers to lower their monthly student debt payments when they have a high student debt–to–income ratio and potentially receive a forgiveness of debt after making a certain number of full and on-time monthly payments under the IDR program.
Each IDR program is a variation on a common template: Rather than paying along a standard 10-year amortization schedule, a new monthly payment is calculated based on the borrower’s income. Specifically, the new payment is calculated as a fraction of their discretionary income, usually 10 percent.6 Discretionary income here is the borrower’s adjusted gross income from their tax return minus the 150 percent of the federal poverty guideline.7
If the IDR amount is lower than their current payment, the borrower makes payments at this lower amount for one year. Each year, borrowers must recertify their eligibility and income, and their payment amount is re-calculated. This annual process continues until the borrower pays off their debt or makes the maximum number of payments required under IDR to receive forgiveness, 8 typically after 20 years for undergraduate debt.9 Once the borrower makes the required number of payments under IDR, the remaining balance on their loan is forgiven.
This means that IDR provides relief in two different ways: lower payments now and forgiveness in the future. But to receive forgiveness, the borrower must participate in IDR for 20 years, even if their monthly payment amount is $0. Furthermore, people on IDR may end up paying a considerable amount of money toward their debt, even if their monthly payments only just cover their monthly interest. Ultimately, whether IDR benefits any individual borrower depends on that borrower’s financial situation, their personal preferences for carrying debt, and their financial plans for the future.
Determining how borrowers not currently enrolled in IDR might or might not benefit from enrollment in IDR requires rich data on borrower balances and incomes, which the JPMC Institute is uniquely positioned to provide.
A large portion of borrowers eligible for IDR are not enrolled, and these un-enrolled borrowers have significantly lower incomes than other borrowers.
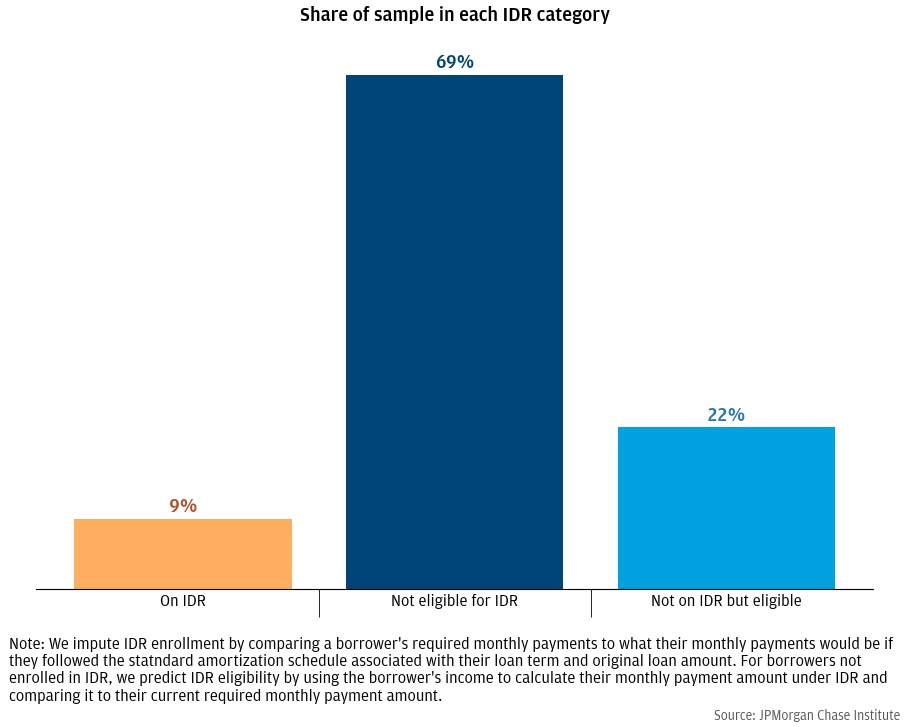
How many people are not enrolled in IDR programs but could be? Figure 1 shows that 9 percent of our sample are on IDR. The other 91 percent are not enrolled in IDR, including 69 percent of borrowers who are not eligible for IDR given their loan balance and income levels, and 22 percent of borrowers who would be eligible for IDR but are not enrolled. This suggests that for every borrower on IDR there are potentially two more who are eligible but not enrolled.
Figure 1: For every person on IDR, there are roughly two people who could be in IDR
Recall that borrowers are eligible for IDR by having low income relative to their opening balance—the original amount of debt the borrower took on. Figure 2 shows the distribution of opening balances for each of our three groups. While IDR borrowers have slightly higher opening balances, the distributions for all three groups are comparable. If original loan amounts for each group are similar, that suggests that differences in IDR eligibility must be driven by differences in income. When we look at the distribution of income within each group, we find that is the case.
Figure 2: Borrowers eligible for IDR but not enrolled have similar balances to non-eligible borrowers
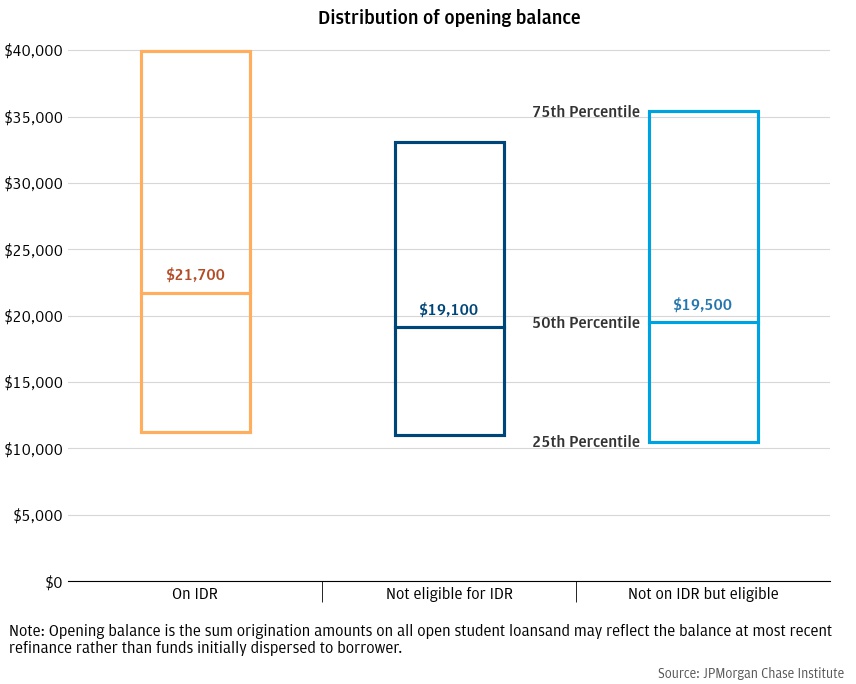
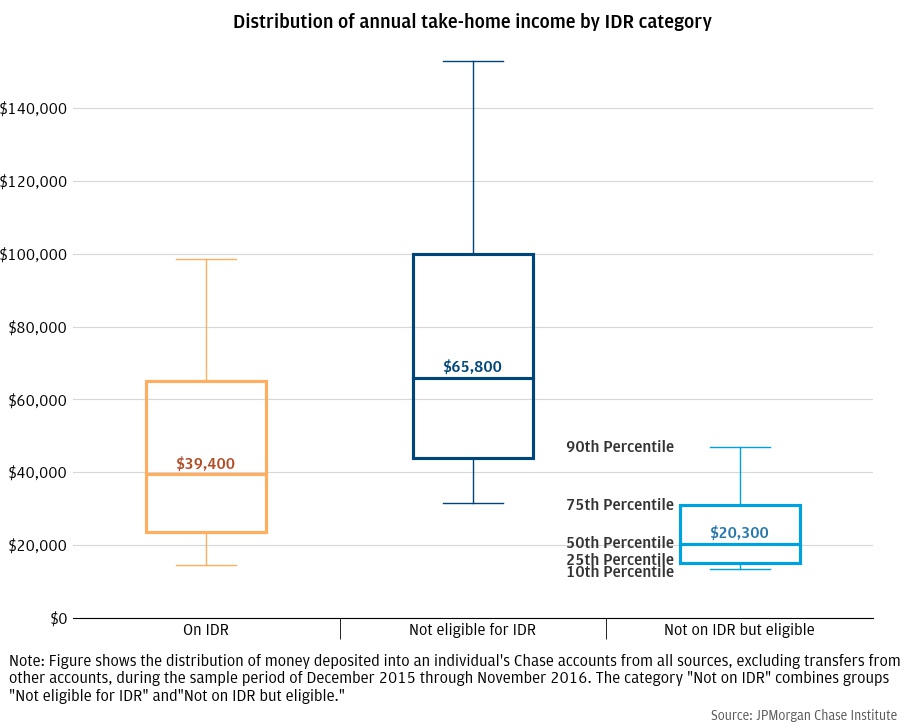
Figure 3 shows the distribution of income within each of our groups. Given their similar balances, borrowers enrolled in IDR tend to have lower incomes than those not eligible for IDR. This mechanically must be true given the eligibility criteria for IDR. However, borrowers eligible for IDR but not enrolled have dramatically lower incomes even compared to current IDR participants. Part of this is mechanical—for a fixed amount of debt, lower income borrowers are more likely to be eligible—but original balances among IDR enrollees are only slightly higher balances of those not enrolled. This suggests that IDR enrollment rates are higher among high-income borrowers.
Figure 3: Borrowers eligible for IDR have significantly lower incomes
This combination—equally large balances but much lower incomes—raises the questions of why these borrowers are not enrolled and why low-income borrowers are disproportionately less likely to enroll. One possibility is that the IDR process is difficult to navigate or too costly relative to the perceived gain for these unenrolled borrowers (see, e.g., Pew 2022). Or perhaps these borrowers may be wary of reducing their payments and potentially accruing back interest today for a promised forgiveness 20 years in the future that may not materialize. Or these borrowers may simply want to clear their debt as fast as possible since carrying student debt increases the cost of other credit, especially mortgages.
To shed light on these questions, we now examine how burdensome student debt payments are to borrowers in each group and how well borrowers are managing that burden.
Borrowers eligible for IDR but not enrolled appear to be keeping up with their student loan payments but use a large portion of their income to do so. Enrolling in IDR could decrease their short-term payment burden substantially.
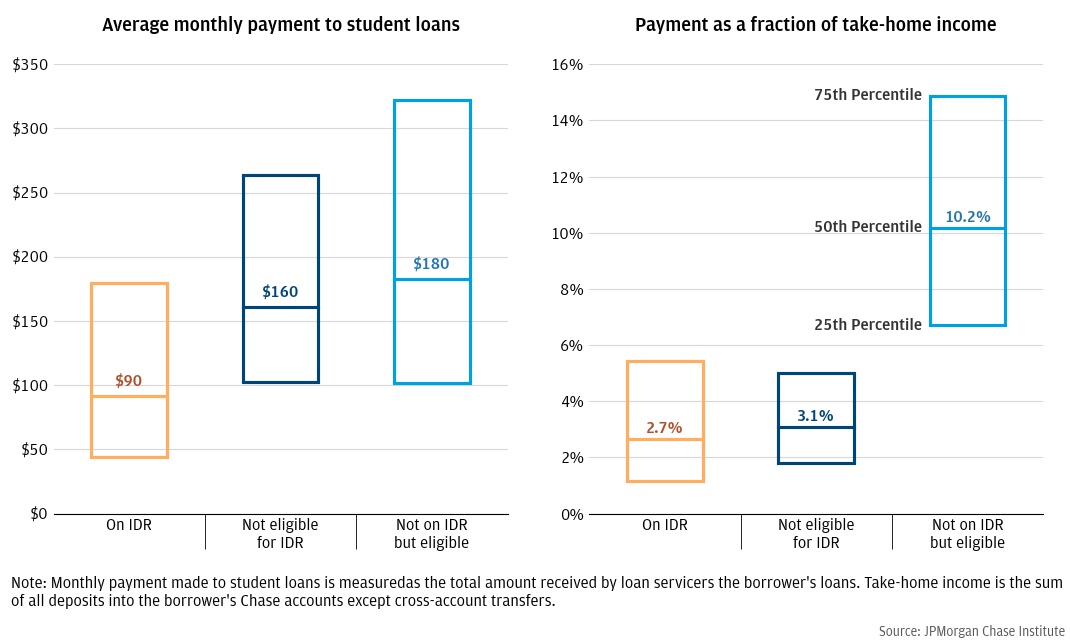
Figure 4 shows the distribution of payment amounts for each group in dollars and as a fraction of the borrower’s income. Equal starting balances and equal loan terms should result in equal monthly payments, and that is what we see when comparing the monthly payments of borrowers who are not eligible for IDR with those who are eligible but not enrolled (left panel). The median monthly payment for non-eligible borrowers is $160 while the median eligible-but-not-enrolled payment is $180. At the same time, IDR borrowers naturally have much lower payments (median of $90) because IDR mechanically lowers monthly payments. For comparison, CFPB (2019) reports an average IDR monthly payment of $97; Delisle et al. (2022) reports a range of similar estimates.
When comparing payments as a fraction of income, IDR borrowers and ineligible borrowers pay roughly the same amount (2.7% versus 3.0%), despite the lower incomes of IDR borrowers. This can be interpreted as IDR equalizing the financial burden (payment as a percentage of income) across low-income enrollees and higher-income non-eligible borrowers.
At the same time, borrowers eligible for IDR but not enrolled pay much larger portions of their take-home income. Half of them spend more than 10 percent of their take-home pay on student debt payments, and a quarter pay roughly 15 percent or more. Note that while these are very high payment burdens, they should not be surprising since IDR eligibility hinges on whether your student debt payments are more than 10 percent of your discretionary income; anyone whose payments are a small fraction of their income are ineligible for IDR.12
Figure 4: Borrowers on IDR pay a similar amount of their income towards debt as higher-income borrowers not eligible for IDR
How well are eligible but not enrolled borrowers able to keep up with these large payment burdens? Figure 5 shows the fraction of borrowers in each group who made all their payments during our sample year.13 The fraction of borrowers keeping up with their payments is approximately equal across all three groups. Most notably, all borrowers not enrolled in IDR, eligible or not, have similar proportions keeping up with their payments (86 percent versus 82 percent), despite the much higher payment burdens among those eligible for IDR.
Figure 5: Borrowers eligible for IDR but not enrolled are keeping up with their payments despite their lower incomes
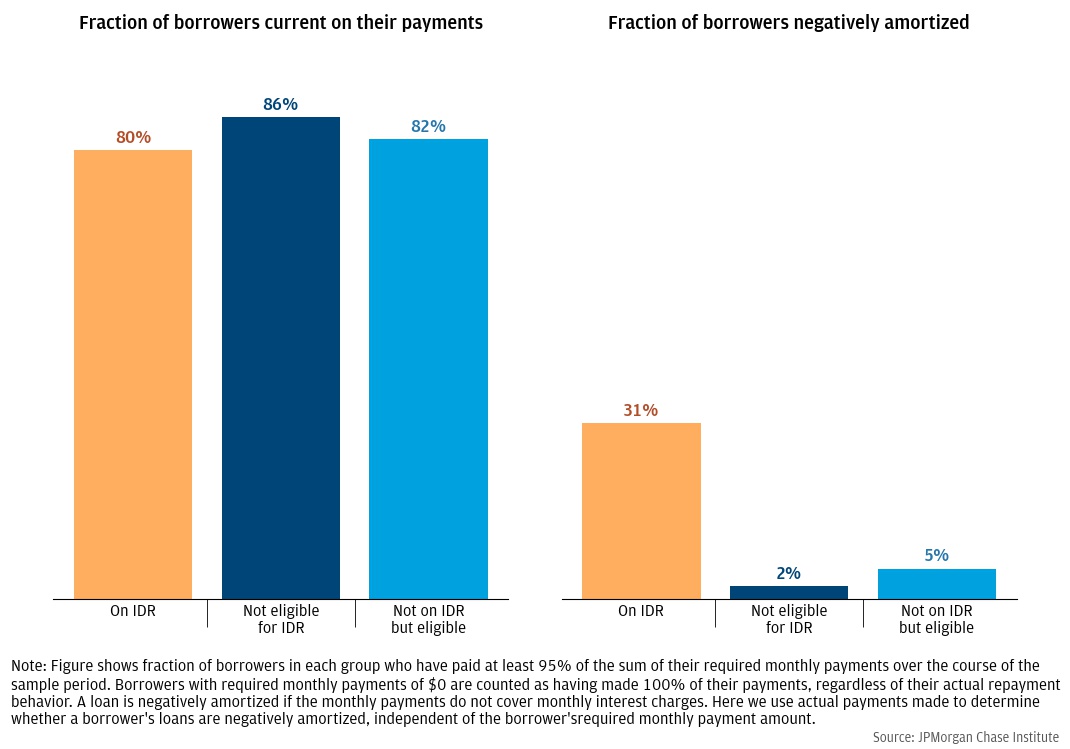
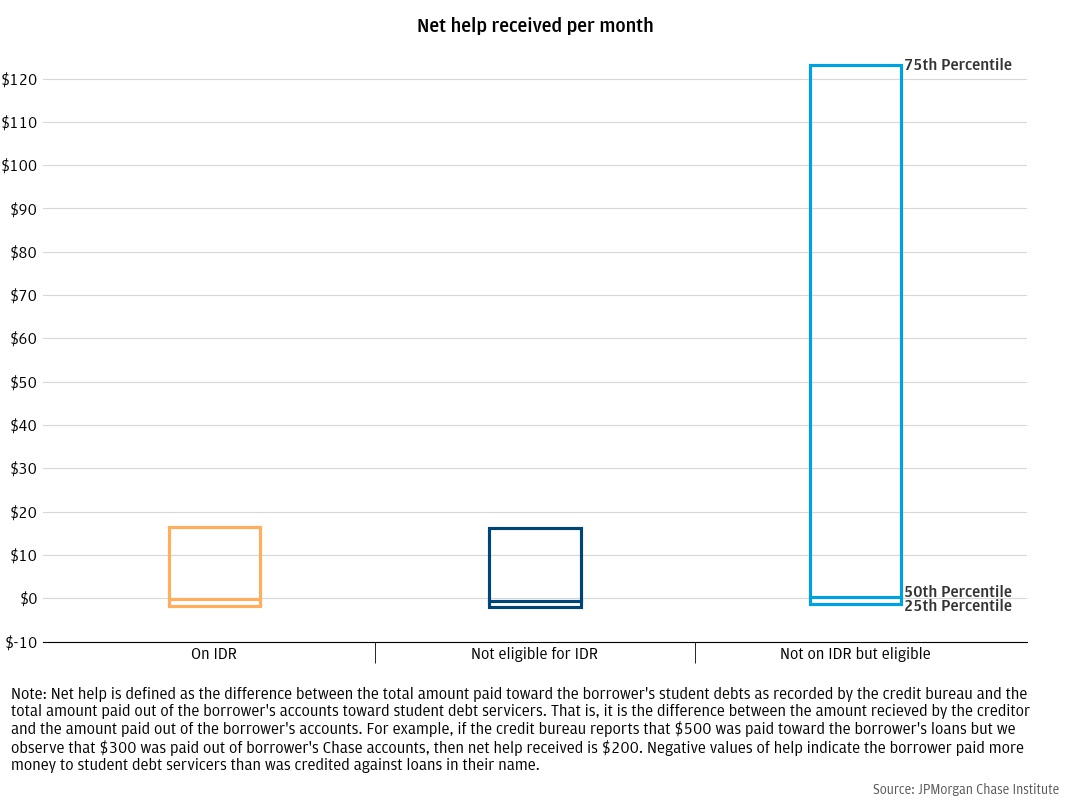
How are these borrowers able to keep current on their payments despite those payments being 10 or even 15 percent of their take-home income? It is possible that these lower-income borrowers sacrifice saving or other spending to keep up with their payments. It is also possible that they are keeping up with payments because they receive financial help from family, friends, and others, as discussed by Farrell, Greig, and Sullivan (2020). While spending behavior is beyond the scope of this report, we explore the extent of financial help received by each group in Figure 6.14
Figure 6 shows the distribution of net financial help received on student debt payments within each group.15 Median help received by eligible but not enrolled is only a few dollars a month, but the 75th percentile of net help is just under $125 per month. This means that for a substantial fraction of these borrowers, much of their payments every month are made by someone else (recall from Figure 4 that the median monthly payment for these borrowers is $180). This suggests that many borrowers who are eligible for IDR are reliant on others, likely family members, to keep up with payments.16
Figure 6: Borrowers eligible for IDR but not enrolled are much more likely to receive financial help to make payments
These borrowers’ reliance on help rather than IDR may be a conscious choice: By leveraging familial resources, they can clear their debt faster which may better serve their long-term financial plans. Alternatively, family assistance could be a strategy to manage the high repayment burden: in the absence of payment relief, a borrower’s only options may be to rely on family for help or to default on the debt. IDR eligible borrowers not receiving significant help, who are the bulk of this group, face similar tradeoffs. This again raises the question of why these borrowers have not enrolled in IDR, whether they have made an affirmative decision to avoid IDR or face administrative barriers to enrollment. We explore this further estimating the amount of payment relief and debt forgiveness unenrolled borrowers might receive from IDR.
Of borrowers eligible for IDR but not enrolled, most would receive debt forgiveness under IDR. But those with relatively higher incomes receive no forgiveness and IDR is equivalent to a loan extension, lowering their monthly payments but increasing the total cost of their debt.
While it is unclear why borrowers who are eligible for IDR do not enroll, it is likely a combination of factors. Anecdotal evidence suggests that borrowers may be overwhelmed with the complexity of IDR plans. Experimental evidence suggests that plan selection itself is costly and borrowers may also over-estimate their earnings trajectory and thus under-estimate how useful IDR may be (Cox, Kreisman, and Dynarski 2020). That is, many borrowers are making a conscious choice not to enroll in IDR.
In this section, we explore the financial tradeoffs IDR eligible borrowers face when choosing to enroll.
Figure 7 shows hypothetical payment relief that eligible IDR borrowers would receive if they were to enroll. The median value is shown for each quintile of take-home income within the eligible for IDR group. The median relief among the lowest earners is roughly $102 per month, or 9 percent of take-home income. Among the highest earners, monthly relief is slightly higher ($152), but this constitutes a much smaller share of their take-home income (3.5 percent).
Figure 7: Payment relief from IDR could be substantial for those who are not enrolled
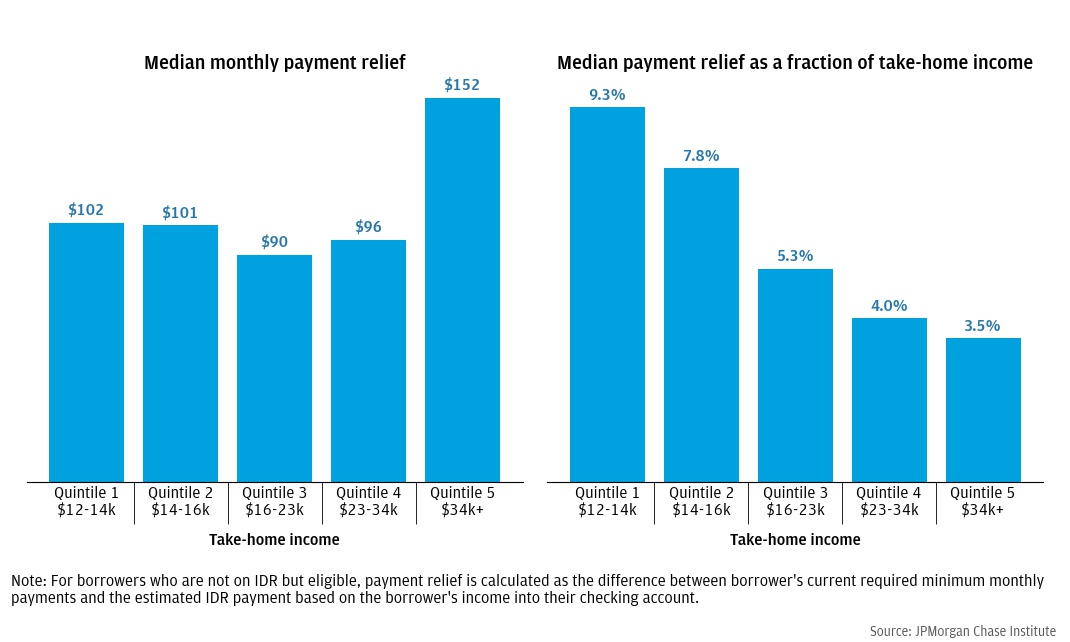
This potential payment relief is substantial, especially for the lowest income borrowers, and might provide an incentive to enroll in IDR. However, lowering monthly payments today comes with tradeoffs in the future in that the borrower will have to carry their debt significantly longer and potentially pay more in interest.
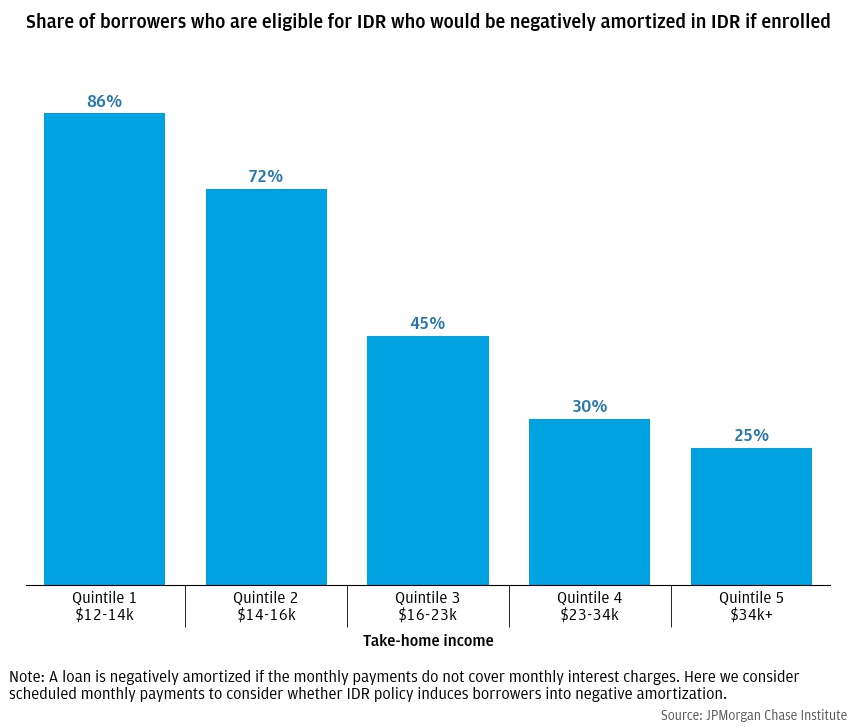
An extreme case of this is when a borrower’s IDR payment is less than their monthly interest charges and the debt becomes negatively amortized, meaning their balance would grow over time. While IDR enrollees are promised forgiveness of any remaining debt after 20 years, increasing balances may still worry borrowers for several reasons. First, reports of IDR mismangement and bureaucracy may undermine borrower’s faith that they will actually receive forgiveness.17 Having a negatively amortizing debt also means that the borrower will have to carry an increasingly large debt on their credit report for 20 years, making other credit products like mortgages and car loans more difficult get and more expensive. In addition, if a borrower believes they will get a higher paying job in the future that would increase their IDR payment, they may have to pay back much of that accumulated interest.
Figure 8 shows how many borrowers in each income group would be negatively amortized if they were to enroll in IDR. A large majority of the lowest income borrowers would be negatively amortized, which is unsurprsing given many of them are below the cutoff for a $0 monthly payment. However, non-trivial shares of borrowers in all income groups would also be negatively amortized, including roughly a quarter of families earning more than $34,000 per year.
Figure 8: Share of potential IDR enrollees whose monthly IDR payments are less than their monthly interest charge
Another potential cost of IDR enrollment is it will cause the borrower to pay more in interest by extending the life of the loan. This is especially true for people whose payment relief is more modest and who will pay off their loan in less than 20 years and thus receive no debt forgiveness. These borrowers will end up paying more interest on their loan compared to a standard repayment plan of 10 years.
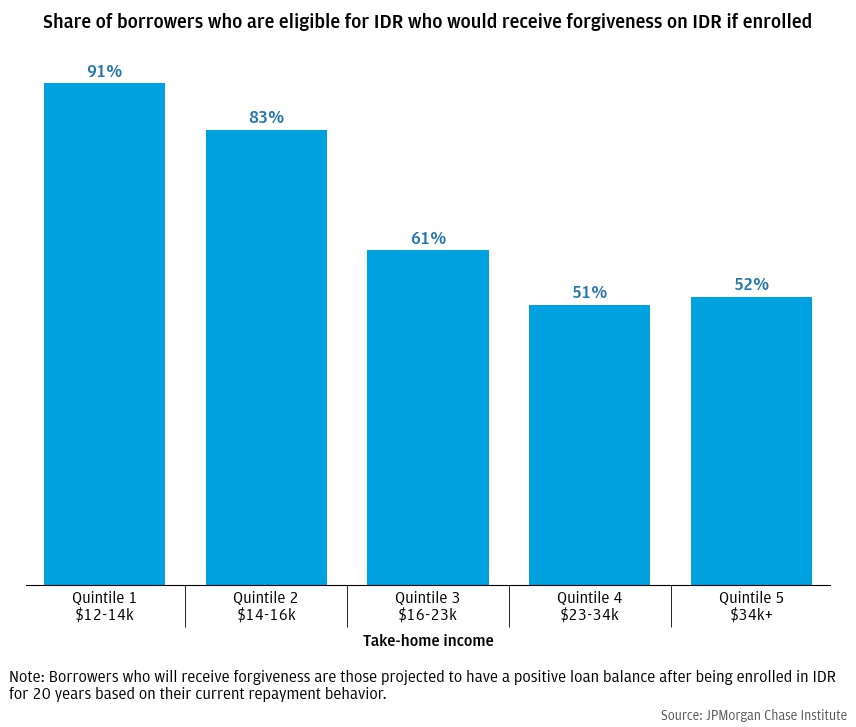
Figure 9 shows the share of borrowers who would receive forgiveness under IDR if they were to enroll and follow their IDR payment schedule. While the share of low-income borrowers who are on track to receive forgiveness is high—91 percent of the lowest quintile and 83 percent of the second lowest—borrowers with take-home income above $23,000 are as likely to receive forgiveness as not (51 and 52 percent for the highest quintiles). This is a relatively low level of income, even for IDR enrollees; more 75 percent of current IDR enrollees in our sample make more than $23,000. Nevertheless, payment relief is not generous enough to result in forgiveness of debt for these borrowers, likely because they have a relatively small amount debt. This may explain some of the hesitance to enroll in IDR: many borrowers face a combination of debt balances and income-driven payment amounts that make IDR relatively unappealing.
Figure 9: Half of IDR eligible borrowers with more than $23,000 in take-home income are unlikely to receive forgiveness through IDR
In summary, borrowers who are eligible for but not on IDR could receive payment relief of roughly $100 per month, freeing up more than 5 percent of their take-home income. Because their payments would be so low, most of the borrowers’ loans would be negatively amortized and they would receive loan forgiveness so long as they remained on IDR and in good standing. This should be an attractive tradeoff for many low-income borrowers, which raises the question of why they do not enroll. Possible reasons include (1) personal preference against debt—they would prefer to spend less now to pay down their debt more quickly; (2) they have other financial goals such as purchasing a home, and keeping student loan debt on their credit bureau record makes it hard or more expensive to obtain a mortgage; and (3) they would like payment relief but face administrative barriers to enrolling.
Changes to IDR may dramatically expand eligibility and reduce total out of pocket cost to current IDR enrollees.
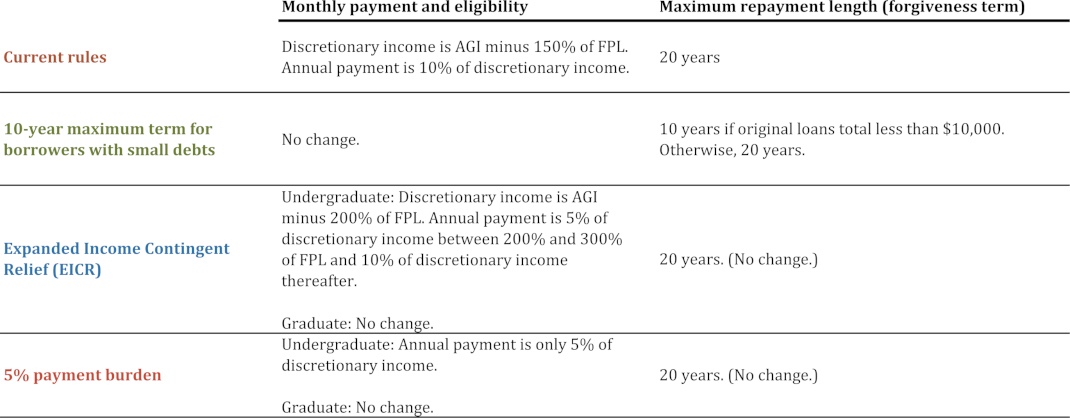
In this section, we consider a few hypothetical changes that could be made to IDR rules and how those changes might affect current and potential IDR borrowers. We consider three hypothetical changes to IDR which are summarized in Table 1:
Table 1: Summary of possible IDR rule changes
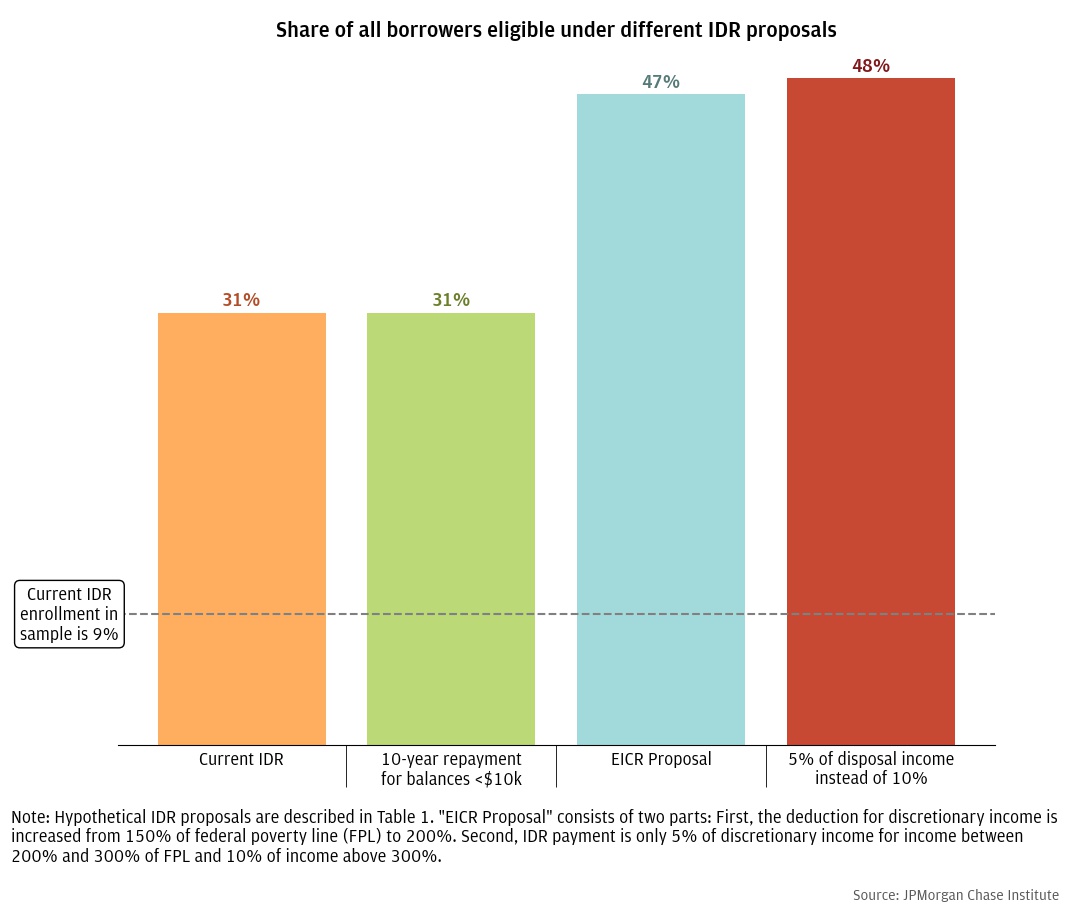
In examining the effects of these hypothetical changes, we first calculate how many more borrowers would become eligible since making monthly IDR payments lower also makes more borrowers eligible for IDR.
Figure 10 shows total eligibility under each hypothetical, including those in our sample flagged as already enrolled in IDR. Under current IDR rules, 31 percent of our sample is eligible.19 Our first hypothetical, which decreases the time required to receive forgiveness, does not decrease monthly payment amounts and so does not increase eligibility relative to current IDR rules. Under our other hypotheticals, monthly payments go down and as a result overall eligibility increases from 31 percent of our sample to 47-48 percent.
Figure 10: Making IDR more generous for current enrollees can also make more borrowers eligible
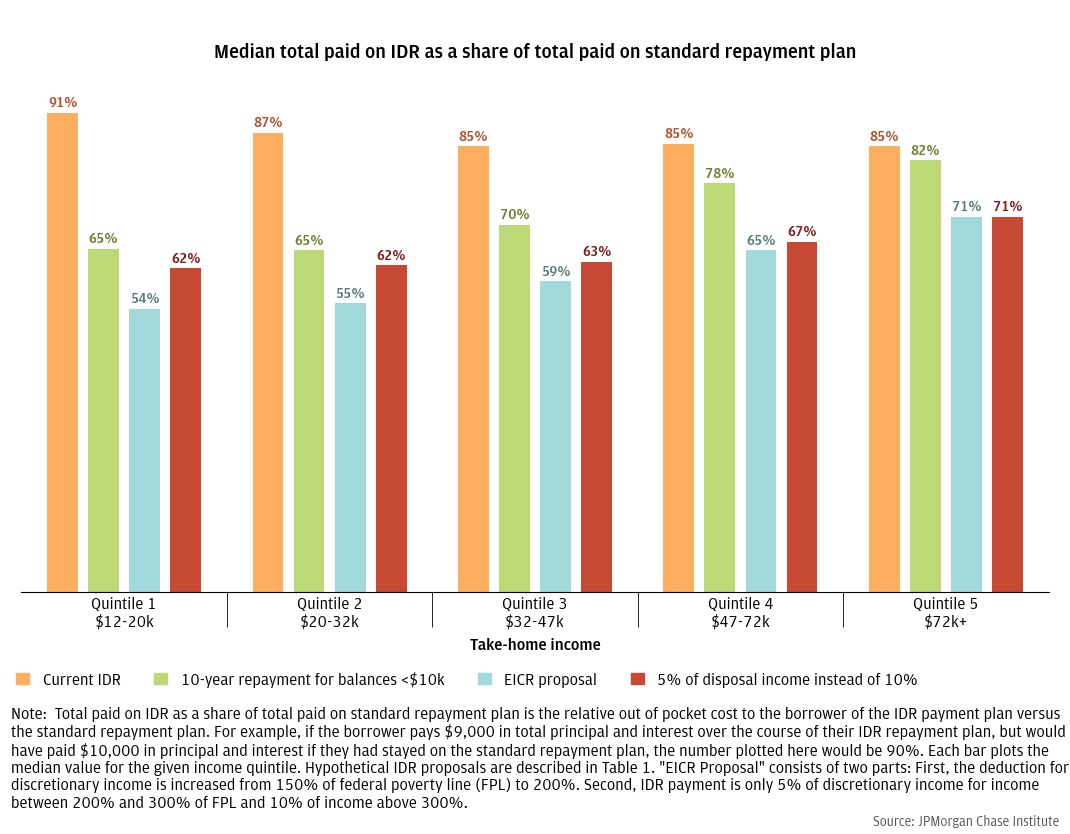
In addition to increased eligibility, lower monthly payments may also decrease the total amount of money people repay over the life of their loan. Recall that lowering monthly payments also extends the amount of time a person will take to repay their loan. Any IDR borrower who is on track to pay off their balance before they hit 20 years will likely pay more over the life of the loan. We consider both these opposing forces at the same time (lower monthly payments but longer payoff horizon) by looking at total out of pocket cost of the loan—the sum of all principal and interest payments—made by the borrower.20 Specifically, we compare the total cost of the loan under each set of IDR rules to the total cost of following the standard repayment schedule. For example, a relative cost of 100 percent means the borrower paid exactly as much principal and interest as they would have had they not enrolled in IDR. Note that we do not distinguish between principal and interest payments because many IDR enrollees receive forgiveness and so whether a payment was all interest is irrelevant to the calculation of total out of pocket costs. Because we only observe one year’s worth of payments, we estimate how much each borrower paid before our sample period and assume that they will continue making their current IDR payments until their loan is paid off or make 20 years of IDR payments.21
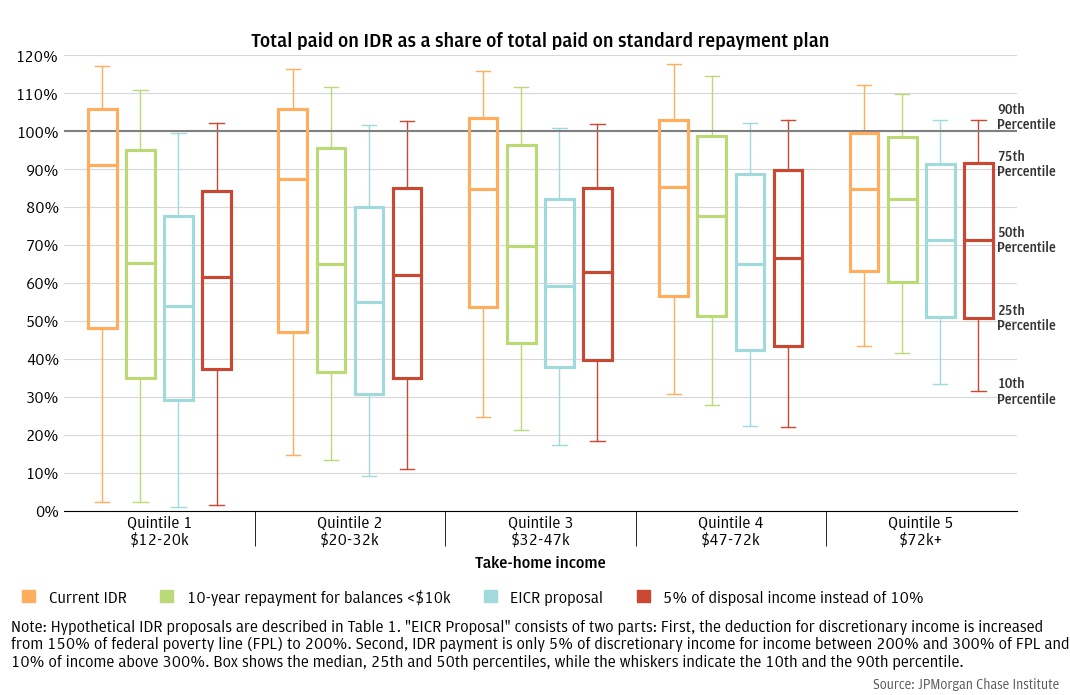
Figure 11 shows the median relative cost of each IDR program described in Table 1 for each income quintile of our IDR sample. The first item of interest in Figure 11 is that median relative cost of the loan under IDR versus the standard 10-year repayment plan is roughly the same across all income quintiles, hovering between 88 and 95 percent. That is, the typical borrower on an IDR program will pay roughly 88-95 percent of what they would have paid had they remained on the standard 10-year repayment program. However, a large portion of low-income borrowers pays relatively little under IDR and these medians mask significant variation in the distribution of total costs; see appendix Figure C. Notably, 31 percent of borrowers on IDR will pay more on IDR than they would under the standard 10-year repayment schedule. These higher costs of loan repayment under IDR are potentially somewhat surprising. First, it should be remembered that borrowers can make significant payments before enrolling in IDR. Thus, even borrowers with an IDR payment of $0 may not have a relative cost of 0 percent.
Decreasing the payoff window to 10 years for borrowers with low initial debts decreases total loan costs considerably for lower income borrowers, but only slightly for higher income borrowers. This is likely because high-income borrowers tend to have much higher debts (Farrell, Greig, and Sullivan 2020) and so are much less likely to qualify for the decreased payoff window. For these borrowers, the terms of IDR program are unchanged.
Lowering the monthly payment amounts (the hypotheticals shown in blue and red) have similar effects for low-income borrowers of lowering total loan cost substantially. But under these hypothetical policies, high-income borrowers also see a substantial decrease. This is because these programs affect all borrowers, regardless of income or balance. Based on the equations underlying EICR, borrowers with incomes above 300 percent of the federal threshold see a payment reduction of approximately $107 per month, assuming a household size of one. Under the 5 percent hypothetical, all borrowers see their monthly payments cut in half. However, the restriction of these more generous changes to undergraduate debt does prevent them from being more regressive, since graduate borrowers are more likely to have higher incomes.
Figure 11: Reducing monthly payments reduces out of pocket costs for all income groups
Implications
Our results suggest that IDR may be significantly under-subscribed. A number of measures have been proposed that would likely be very effective in boosting enrollment, such as making IDR the default repayment scheme, which lab experiments show could boost enrollment significantly (Cox, Kreisman, and Dynarski 2020). This is in line with other research in behavioral economics that finds choice architecture, especially default selections like automatic 401(k) enrollment, is very influential on the choices consumers make and on their financial welfare (see., e.g., Blumenstock, Callen, Ghani 2018). But framing of the default choice can also have significant effects on consumer welfare, often in counter-intuitive ways (Bernheim, Fradkin, and Popov 2015). We find that IDR is much more beneficial for some borrowers relative to others, and this nuance may inform how enrollment boosting policies are structured.
Enrolling in IDR can immediately provide relief through lower payments and possible forgiveness in the future, but it also has costs, both direct (additional interest payments) and indirect (higher cost of other credit by carrying student debt over a longer period). Among current IDR enrollees, 31% will end up paying more under IDR than under a 10-year plan and lower-income borrowers are more likely to pay more under IDR relative to the standard plan.22 Among borrowers eligible for IDR but not enrolled, we find that almost all of those with less than $16,000 in take-home income will receive some amount of forgiveness at the end of their IDR term. But only half of those with more than $23,000 will receive any forgiveness, meaning they will pay more in interest relative to a standard 10-year plan.23 Field data also suggest that students are heavily swayed by the default choice, but many avoid IDR when IDR’s costs are brought to their attention (Abraham et al. 2020). These facts should be considered when weighing the decision of what the default payment plan should be.
A potentially lower risk strategy for increasing IDR enrollment is to reduce the paperwork burden. In a randomized experiment with actual student debtors, Mueller and Yanellis (2019) found that reducing paperwork burden could potentially double IDR enrollment.
Policymakers could also make IDR more financially attractive by lowering the required payments for a given income level or reducing the number of payments required to receive forgiveness. This would likely induce more people to enroll in IDR, but it would also change the scenario for current IDR enrollees. Given the low IDR take-up rate under current rules, the aggregate effects on current enrollees would likely be much larger than those on borrowers enticed to newly enroll.
Independent of efforts to increase IDR enrollment, proposed changes to IDR itself should be thoroughly vetted. Our results suggest changes to IDR parameters—income deduction amounts, marginal payment amounts, repayment horizons—can have surprisingly large effects on who is eligible, how much current enrollees ultimately pay out of pocket, and how long borrowers carry their debt. Which parameters are changed can also affect the relative progressivity of the changes, and all of these facets should be weighed carefully.
Our data consist of 116,868 Chase checking account customers with whom we have matched Experian credit bureau data for the period December 2015 through November 2016.
The credit bureau data do not include any information on whether a student debt account is enrolled in IDR. We flag borrowers as being in IDR in the following way. We first calculate each loan’s amortization schedule using the loan’s opening balance, the loan’s term in months, and the imputed interest rate of the loan based on month-to-month changes in balances when compared to reported payments made (see Farrell, Greig, and Sullivan 2020). From the calculated amortization schedule, we can see what monthly payments would be in the absence of IDR. We then compare the predicted monthly payment to the actual required minimum payment recorded by the credit bureau. If the actual scheduled monthly payment is at least 30 percent less than the predicted monthly payment, we flag that loan as being enrolled in IDR. When determining whether a borrower, rather than an individual loan, is enrolled in IDR, we require at least half of their loans to be flagged as “IDR”, with the remaining having at least a 10 percent difference between predicted monthly payment and the actual monthly payment. Any borrowers with both IDR and non-IDR loans are dropped from the sample. These partitions our sample into two mutually exclusive groups: those we predict are enrolled in IDR and those who are not. We also drop from the entire sample any borrower who has a loan flagged by the credit bureau as being in deferral or forbearance at any point during our sample period.
Next, we predict whether a borrower who is not enrolled in IDR might be eligible to enroll. To do this, we calculate the borrower’s annual take-home income as the sum of all deposits made into the account except for cross-account transfers (i.e., transfers into a checking account from a savings account). Note that this is a measure of income after taxes and other withholdings, while IDR eligibility depends on annual gross income (AGI). We assume a tax withholding rate of 22 percent to inflate our measure of take-home income to gross income. Next, we use this measure of gross income in the standard IDR payment calculation to determine the borrower’s maximum monthly payment under IDR. For the federal poverty threshold, we use the 2016 value for a one-person household of $11,880. We flag all borrowers whose scheduled minimum payments are greater than this predicted IDR payment as being eligible for IDR.
One important caveat to note about our approach is the difference between personal and household income. The borrowers we consider are the primary account holders for the accounts in our data. However, there may be other account holders who also deposit money into the account, such as a spouse. Thus, our income measure is likely closer to household income than personal income. But IDR eligibility could be determined by personal income if the borrower is unmarried or files their taxes separately from their spouse. As household income is weakly greater than personal income, this would cause us to underestimate the number of people eligible for IDR.
Because the bank accounts we observe may not be the only financial accounts used by the borrower, we also restrict our sample to accounts using certain criteria to increase the chances that these Chase bank accounts is their primary checking account through which they conduct most of their financial business, especially their income deposits. First, we require accounts to have at least five transactions (inflows or outflows) in every month in our sample period. Second, we require accounts to have at least $12,000 in income during the sample year. We require this minimum amount of income because, based on validation in previous research, accounts in our data with extremely low income are more likely to be secondary accounts of households that are actually higher income. Third, to further remove these secondary accounts, we compare our income measure to an estimate of gross income included in the credit bureau data and drop the account if bureau income is more than four times higher than our measure of take-home income.
Figure A
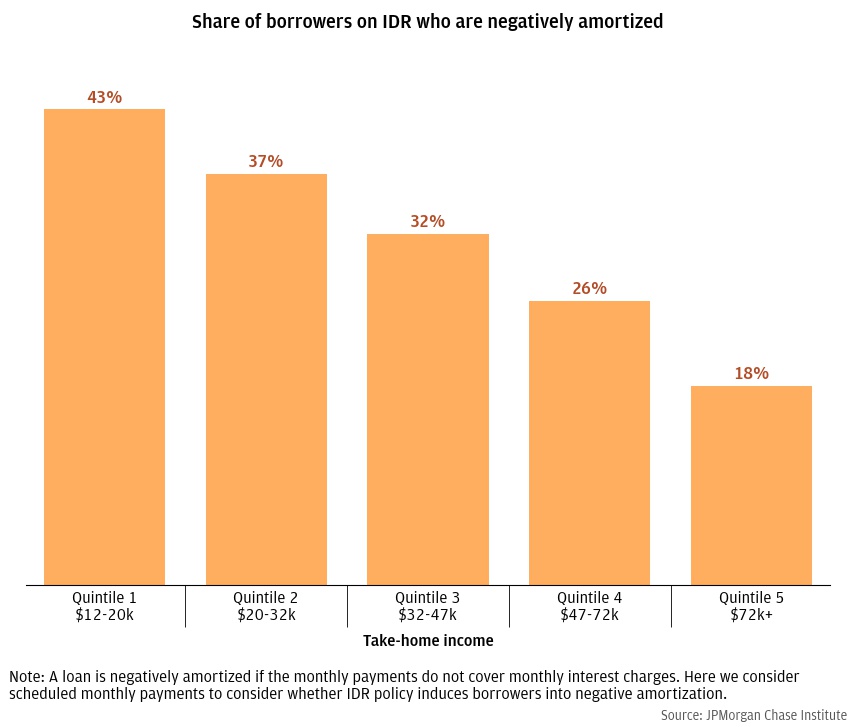
Figure B
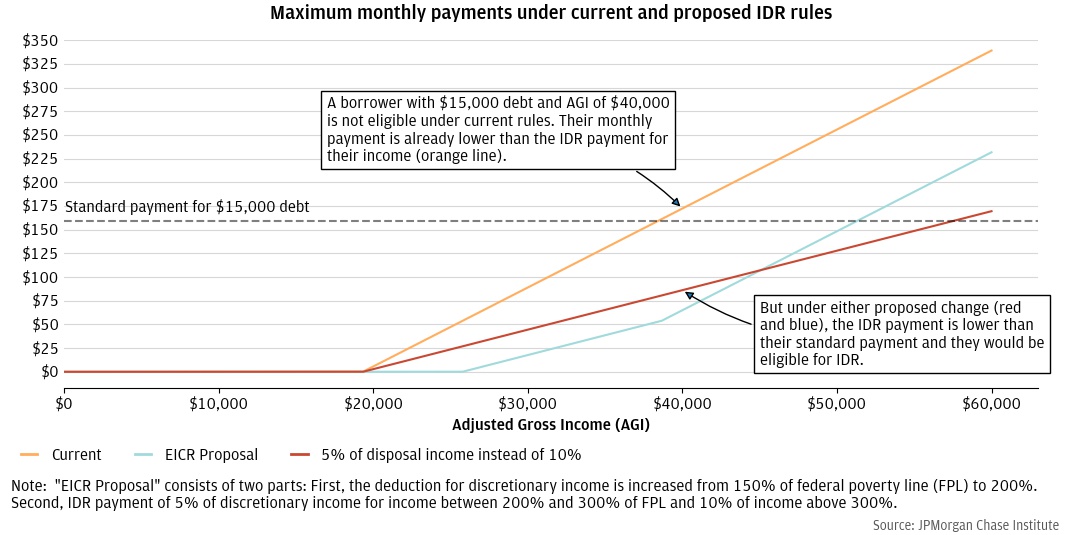
Figure C
For information on the federal government’s student debt portfolio, see https://studentaid.gov/data-center/student/portfolio.
Most recently, several members of Congress wrote to President Biden encouraging him to continue forbearance and to cancel some amount of student debt. See https://www.warren.senate.gov/imo/media/doc/2022.03.31%20Letter%20to%20President%20Biden%20re%20Payment%20Pause%20and%20Cancellation.pdf
For example, the Biden Administration’s federal fiscal year 2023 budget proposal increased funding for Pell Grants.
While most criticism of IDR has argued it is not generous enough, there are also arguments that IDR is too generous—there is no limit on the income of IDR participants—or that it creates undesirable incentives among borrowers. For example, two borrowers with equal incomes enrolled in IDR will have the same monthly payment amount even if though one borrower has 10 times as much debt. As a corollary, once borrowers are enrolled in IDR—or anticipate their future enrollment—the marginal cost to them of additional debt is zero. See Wessel and Yu (2022) for a summary of critiques of IDR.
Older IDR programs, like income contingent repayment (ICR) and the first version of income based repayment (IBR) used higher fractions of discretionary income. The details of each IDR plan can be found here: https://studentaid.gov/manage-loans/repayment/plans/income-driven
A borrower’s discretionary income is their adjusted gross income (AGI) from their tax return minus 150% of the federal poverty guideline for their household size. So a borrower with an AGI of $30,000 and a household of one person would subtract $12,880 (the federal poverty guideline for a household of one) to get $17,120 for their discretionary income, then take 10 percent of that to get their IDR payment: $1,712 per year or $142.67 per month.
A borrower can also stop participating in IDR by failing to recertify their income every year. In that case, the begin a new standard 10-year repayment period. However, a borrower can still re-enter the IDR program and get credit for the previous months of IDR payments made toward their 240 months required for forgiveness.
The repayment period is 25 years for graduate debt under the REPAYE program and for undergraduate debt under ICR and the initial incarnation of IBR.
After our estimated withholding of 22 percent to translate gross income to net income as observed in our data, this threshold is $13,900. See Appendix for additional details.
Specifically, if you suppose that all of the difference between our 9 percent IDR rate and CBO’s 23 percent rate is low income, negatively amortized borrowers, and if you were to add enough negatively amortized IDR borrowers to our sample to increase our overall IDR rate to 23 percent, the portion of IDR borrowers who are negatively amortized would be 73 percent, approximately in line with CBO’s estimate of negatively amortized IDR borrowers
Recall that these numbers represent take-home income, while IDR eligibility depends on gross income, so borrowers with a burden less than 10 percent here is possible. Note that half of eligible but not enrolled borrowers have a burden less than 10 percent when the cutoff for IDR eligibility is 10 percent. This is possible in our data because we observe in our data and conduct all our analyses on household net income—all take-home income from all household members that is deposited into checking accounts after taxes and other withholding—while actual IDR eligibility is based on gross income from tax filings. See Data section for details on how we estimate gross income from net income.
[1]We define borrowers has having made all their payments if they paid at least 90% of the sum of the scheduled monthly payments during the year. We use this definition because there is often a lag in the reporting of payments made late in the month to the credit bureau. For example, payments made late in December sometimes are sometimes reported in credit bureau data has having occurred in January. As a result, many borrowers who in fact made all 12 of their monthly payments would appear in our data to have made only 11 payments, or 91.7 percent of the sum of their monthly payments during the year. Thus, we define borrowers has having made all their payments if the sum of their reported payments are at least 90 percent of the sum of the scheduled payments. Note further that we do not use the credit bureau’s delinquency flag here because those may include missed payments that were never made up.
It is also possible that the account activity we observe offers an incomplete picture of households’ income, either because these particular households conduct a lot of activity in cash or have additional accounts we don’t observe.
We measure help received as the difference between the amount of money paid toward the student debt account, as measured by the credit bureau, and the amount of money paid by the borrower’s accounts toward student debt. For example, if the credit bureau reports that $500 was paid toward the borrower’s loans but we observe that $300 was paid out of the borrower’s Chase accounts, then we say that the borrower received $200 of help
While the source of this money could be a non-Chase checking account owned by the borrower, we take several steps to exclude people from our sample who may have checking accounts at other institutions. Moreover, we document in other research that households who are pure providers of help—those who hold no debt themselves but make significant payments to student debt servicers—tend to be older and wealthier (Farrell, Greig, and Sullivan 2020).
For example, NPR recently reported that some student loan servicers have not been tracking IDR participation correctly. See https://www.npr.org/2022/04/01/1089750113/student-loan-debt-investigation.
Recall that our sample under-represents the lowest-income IDR enrollees, so this figure is likely under-estimates the true fraction of borrowers who are eligible.
In this exercise, we do not use a more sophisticated measure of the cost of future loan payments, like the net present value of all future loan payments, because we want to reflect borrower decision making and tools borrowers might use, such as truth-in-lending type heuristics, as much as possible.
Because we only observe one year of data, we have no way of knowing when a borrower enrolled in IDR. For simplicity, we assume borrowers enrolled no later than 2012.
See Appendix Figure C.
See Figures 8 and 9.
Abraham, Katharine G., Emel Filiz-Ozbay, Erkut Y. Ozbay, and Lesley J. Turner. 2020. “Framing effects, earnings expectations, and the design of student loan repayment schemes.” Journal of Public Economics (183).
Bernheim, B. Douglas, Andrey Fradkin, and Igor Popov. 2015. "The Welfare Economics of Default Options in 401(k) Plans." American Economic Review, 105 (9): 2798-2837.
Blumenstock, Joshua, Michael Callen, and Tarek Ghani. 2018. “Why Do Defaults Affect Behavior? Experimental Evidence from Afghanistan.” American Economic Review (108):10: 2868–2901.
Congressional Budget Office. 2020. “Income-Driven Repayment Plans for Student Loans: Budgetary Costs and Policy Options.” https://www.cbo.gov/publication/55968
Cox, James C., Daniel Kreisman, and Susan Dynarski. 2020. “Designed to fail: Effects of the default option and information complexity on student loan repayment.” Journal of Public Economics 192.
Consumer Financial Protection Bureau. 2019. “Data Point: Borrower Experiences on Income-Driven Repayment.” The CFPB Office of Research Report. https://www.consumerfinance.gov/data-research/research-reports/data-point-borrower-experiences-income-driven-repayment/
Farrell, Diana, Fiona Greig, and Daniel M. Sullivan. 2020. “Student Loan Debt: Who is Paying it Down?” JPMorgan Chase Institute. https://www.jpmorganchase.com/insights/all-topics/financial-health-wealth-creation/student-loan-debt.
Mueller, Holger M., and Constantine Yannelis. 2019. “Reducing Barriers to Enrollment in Federal Student Loan Repayment Plans: Evidence from the Navient Field Experiment.” Working paper.https://bfi.uchicago.edu/wp-content/uploads/Navient-September-4-2019.pdf
Pew Charitable Trusts. 2022. “Redesigned Income-Driven Repayment Plans Could Help Struggling Student Loan Borrowers.” Report. https://www.pewtrusts.org/en/research-and-analysis/reports/2022/02/redesigned-income-driven-repayment-plans-could-help-struggling-student-loan-borrowers
Wessel, David, and Persis Yu. 2022. “Income-Driven Repayment of Student Loans: Problems and Options for Addressing Them.” Report, Hutchens Center on Fiscal & Monetary Policy at Brookings. https://www.brookings.edu/wp-content/uploads/2022/03/IDR-student-loan-report.pdf
We thank Sarah Kuehl, Clarke Wilson, Stephen Harrington, Kristine Pham, Annabel Jouard, Robert Caldwell, and Anthony Rivera for their support. We are indebted to our internal partners and colleagues, who support delivery of our agenda in a myriad of ways and acknowledge their contributions to each and all releases.
We are also grateful for the invaluable constructive feedback we received from external experts and partners. We are deeply grateful for their generosity of time, insight, and support. This research was possible because of the vital partnership, data, and knowledge from Experian.
We would like to acknowledge Jamie Dimon, CEO of JPMorgan Chase & Co., for his vision and leadership in establishing the Institute and enabling the ongoing research agenda. We remain deeply grateful to Peter Scher, Vice Chairman, Demetrios Marantis, Head of Corporate Responsibility, Heather Higginbottom, Head of Research & Policy, and others across the firm for the resources and support to pioneer a new approach to contribute to global economic analysis and insight.
This material is a product of JPMorgan Chase Institute and is provided to you solely for general information purposes. Unless otherwise specifically stated, any views or opinions expressed herein are solely those of the authors listed and may differ from the views and opinions expressed by J.P. Morgan Securities LLC (JPMS) Research Department or other departments or divisions of JPMorgan Chase & Co. or its affiliates. This material is not a product of the Research Department of JPMS. Information has been obtained from sources believed to be reliable, but JPMorgan Chase & Co. or its affiliates and/or subsidiaries (collectively J.P. Morgan) do not warrant its completeness or accuracy. Opinions and estimates constitute our judgment as of the date of this material and are subject to change without notice. No representation or warranty should be made with regard to any computations, graphs, tables, diagrams or commentary in this material, which is provided for illustration/reference purposes only. The data relied on for this report are based on past transactions and may not be indicative of future results. J.P. Morgan assumes no duty to update any information in this material in the event that such information changes. The opinion herein should not be construed as an individual recommendation for any particular client and is not intended as advice or recommendations of particular securities, financial instruments, or strategies for a particular client. This material does not constitute a solicitation or offer in any jurisdiction where such a solicitation is unlawful.
Greig, Fiona, Daniel M Sullivan, Bernard Ho. 2022. “Income Driven Repayment: Who needs student loan payment relief?” JPMorgan Chase Institute. https://www.jpmorganchase.com/insights/all-topics/financial-health-wealth-creation/student-loan-income-driven-repayment
Authors

Fiona Greig
Former Co-President

Daniel M. Sullivan
Consumer Research Director, JPMorganChase Institute

Bernard Ho
Research Associate