Findings

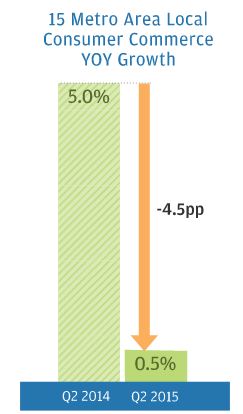
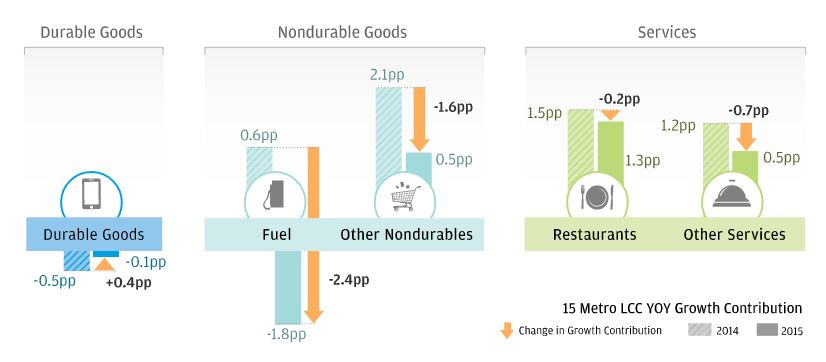
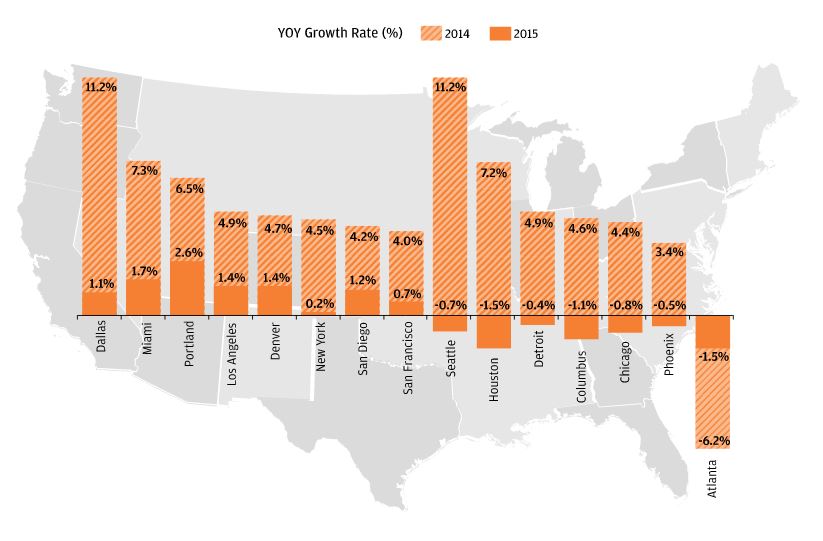
Research from the JPMorgan Chase Institute shows that the year-to-year growth of consumers’ everyday spending on most goods and services in 15 major US metropolitan areas has slowed dramatically, from 5 percent in the second quarter of 2014 to 0.5 percent in the comparable period in 2015.

This slowdown in everyday spending growth is one of several puzzling signals in the data on the US economy. Gross domestic product has increased every quarter except for Q1 2014 in the past four years, but in fits and starts. Unemployment is down and corporate profits have largely been solid. In real terms, retail sales have also grown every quarter since the 2009 recession, though inconsistently and at a slowing rate. Within the sector, spending growth has differed significantly by category. For example, auto sales have grown strongly in recent months, but several big chains and other merchants are forecasting a tough 2015 holiday season.

Column chart showing 15 metro area local consumer commerce, year over year growth.

Column chart showing 15 metro area local consumer commerce, year over year growth. 

A new, powerful data asset—the JPMorgan Chase Institute “Profiles of Local Consumer Commerce”—allows us to shed light on these ambiguous indicators. With this new data set, we can analyze important characteristics of the transactions between consumers and businesses at the point of sale and at the neighborhood, city, and metropolitan-area levels. In this initial report, we use these data to explore the marked 4.5 percentage-point slowdown in the growth of local consumer commerce between Q2 2014 and Q2 2015 across 15 metropolitan areas nationwide. Specifically, we identify the contribution of different consumer and business segments to this slowdown.

01

Middle- and high-income consumers, and consumers ages 65 and older, were responsible for most of the slowdown in growth, while low-income consumers and those under 35 maintained relatively stable spending growth.

We attribute the slowdown in spending growth to higher—income and older consumers, whose spending fell significantly from a moderate level of growth. This contrasts with young consumers, whose spending continued to grow healthily, and with low-income consumers, whose spending slowed but is still rising.

Bar graph describes 15 Metro LCC YOY Growth Contribution by Age and Income

Finding One

YOY Growth Contribution by Age and Income

  Q2 2014 Q2 2015 Change
Under 35 Years 2.2pp 1.6pp 0.6pp decrease
Prime Age Workers - Low Income 0.6pp 0.1pp 0.5pp decrease
Prime Age Workers - Medium Income 1.0pp -0.2pp 1.2pp decrease
Prime Age Workers - High Income 1.0pp -0.3pp 1.3pp decrease
65 and older 0.3pp -0.8pp 1.1pp decrease

pp = percentage point

01

Spending at large businesses shrunk more than spending at small- and medium-sized enterprises (SMEs), though SMEs accounted for almost as much of the slowdown in local consumer commercial spending as large businesses.

Spending growth at large businesses fell sharply, from an increase of nearly 7 percent from Q2 2013 to Q2 2014 to a decline of almost 1 percent from Q2 2014 to Q2 2015. Spending growth at small- and medium-sized enterprises also slowed, though to a lesser extent. However, SMEs account for nearly 70 percent of local consumer commerce sales. As a result, SMEs contributed nearly as much to the slowdown in growth of local consumer commerce as large businesses.

Bar graph describes 15 Metro LCC YOY Growth Contribution by Business Size

Finding Two

YOY Growth Contribution by Business Size

  Q2 2014 Q2 2015 Change
SMEs (small- & medium-sized enterprises) 2.9pp 0.6pp 2.3pp decrease
Large Businesses 2.2pp -0.2pp 2.4pp decrease

pp = percentage point

01

The growth of spending by consumers at businesses in their own metropolitan areas slowed the most, particularly at businesses in their own neighborhoods.

We attribute the slowdown in spending growth to considerably fewer purchases by residents from businesses in their neighborhood—spending plummeted from a 9 percent growth rate to zero. Purchases by residents from businesses within the same metropolitan area (but not in the same neighborhood) also fell, but not as steeply. In contrast, spending by out-of-town consumers rose, although they represent a much smaller share of total metropolitan area sales.

Bar graph describes 15 Metro LCC YOY Growth Contribution by Consumer Residence

Finding Three

YOY Growth Contribution by Consumer Residence

  Q2 2014 Q2 2015 Change
Same Neighborhood 2.7pp -0.1pp 2.8pp decrease
Same Metro Area 2.2pp 0.2pp 2.0pp decrease
Outside Metro Area 0.1pp 0.3pp 0.2pp increase

pp = percentage point

01

Spending growth at businesses that sell fuel and other nondurable goods slowed dramatically, and not only because of price declines.

We attribute the slowdown in spending growth to businesses that sell fuel and other nondurable goods. While fuel was a small share of total spending, the sharp decline in gas prices contributed significantly to the overall slowdown in local consumer commerce. Nearly as important was a slowdown in spending on other nondurables, notably apparel, food, medical commodities, and recreational goods. Among these other nondurables, price declines contributed only to slowing spending on apparel, and just in part. Restaurants and other services continued to see moderate, but leveling, growth.

Bar graph describes 15 Metro LCC YOY Growth Contribution by Product Type

Finding Four

YOY Growth Contribution by Product Type

Durable Goods

  Q2 2014 Q2 2015 Change
Durable Goods -0.5pp -0.1pp 0.4pp increase

Nondurable Goods

  Q2 2014 Q2 2015 Change
Fuel 0.6pp -1.8pp 2.4pp decrease
Other Nondurables 2.1pp 0.5pp 1.6pp decrease

Services

  Q2 2014 Q2 2015 Change
Restaurants 1.5pp 1.3pp 0.2pp decrease
Other Services 1.2pp 0.5pp 0.7pp decrease

pp = percentage point

01

Strong and diverse growth across most metropolitan areas from Q2 2013 to Q2 2014 has slowed to tepid growth across the board from Q2 2014 to Q2 2015.

We find weaker spending in nearly all 15 metropolitan areas, with no city experiencing particularly strong growth. Local consumer commercial growth among the 15 cities ranged from -1.5 percent to 2.6 percent between Q2 2014 and Q2 2015. In contrast, spending growth rates rose in most of the cities between Q2 2013 and Q2 2014, with a range of 2.7 percent to 11.2 percent. Atlanta was the exception, showing a decline in local consumer commerce in both periods.

Bar graph describes YOY Growth Rate by City

Finding Five

YOY Growth Rate by City

  Q2 2014 Q2 2015
Dallas 11.2% 1.1%
Miami 7.3% 1.7%
Portland 6.5% 2.6%
Los Angeles 4.9% 1.4%
Denver 4.7% 1.4%
New York 4.5% 0.2%
San Diego 4.2% 1.2%
San Francisco 4.0% 0.7%
Seattle 11.2% -0.7%
Houston 7.2% -1.5%
Detroit 4.9% -0.4%
Columbus 4.6% -1.1%
Chicago 4.4% -0.8%
Phoenix 3.4% -0.5%
Atlanta -6.2% -1.5%

Data

Infographic shows how data was collected

Data

We use 12.4 billion credit and debit card transactions of 48 million anonymized JPMorgan Chase customers conducted over 34 months to analyze the growth of local consumer commerce at business establishments in 15 metropolitan areas. We analyze how the growth of local consumer commerce is shaped by the following:

  • Consumer Age:
    How do older and younger consumers spend differently?
  • Consumer Income:
    Does spending grow more quickly for higher income consumers or lower income consumers?
  • Business Size:
    Do large businesses contribute more to spending growth than Small and Medium Enterprises?
  • Product Type:
    How does spending differ across durable goods, nondurable goods, and services?
  • Consumer Residence:
    Do consumers who live in the same area as a business spend more or less than those who live farther away?

Our analyses show that changes in spending by higher-income older consumers played a major role in the slowdown of spending growth, as did spending at both SMEs and large businesses, spending on nondurable goods including but not limited to fuel, and spending by customers at the businesses closest to home. Over time, Profiles of Local Consumer Commerce will provide monthly data on commercial vibrancy at the national and city level and will be released on a quarterly basis. We hope our ongoing data series will serve as a rich platform to help answer important questions about the consumer sector, the dominant sector of the economy.

Authors

Diana Farrell

Diana Farrell

Founding and Former President & CEO

Chris Wheat

Chris Wheat

President, JPMorganChase Institute