Findings

Technological innovation is transforming economic exchange. Just a decade ago, the Online Platform Economy comprised a handful of marketplaces connecting independent sellers to buyers of physical goods. Today, many consumers use software platforms to procure almost any kind of good or service from independent suppliers as a routine part of daily life. Have these innovations created viable new options for making a living?

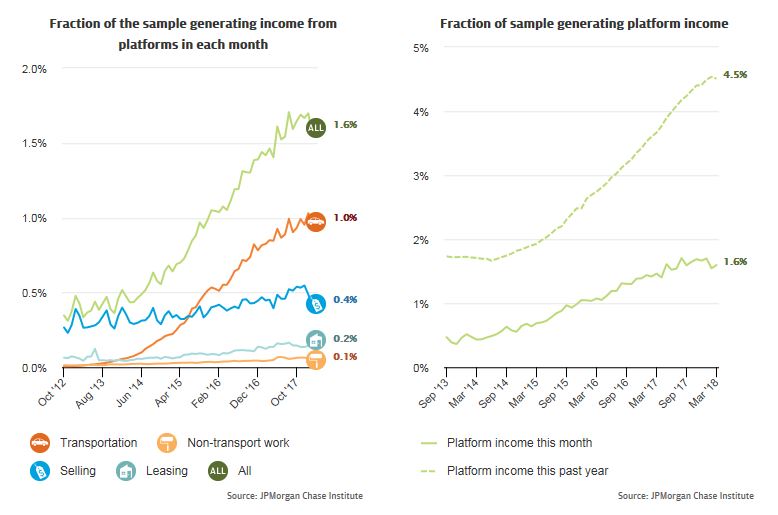
For this study, we extend the JPMorgan Chase Institute Online Platform Economy dataset in order to track supply-side participation and earnings. We identify 38 million payments directed through 128 different online platforms to 2.3 million distinct Chase checking accounts, out of a de-identified sample of 39 million, between October 2012 and March 2018. Our description distinguishes four sectors of the Online Platform Economy:

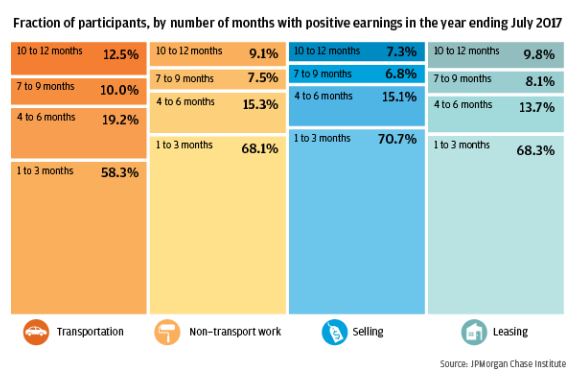
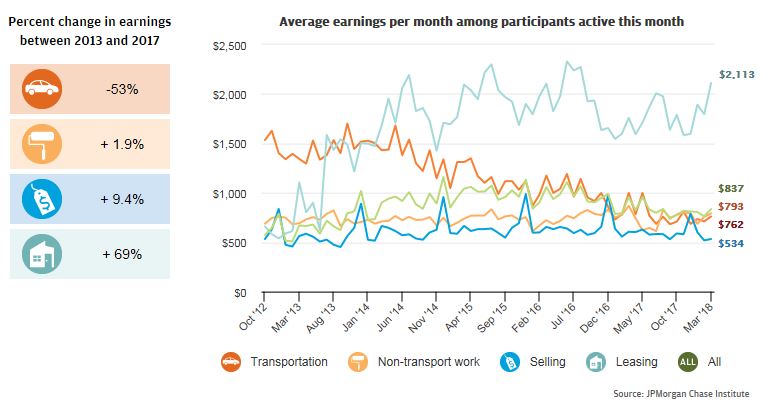
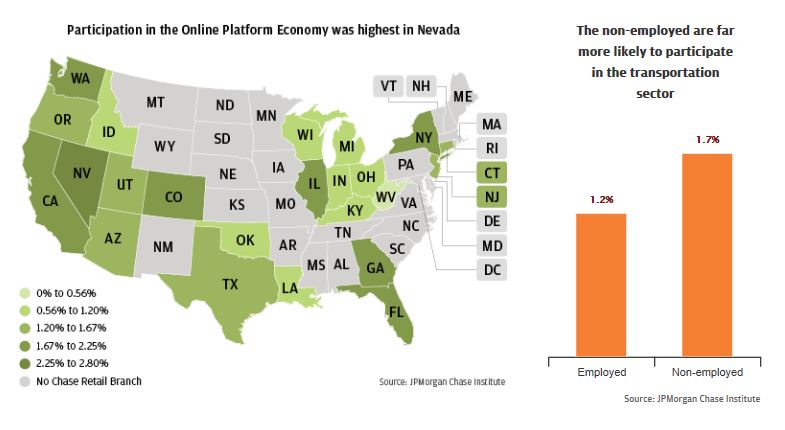
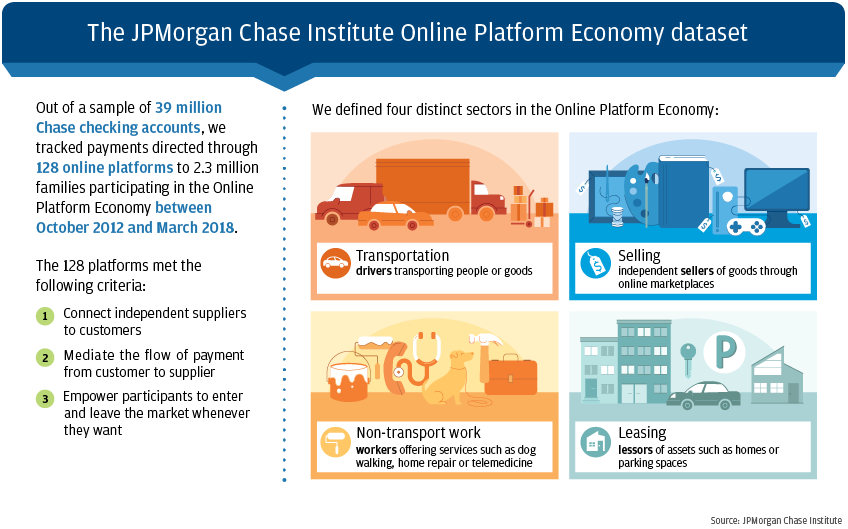
  1. The transportation sector, in which drivers transport people or goods
  2. The non-transport work sector, in which workers offer a growing variety of services including dog walking, home repair, telemedicine, and many others
  3. The selling sector, in which independent sellers of goods find buyers through online marketplaces
  4. The leasing sector, in which lessors find lessees to rent homes, parking spaces, and many other types of assets.
01

The Online Platform Economy has continued to grow. Between 2013 and 2018, transportation platforms have grown to dominate in terms of both the number of participants and total transaction volume.

The fraction of our sample earning platform income increased from 0.3 percent in the first quarter of 2013 to 1.6 percent in the first quarter of 2018. As of March 2018, 4.5 percent of families had participated in the Online Platform Economy at some point over the prior year. Between 2013 and 2018, transportation platforms have grown to dominate in terms of both the number of participants and total transaction volume. By March 2018, transportation platforms accounted for as many participants and as many dollars as the other three sectors combined.

Line graph1 describes about Fraction of the sample generating income from platforms in each month and Line graph2 describes about Fraction of sample generating platform income

Finding One

Fraction of the sample generating income from platforms in each month

Participation in the online platform economy has grown steadily from 0.3 percent in the first quarter of 2013 to 1.6 percent in the first quarter of 2018. This growth in participation has been driven entirely by the expansion of the transport sector, which constitute 1.0 percent of families participating in the first quarter of 2018.

Fraction of sample generating platform income

Participants tend to enter and leave the Online Platform Economy at a high frequency. This chart tracks an alternative metric of participation: the share of accounts with any platform earnings during a year, rather than during a month. As of March 2018, the fraction of families that generated platform income in the past year is 4.5 percent.


01

Most participants in the Online Platform Economy are active in just a few months out of the year.

Among those who generated earnings through transportation platforms at any point in a year, 58 percent had earnings in just three or fewer months of that year. In the other sectors, engagement was even more sporadic, with less than 20 percent of participants generating earnings in more than half the year.

Infographic describes about Fraction of participants, by number of months with positive earnings in the year ending July 2017

Finding Two

Cities with the highest and lowest share of firms

Sector 1 to 3 months 4 to 6 months 7 to 9 months 10 to 12 months
Transportation 58.3% 19.2% 10.0% 12.5%
Non-transportation work 68.1% 15.3% 7.5% 9.1%
Selling 70.7% 15.1% 6.8% 7.3%
Leasing 68.3% 13.7% 8.1% 9.8%
01

The growth in the supply of drivers has come alongside a 53 percent decline in average transportation earnings.

Between 2013 and 2017, earnings fell by 53 percent in the transportation sector and grew by 69 percent in the leasing sector. Earnings in the non-transport work and selling sectors were volatile but showed no strong trends.

Infographic describes about Percent change inearnings between 2013 and 2017 and Line graph describes about Average earnings per month among participants active this month

Finding Three

Percent change in monthly earnings from 2013 to 2017

Sector Percent change, 2013 to 2017
Transportation -53%
Non-transportation work + 1.9%
Selling + 9.4%
Leasing + 69%

Average earnings per month among participants active this month

Between 2013 and 2017, earnings fell by 53 percent in the transportation sector and grew by 69 percent in the leasing sector. Earnings in the non-transport work and selling sectors were volatile but showed no strong trends.

This chart illustrates how the growth in total transaction volume and number of participants on online platforms interact. Overall, average platform earnings grew at a rate of about 2 percent per month from the first quarter of 2013 to the first quarter of 2015, then leveled off before declining again starting in mid-2016. The evolution of the overall average is driven by strikingly different sector-specific patterns. Mostly notably, average monthly platform earnings among drivers fell steadily at a rate of about 1.4 percent per

01

Platform earnings represent a major source of income for families in the months they participate but only 20 percent of income among those who participated at any point in the prior year.

In January 2018, platform earnings represented 54 percent of total observed take-home income among active participants. However, platforms are not replacing traditional sources of family income. Among those who have participated in the Online Platform Economy at any point in a year, average platform earnings represent roughly 20 percent of total observed take-home income in any month of that year.

Line graph describes about Ratio of platform earnings this month to total observed take-home income this month

Finding Four

As of January 2018, platform earnings represented 54 percent of total observed take-home income for those who were active in the month and 20 percent of total observed take-home income for those who participated at any point in the previous year.

01

Participation rates in the Online Platform Economy varied significantly across the nation.

Among 23 states and 26 cities, Nevada and San Francisco had the highest participation rates, with roughly 2.8 percent of families generating platform earnings in March 2018. The nonemployed and men were more likely than the employed and women to participate on transportation platforms. The young were more likely to participate in all sectors.

Infographic describes about Participation in the Online Platform Economy was highest in Nevada and Bar graph describes about The non-employed are far more likely to participate in the transportation sector

Finding Five

Among 23 states and 26 cities, Nevada and San Francisco had the highest participation rates, with roughly 2.8 percent of families generating platform earnings in March 2018. The nonemployed and men were more likely than the employed and women to participate on transportation platforms. The young were more likely to participate in all sectors.

Data

Infographic describes about The JPMorgan Chase Institute Online Platform Economy dataset

The JPMorgan Chase Institute Online Platform Economy dataset

Out of a sample of 39 million Chase checking accounts, we tracked payments directed through 128 online platforms to 2.3 million families participating in the Online Platform Economy between October 2012 and March 2018.

The 128 platforms met the following criteria:

  • Connect independent suppliers to customers
  • Mediate the flow of payment from customer to supplier
  • Empower participants to enter and leave the market whenever they want

We defined four distinct sectors in the Online Platform Economy:

  • Transportation: drivers transporting people or goods
  • Non-transportation labor: laborers offering services such as dog walking, home repair, telemedicine
  • Selling: independent sellers of goods through online marketplaces
  • Leasing: lessors of homes, parking spaces, and many other types of assets.

Conclusion

The Online Platform Economy is growing. As it grows, its sectors are diverging in important ways, raising the question as to whether they require tailored policy approaches. While freelance driving has been the engine of growth for the Online Platform Economy, it is not a full time job for most participants. In fact, alongside the rapid growth in the number of drivers has come a steady decline in average monthly earnings. Non-transportation work platforms continue to innovate on the types of contracts between independent suppliers and their customers. In selling and leasing sectors, high platform earnings are concentrated among a few participants. More broadly, we do not find evidence that the Online Platform Economy is replacing traditional sources of income for most families. Taken together, our findings indicate that regardless of whether or not platform work could in principle represent the “future of work,” most participants are not putting it to the type of use that would usher in that future.

Authors

Amar Hamoudi

Amar Hamoudi

JPMC Institute

Diana Farrell

Diana Farrell

Founding and Former President & CEO

Fiona Greig

Fiona Greig

Former Co-President