
Figure 1: Black and Hispanic households experienced stronger proportional income growth than White households as the labor market tightened and fiscal policies since COVID preserved gains.

Creating thriving communities together
See how our clients and partners—from small business owners to workforce training leaders—work with JPMorganChase to drive meaningful impact and economic growth where they live and work.
Learn moreLatest news

Veteran’s Unconventional Path to Landing her Dream Job in Tech
U.S. Army Veteran Ashley Wigfall transitioned to a civilian role and charted her path to technologist through mentorship and skills training at the JPMorgan Chase tech hub in Plano, Texas.
Learn more
Findings
Income disparities by race are large and persistent in the U.S. (see table below), and wealth gaps are even larger.1 Moreover, the booms and busts of the overall economy land unequally across the workforce—with lower income individuals and, disproportionately, Black and Hispanic families bearing the brunt of recessions. The relationship between the economic cycles and racial inequality has been prominent more recently in the Federal Reserve’s agenda of supporting broad-based growth and inclusive recovery from the COVID-19 recession. Meanwhile, fiscal policy—through unemployment insurance (UI) and stimulus—can play an essential role in mitigating the tendency for economic cycles to exacerbate disparities.
Median Household Income by Race: 2013-20
(2020 dollars)
Asian | 87,550 |
White | 71,100 |
Hispanic | 51,010 |
Black | 42,210 |
Source: Census Bureau
In this Insight, we build on previous Institute work studying the relationship between economic cycles and the distribution of income growth. Using an administrative dataset enriched with third-party demographic information covering over 1 million households, we study income growth outcomes by race from the aftermath of the Great Recession through the COVID-19 pandemic.2 We integrate race information with observed differences in income levels, age, and geography to help discern the extent to which these other factors might help explain financial outcomes. As in the prior report, we use metrics measured at the household-level to highlight trends in take-home-pay experienced by families, which helps avoid distortions from the shifts in the composition of employment.
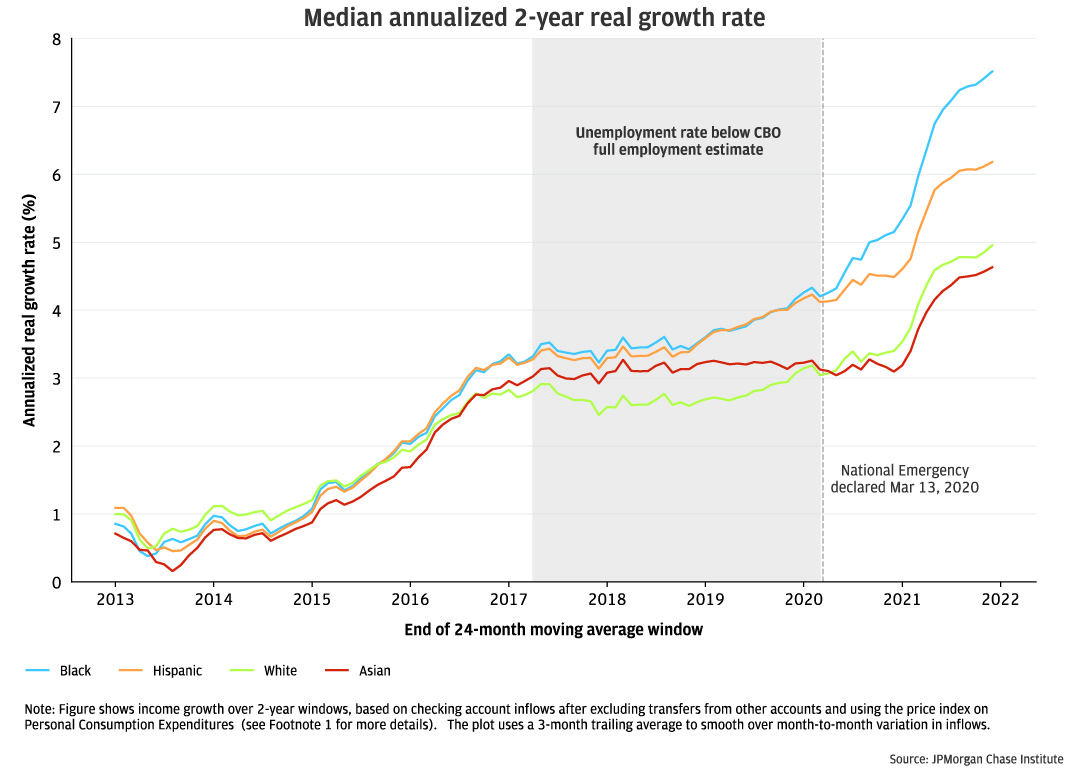
Figure 1 tracks medium-term (2-year) annualized real income growth by race from 2013 through 2021.3 Wide variation in labor market conditions and policy comprise the sample, which starts during the long expansion following the Great Recession when the U.S. unemployment rate was still near its peak of about 10 percent. Initially, Black and Hispanic households experienced income growth near or below those of White households with similar characteristics.4 However, the dynamic flipped by the end of the cycle just prior to COVID, alongside an unemployment rate below 4 percent. Black and Hispanic households began experiencing somewhat higher income growth rates. The trend since COVID has increased income growth for most households, but particularly so for Black and Hispanic households. These trends point to modest reductions—relative to overall gaps—in racial economic inequality.5
Figure 1: Black and Hispanic households experienced stronger proportional income growth than White households as the labor market tightened and fiscal policies since COVID preserved gains.
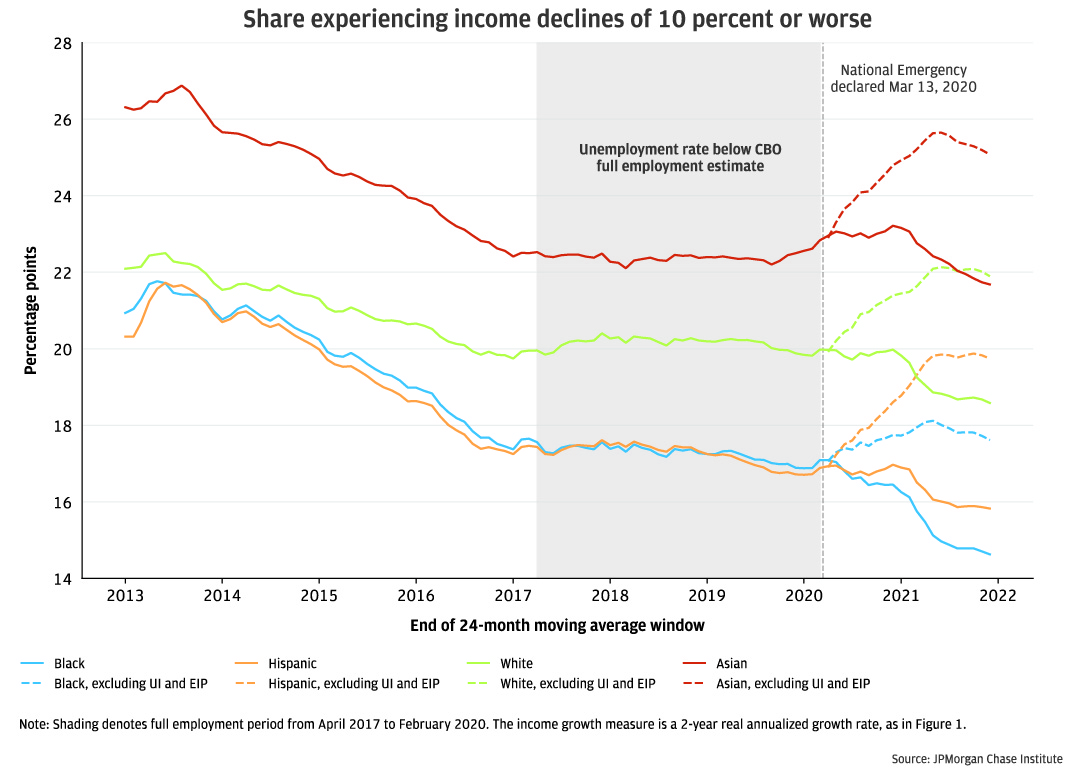
Turning to downside income risk, Figure 2 shows the estimated share of the population experiencing annualized real income declines of more than 10 percent, using the same two-year windows used in Figure 1. Large income declines are more likely for higher income individuals in our sample, which shows up by race in this analysis even after controlling for income. Asian households—the highest earning group in our data—have the highest likelihood of large income declines, outstripping the share for White households by 2 to 4 percentage points. The shares for Black and Hispanic households exhibited approximately equivalent dynamics up until COVID. After the onset of the pandemic, however, the share of Black households experiencing large income declines fell relative to all other groups, both including and excluding UI and inflows from Economic Impact Payments (EIP).
Figure 2. Fiscal supports made large negative income shocks less common, with Black and Hispanic households benefiting the most.
The preceding figures, based on 24-month income windows, argue that real wage gains (adjusted for price increases) have been robust considering the post-pandemic period as a whole. The rapid increase in inflation since mid-2021, however, has called into question the trajectory of real earnings growth on a more near-term basis.6
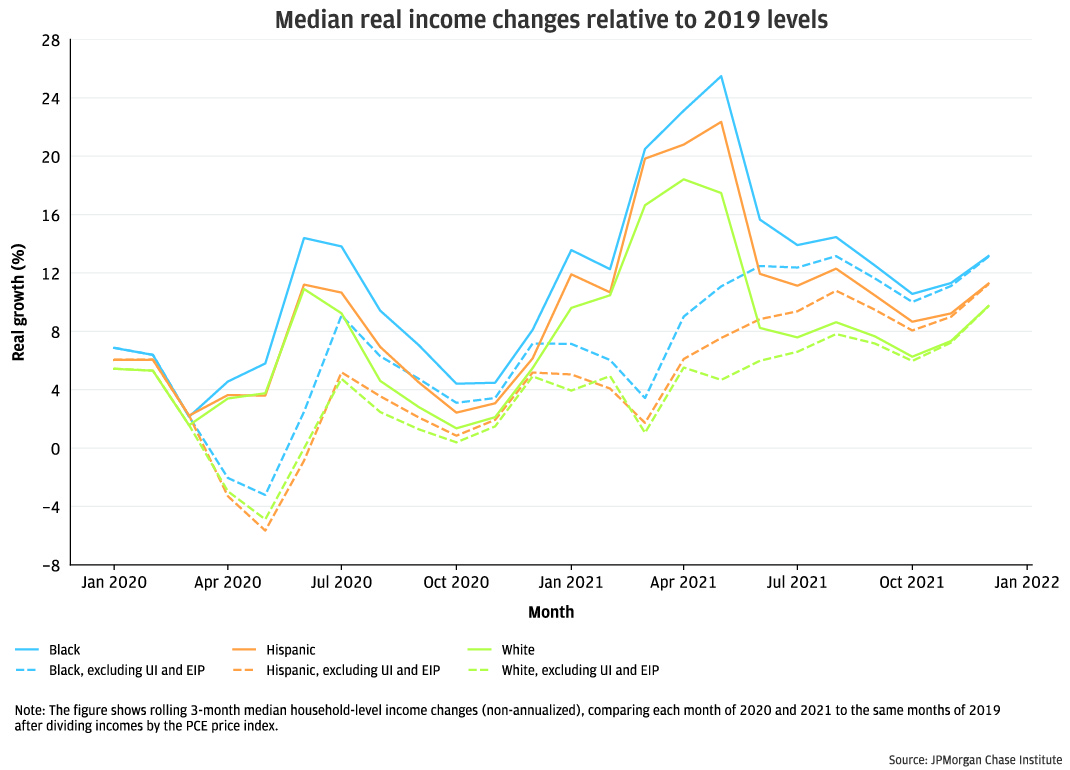
Zooming in to a higher-frequency perspective—rolling quarterly data—we find that the improvement in real incomes relative to pre-pandemic levels remains robust, although price increases and the lapse in fiscal supports in the second half of 2021 has tilted the path of total income downward. Figure 3 shows median changes in checking account-based income 7 relative to 2019 levels, adjusting for inflation.8 As of late 2021, nominal earnings had outstripped the increase in consumer prices by 9 to 13 percentage points across race groups, with Black households experiencing the strongest gains. Even when we exclude stimulus and unemployment insurance benefits, which disproportionately supported Black and Hispanic households, real income growth has been faster among Black and Hispanic families than White families. These relative gains, however, lost momentum after mid-2021.
Figure 3: Incomes have risen strongly from pre-pandemic levels, but the trajectory of total incomes in real terms was negative over the second half of 2021 for all race groups, as fiscal supports lapsed and prices rose.
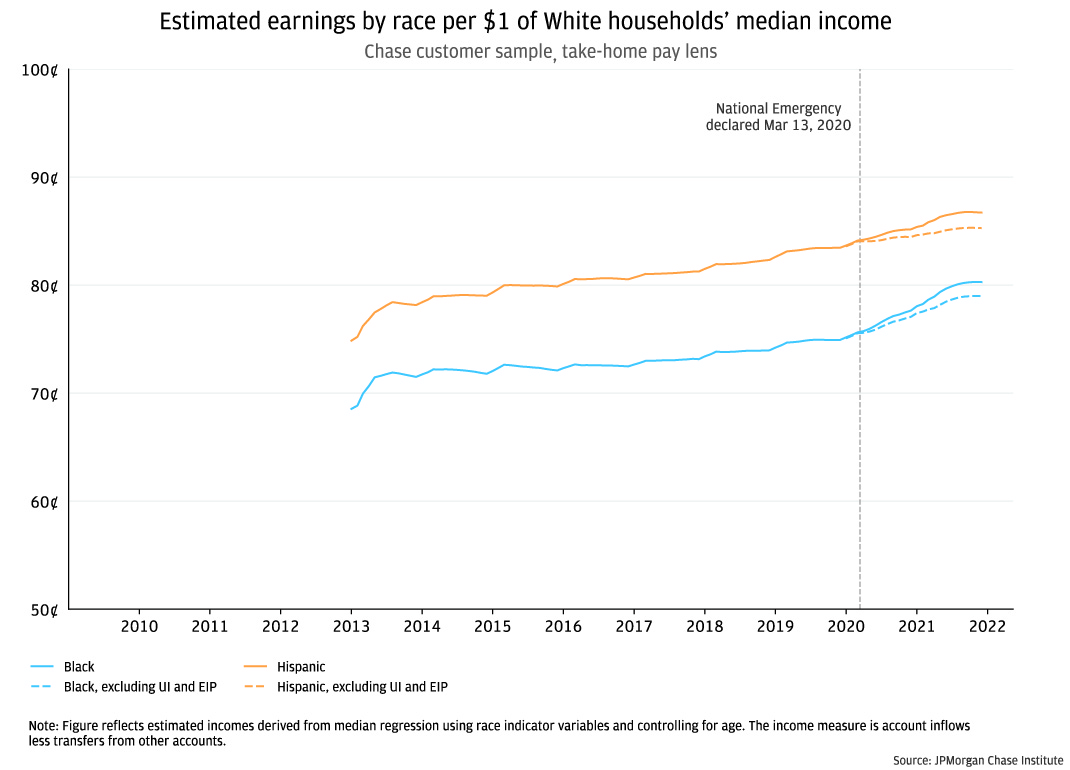
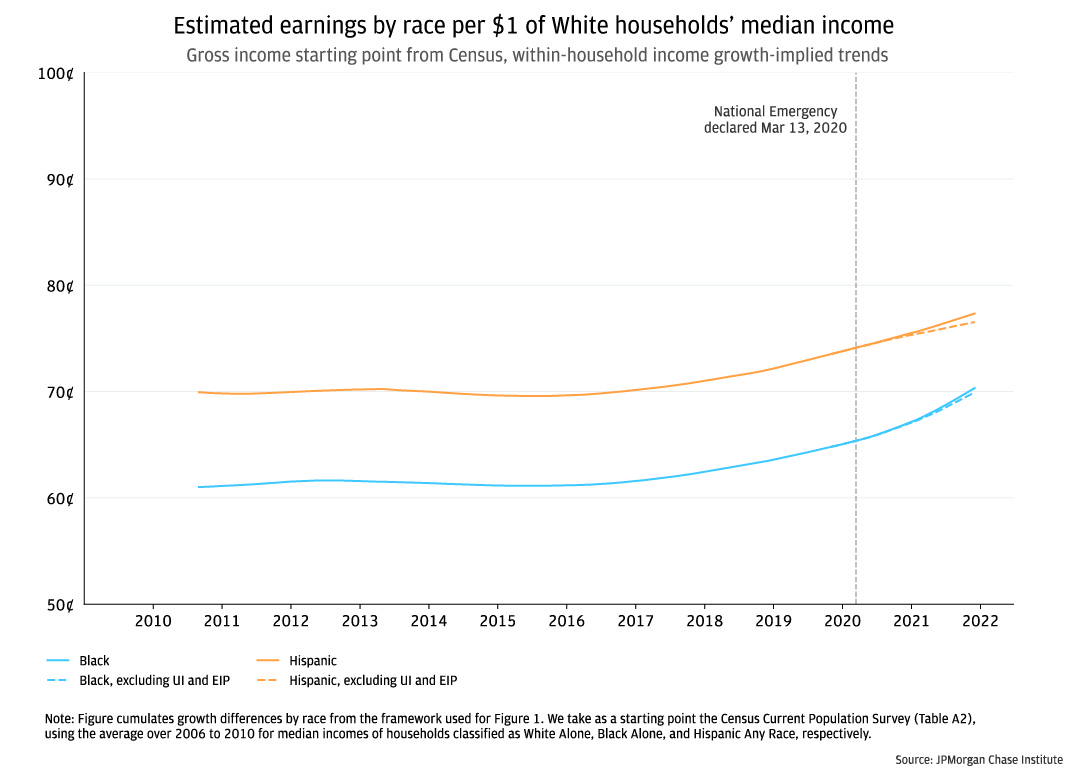
Percentage gains measured in growth rates, however, have only contributed to a modest narrowing over the overall racial income gap, considering the prevailing factors of a tight labor market and fiscal supports over the period. Using a take-home-pay measure of income, Black and Hispanic households in our Chase sample earned just 70 and 76 cents per dollar of White households’ income in early 2013, after controlling for age differences by race.9 This metric improved over the sample period (see Figure 4a), converging by approximately 10 cents for both Black and Hispanic households. The increase is a bit smaller after excluding UI and EIP transfers over the past two years.
According to Census data, in 2009 for every dollar of (gross) income earned by White families, Black families earned just 61 cents, and Hispanic households earned 70 cents. The gap between the Census gross income metric and the Chase-only data is influenced by differences in average tax rates or automatic retirement savings deductions by race as well as sample composition. As depicted earlier in Figure 1, median growth rates differed by less than a few percentage points over most of the sample—controlling for age and income level differences—across race groups. If we aggregate these income growth differences, we can gain an alternative perspective on the question of income convergence by race over the period (shown in Figure 4b), which leverages the within-household growth perspective.
The within-household growth method largely confirms the result in Figure 4a, finding that Black and Hispanic households’ earnings gained compared to White households from the mid-2010s through the end of 2021. The second method (in 4b), in which we can control for income level differences between races, shows a somewhat smaller amount of convergence between race groups over the sample period, 6 to 7 cents, compared to 10 cents (in 4a). Relative gains were roughly evenly split between the several years preceding the COVID-19 pandemic and the period from March 2020 through December 2021. The within-household perspective finds a smaller role for fiscal transfers in driving the trend during the pandemic, likely due to the inclusion of income level controls in that method.
Figure 4: Black and Hispanic households, in aggregate, began to narrow the income gap relative to White households in the years preceding and since the pandemic.
Volatility in incomes alongside fluctuations in the broader economy has historically weakened financial health for vulnerable households. We study progress, although modest, in the closing of racial income gaps when labor markets are tight and in the COVID era of strengthened safety nets. After controlling for observable household characteristics, Black and Hispanic income growth improved even more so than White households, though far from levels that achieve income parity, as the unemployment rate fell in the pre-COVID economic expansion. Subsequent extensions of those relative gains for Black and Hispanic households have come through the joint effects of government transfers and the extraordinary pace of the recovery of the labor market.
The findings suggest that monetary policy aimed at maintaining a tight labor market can have the intended redistributive effect, although the pace of income convergence may be slow. The forces that have supported higher growth for Black and Hispanic households in recent years mainly took place in a period of low inflation (pre-pandemic) and elevated fiscal supports (during COVID). Both factors seem unlikely to persist. High inflation carries potential negative consequences for households with lower wealth, who have more difficulty insulating themselves from rising costs. Additionally, anticipated reductions in fiscal deficits implies that robust safety net supports seen around the onset of the pandemic may be less likely in the near future.10 The salient cause for optimism is the currently tight labor market, which appears to be continuing to yield income gains for Black and Hispanic households despite experiencing higher unemployment rates than White households.
The preservation of recent income redistribution may depend on the Fed’s ability to deftly balance restraining inflation against causing a recession. Limited capacity of monetary and fiscal authorities to help close the racial income gap in the present environment calls attention to the need for structural reforms and policies. These could include reforms to make higher education more affordable for Black and Hispanic individuals, improve job security and training, reduce labor market discrimination and other barriers to employment (e.g. second chance hiring), and expand eligibility to Unemployment Insurance. These policies remain important parts of the policy toolkit to reduce not only the effects of recessions, which disproportionately affect Black and Hispanic workers’ incomes, but also racial gaps in income that persist even in the best of economic times.
See “Disparities in Wealth by Race and Ethnicity in the 2019 Survey of Consumer Finances” (Bhutta et al. 2020).
Self-identified demographic data was obtained in 2021 from a third party for the JPMorgan Chase Institute to conduct economic research examining financial outcomes by race, ethnicity, and gender. The demographic data was matched to internal banking records using encrypted quasi-identifiers. This de-identified file that contains banking records and demographics is only available to the JPMorgan Chase Institute.
To accurately capture relevant income for households with volatile month-to-month inflow streams, we compute 24-month moving averages for account inflows, after excluding transfers from other accounts like savings or investments. The 2-year change in this moving average defines an individual’s growth rate. Growth rates are converted to real terms by deflating nominal growth by the Personal Consumption Expenditures price index (FRED Ticker: PCEPI).
Methodology note: We compute the median value of real income growth using a quantile regression with dummy variables for each race and controls for income level, age, and urbanicity. We use common non-race characteristics for each predicted value. The income variable is total checking account inflows excluding transfers from other accounts.
Prior Institute research and public surveys indicate that Black and Hispanic households with the same incomes as White households have substantially lower wealth indicators, on average.
The headline Average Hourly Earnings growth rate has been negative in year-on-year terms, with composition changes in the employed population playing a role. The year-over-year growth rate in average hourly earnings as of December 2021 was 4.9 percent (FRED ticker: CES0500000003) versus a rise in the price index for personal consumption expenditures (PCE) of 5.8 percent (FRED ticker: PCEPI).
We estimate growth rates on a within-person basis using checking account inflows after excluding transfers vis-à-vis other accounts. This means that our estimated growth rates are likely biased higher than aggregate income growth, due to the tendency for workers’ incomes to rise over most of their working lives. That is, we’re capturing both economic growth and “life-cycle” effects.
As in all figures in this piece, we deflate cash flows by the value of the price index for personal consumption expenditures. Estimates show differences by race after controlling for age and income level gaps.
Due to sizable composition shifts early in the sample, namely 2010, we start the measure in 4a after those effects subsided. Figure 4b uses a within-household growth perspective and is less influenced by sample composition changes.
The Congressional Budget Office’s baseline projection shows budget deficits of about $3 trillion in 2020 and 2021 shrinking to about $1 trillion this year.
U.S. Census Bureau; Income and Poverty in the United States: 2020, Table A-2; generated by JPMorgan Chase Institute.
We thank our research team, in particular, Karmen Hutchinson, for her hard work and contributions to this research. We also thank Anthony Rivera, Emily Rapp, Sarah Kuehl, and Preeti Vaidya for their support. We are indebted to our internal partners and colleagues, who support delivery of our agenda in a myriad of ways and acknowledge their contributions to each and all releases.
We would like to acknowledge Jamie Dimon, CEO of JPMorgan Chase & Co., for his vision and leadership in establishing the Institute and enabling the ongoing research agenda. We remain deeply grateful to Peter Scher, Vice Chairman, Demetrios Marantis, Head of Corporate Responsibility, Heather Higginbottom, Head of Research & Policy, and others across the firm for the resources and support to pioneer a new approach to contribute to global economic analysis and insight.
This material is a product of JPMorgan Chase Institute and is provided to you solely for general information purposes. Unless otherwise specifically stated, any views or opinions expressed herein are solely those of the authors listed and may differ from the views and opinions expressed by J.P. Morgan Securities LLC (JPMS) Research Department or other departments or divisions of JPMorgan Chase & Co. or its affiliates. This material is not a product of the Research Department of JPMS. Information has been obtained from sources believed to be reliable, but JPMorgan Chase & Co. or its affiliates and/or subsidiaries (collectively J.P. Morgan) do not warrant its completeness or accuracy. Opinions and estimates constitute our judgment as of the date of this material and are subject to change without notice. No representation or warranty should be made with regard to any computations, graphs, tables, diagrams or commentary in this material, which is provided for illustration/reference purposes only. The data relied on for this report are based on past transactions and may not be indicative of future results. J.P. Morgan assumes no duty to update any information in this material in the event that such information changes. The opinion herein should not be construed as an individual recommendation for any particular client and is not intended as advice or recommendations of particular securities, financial instruments, or strategies for a particular client. This material does not constitute a solicitation or offer in any jurisdiction where such a solicitation is unlawful.
Greig, Fiona, and George Eckerd. 2022. “Racial Income Inequality Dynamics: Big Data Insights from 2013 through COVID-19.” JPMorgan Chase Institute. https://www.jpmorganchase.com/insights/financial-health-wealth-creation/racial-income-inequality-dynamics
Authors

Fiona Greig
Former Co-President

George Eckerd
Wealth and Markets Research Director, JPMorganChase Institute