Research

Tracking international payments:
How are midsize firms responding to continued tariff pressure?

September 2, 2026

We examine how midsize1 U.S. firms are responding to a volatile tariff environment from early 2025 through mid-2026 in a new report, using payment flows to track (1) tariff payments and (2) payments sent to U.S. (domestic outflows) vs. foreign (international outflows) counterparties.

This page provides a summary of key insights (5 min read). You can read the full report with additional figures and methodologies here.

Key findings

  1. Tariff payments by midsize firms have decreased somewhat from their peak in October 2025 but remain over twice their pre-2025 levels.
  2. Since 2025, international payments by midsize firms have grown more slowly than domestic ones, with a persistent gap of 6-12 percentage points.
  3. Tariffs have increased for every industry, and several manufacturing industries now spend over 2 percent of total inflows on tariff payments.
  4. Tariffs are highest in major port regions, but the largest relative increases in tariff payments have been in the Midwest and Southeast.

International outflows have increased slightly since late 2025 but remain below the trend of domestic outflows.
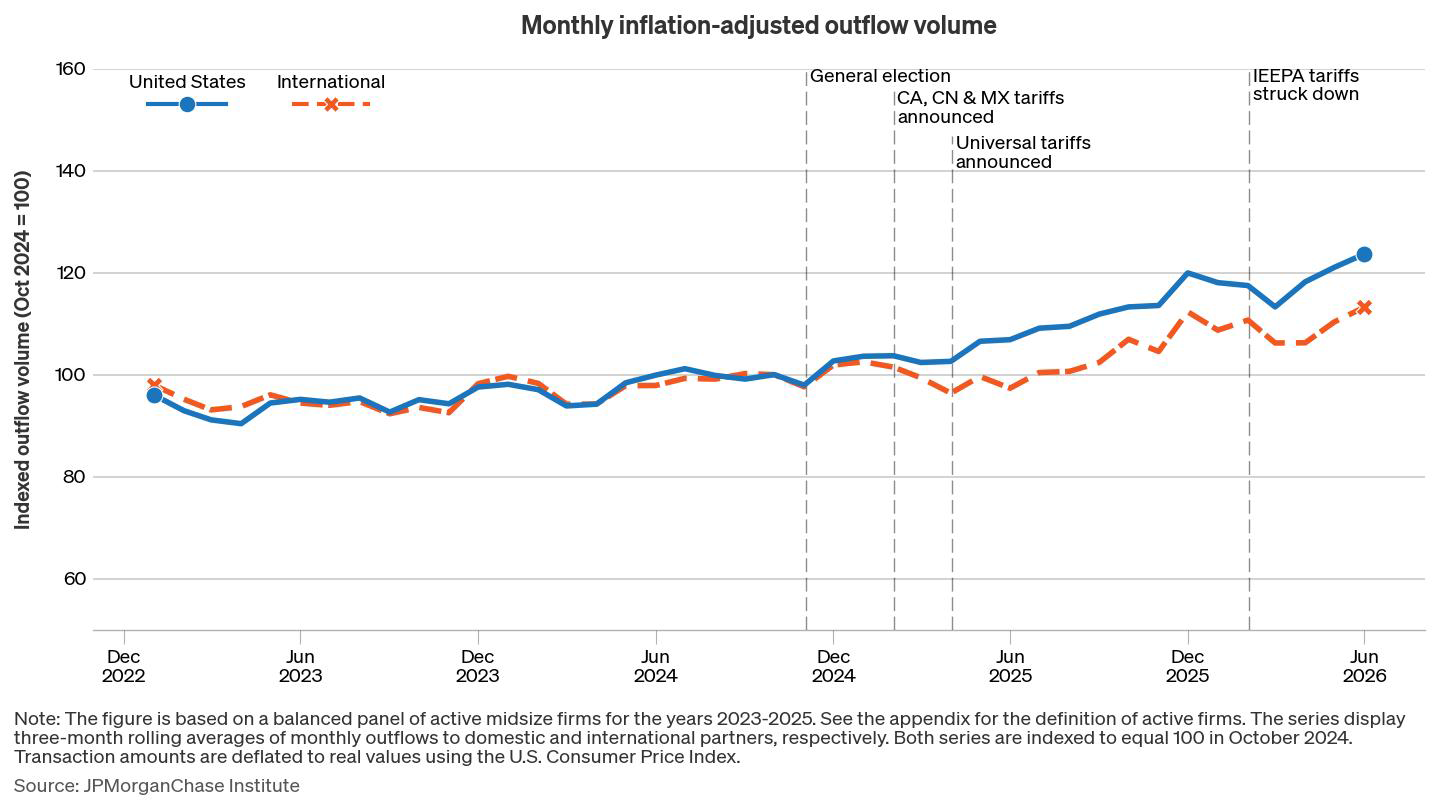

Figure: International outflows have increased slightly since late 2025 but remain below the trend of domestic outflows:

A line plot displaying monthly outflow volume for midsize firms from January 2023 through June 2026. The horizontal axis represents time with labeled intervals, and the vertical axis shows indexed outflow volume ranging from approximately 60 to 160, with October 2024 set as the baseline index value of 100. Two lines track outflow patterns: a solid blue line representing outflows to the United States, and a dashed orange line representing international outflows.

Four key policy events are marked with vertical dashed gray lines: the general election occurring in November 2024, the announcement of tariffs on Canada, China and Mexico in February 2025, the announcement of universal tariffs in April 2025, and the strikedown of IEEPA tariffs by the U.S. Supreme Court in February 2026.

The line representing domestic outflows (solid blue) fluctuates within a relatively stable range between 90 and 102 throughout 2023 and most of 2024. Following the U.S. general election, the line displays steady growth until December 2025 when it reaches a value of 120. In the first months of 2026, the upward trend stops and the trend instead shows a slight decline, but this reverses in April, when the line starts to increase, ultimately reaching a value of 123.6 in June 2026.

The international line (dashed orange) starts at 98 in January 2023 and initially lies close to the line for domestic outflows, fluctuating between 92 and 101 throughout most of 2023 and 2024. After the 2024 general election, the international outflows series initially increases slightly, but dips again somewhat after the initial tariffs on Canada, China and Mexico are announced, creating a wedge between this line and the somewhat higher domestic outflows, which persists throughout the rest of the series. After April 2025, international outflows again begin to increase in parallel with the domestic outflows series, and by December 2025, they reach a value of 112. Similarly to domestic outflows, the index value for international outflows dips slightly in early 2026, but again increases to a value of 113 in June 2026, roughly a 10 percentage point gap to the domestic index values.

The figure is based on a balanced sample of midsize firms that are active the years 2023-2025, with the series displaying three-month rolling averages of monthly outflows to domestic and international partners. Both series are adjusted for inflation using the U.S. Consumer Price Index.

Source: JPMorganChase Institute.

International outflows have grown less than domestic ones since late 2025, with a persistent gap of roughly 6-12 percentage points. That relative stability despite material swings in tariff rates is notable and may in part reflect policy uncertainty that inhibits decisions about overseas supplier relationships or import timing delays.
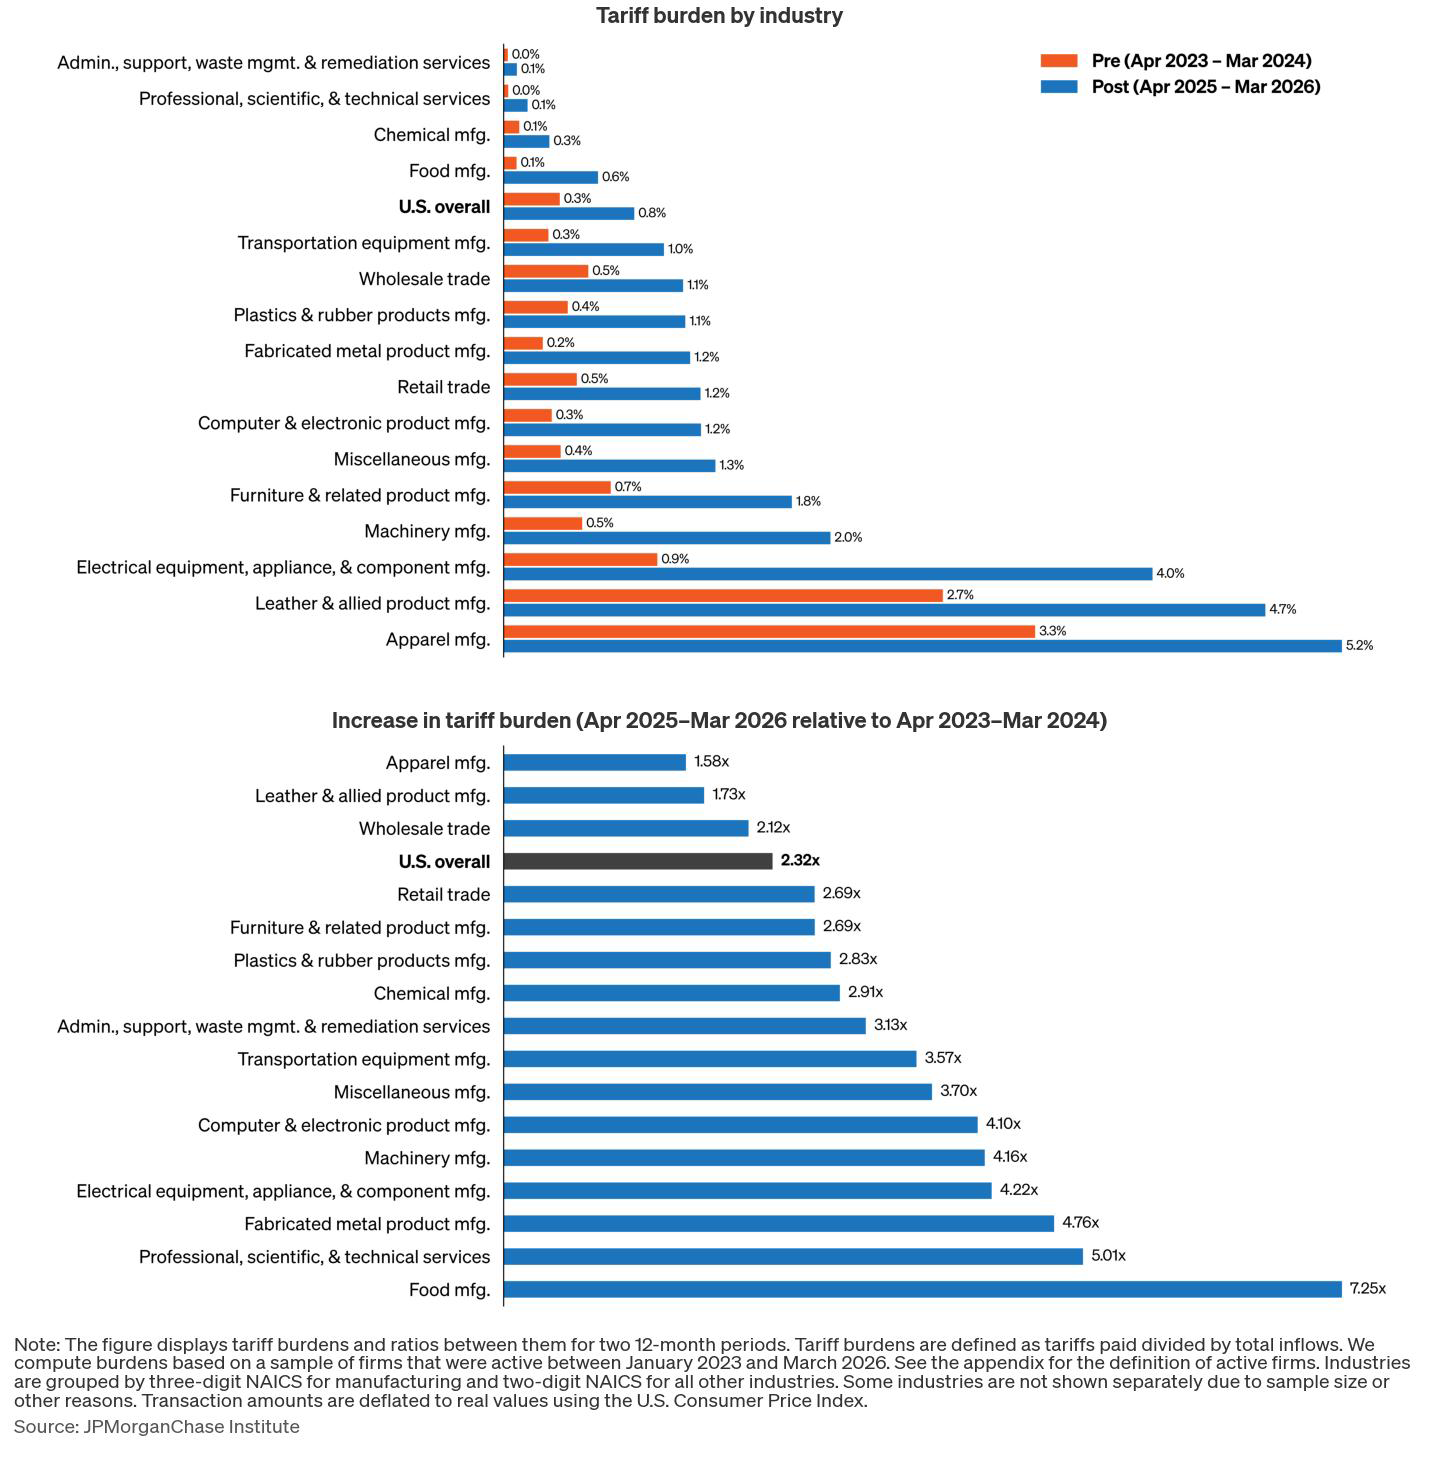
The share of inflows spent on tariffs grew the most in sectors with high baseline tariffs, but low-tariff industries have seen large relative growth.

Figure: The share of inflows spent on tariffs grew the most in sectors with high baseline tariffs, but low-tariff industries have seen large relative growth.

Tariff burden for different industries in the pre-2025 period (April 2023 – March 2024), the post-2025 period (April 2025 – March 2026), and the ratio between them.

Industry

Pre-2025

Post-2025

Ratio

Admin., support, waste mgmt. & remediation services

0.03%

0.08%

3.13

Professional, scientific, & technical services

0.03%

0.15%

5.01

Chemical mfg.

0.10%

0.28%

2.91

Food mfg.

0.08%

0.58%

7.25

U.S. overall

0.35%

0.81%

2.32

Transportation equipment mfg.

0.28%

0.99%

3.57

Wholesale trade

0.52%

1.11%

2.12

Plastics & rubber products mfg.

0.40%

1.12%

2.83

Fabricated metal product mfg.

0.24%

1.15%

4.76

Retail trade

0.45%

1.21%

2.69

Computer & electronic product mfg.

0.30%

1.22%

4.1

Miscellaneous mfg.

0.35%

1.31%

3.7

Furniture & related product mfg.

0.66%

1.78%

2.69

Machinery mfg.

0.48%

2.01%

4.16

Electrical equipment, appliance, & component mfg.

0.95%

4.00%

4.22

Leather & allied product mfg.

2.71%

4.69%

1.73

Apparel mfg.

3.28%

5.17%

1.58

Tariff burdendefined as the share of total inflows that firms spend on tariffs—falls unevenly across the economy. As shown above, across our full U.S. sample it rose by 2.32x to 0.8 percent post-2025, but that average masks a stark concentration in manufacturing: apparel and leather goods manufacturing face tariff burdens of roughly 5 percent of inflows, machinery and electrical equipment more than 2 percent, and food manufacturing saw the largest relative jump—more than 7x.
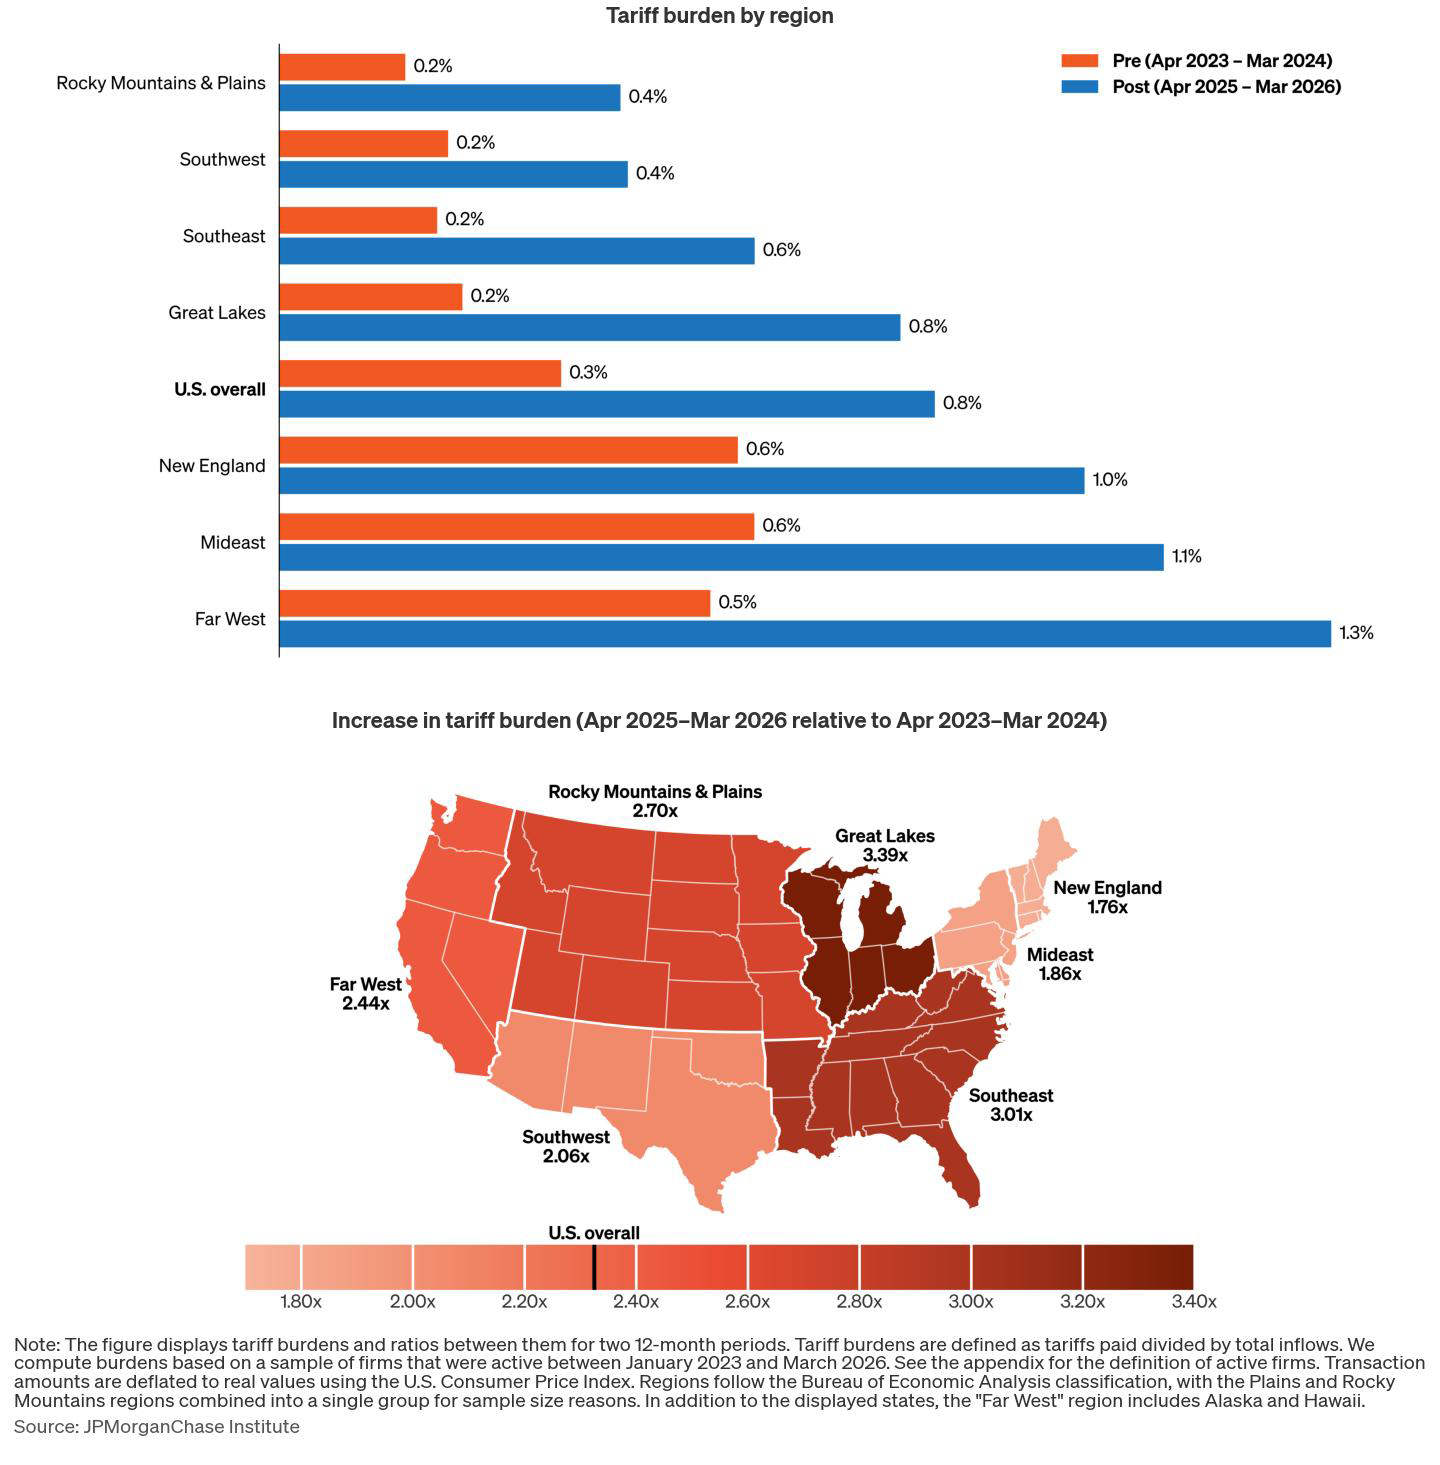
Major port regions spend the highest share of inflows on tariffs, but the largest relative increases are in the Midwest and the Southeast.

Figure: Major port regions spend the highest share of inflows on tariffs, but the largest relative increases are in the Midwest and the Southeast.

Tariff burden for different U.S. regions in the pre-2025 period (April 2023 – March 2024), the post-2025 period (April 2025 – March 2026), and the ratio between them.

Region

Pre-2025

Post-2025

Ratio

Rocky Mountains and Plains:

Montana, Idaho, Wyoming, Utah, Colorado, North Dakota, South Dakota, Nebraska, Kansas, Minnesota, Iowa, Missouri

0.16%

0.42%

2.7

Southwest:

Texas, Oklahoma, New Mexico, Arizona

0.21%

0.43%

2.06

Southeast:

Kentucky, Tennessee, Mississippi, Alabama, Arkansas, Louisiana, Florida, Georgia, South Carolina, North Carolina, Virginia, West Virginia

0.19%

0.58%

3.01

Great Lakes:

Wisconsin, Illinois, Indiana, Michigan, Ohio

0.23%

0.76%

3.39

U.S. Overall

0.35%

0.81%

2.32

New England:

Connecticut, Rhode Island, Massachusetts, Vermont, New Hampshire, Maine

0.56%

0.99%

1.76

Mideast:

Pennsylvania, New Jersey, New York, Delaware, Maryland, District of Columbia

0.58%

1.09%

1.86

Far West:

Washington, Oregon, California, Nevada, Alaska, Hawaii

0.53%

1.29%

2.44

Source: JPMorganChase Institute.

Relative tariff burden increases have been most pronounced in parts of the American heartland – more than tripling in the Southeast and Great Lakes regions – even though the absolute burdens remain highest in the Northeast and on the West Coast. Firms facing higher tariff burdens could respond by changing their supplier networks, which could generate both risks and opportunities for regional economic development.

Read our full analysis with additional figures and methodologies here.

Footnotes

1.

Firms with roughly $10 million to $1 billion in revenue or 50 to 499 employees.

Authors

Chris Wheat

Chris Wheat

President, JPMorganChase Institute

Chi Mac

Chi Mac

Business Research Director

Ole Agersnap

Ole Agersnap

Middle Market Business Research Lead

Media Contact

Shelby Wagenseller, 
Shelby.Wagenseller@jpmchase.com