
Figure 1: Business closures increased in 2022, as government support ceased, and inflation escalated.

Creating thriving communities together
See how our clients and partners—from small business owners to workforce training leaders—work with JPMorganChase to drive meaningful impact and economic growth where they live and work.
Learn moreLatest news

Veteran’s Unconventional Path to Landing her Dream Job in Tech
U.S. Army Veteran Ashley Wigfall transitioned to a civilian role and charted her path to technologist through mentorship and skills training at the JPMorgan Chase tech hub in Plano, Texas.
Learn more
Research
July 28, 2025
Five years have passed since the onset of the COVID-19 pandemic, a crisis that led to an unprecedented level of government support for the economy. This unique event can serve as a case study of policy responses in times of crisis, with potential lessons to help inform policy interventions during other times of economic distress, such as recessions or natural disasters.
Small businesses are particularly vulnerable to economic shocks, as the typical firm’s cash reserves can cover average outflows for about two weeks in the event of a complete disruption to inflows (Farrell, Wheat and Grandet 2019). In response to the COVID-19 pandemic, the U.S. government implemented swift and broad-based support to provide liquidity and help stabilize the economy. These interventions were aimed at addressing market failures that hindered solvent firms from obtaining credit during negative economic shocks and preventing negative externalities from business closures and layoffs.
This report addresses the critical need to understand the choices in policy interventions to support small businesses by examining their experiences during the COVID-19 pandemic and the subsequent period. By leveraging a unique dataset of de-identified small businesses with Chase Business Banking deposit accounts active in 2019, this study tracks their financial trajectories during the pandemic through the end of 2024, while considering the complexities involved in policy design. The report provides insights into the effectiveness of government interventions and illustrates the varied recovery paths of small businesses across different industries and regions.
The findings reveal that, while government support helped many small businesses survive the initial impact of the pandemic, it may have also allocated policy resources to supporting otherwise unviable companies, as well as those that did not need the support. This underscores the importance of designing targeted policy interventions that can be rapidly deployed during crises, ensuring that support reaches the most vulnerable sectors and communities. However, when targeted policies are not feasible and broad-based support is the only available option, policies should incorporate flexibility in dictating how small businesses use the funds, while ensuring accountability to prevent the provision of unrestricted funds that could lead to market inefficiencies.
Key findings
In the face of major negative shocks such as recessions, disasters, or pandemics, policymakers must decide whether and how to support small businesses. These supports reflect the variety of roles small businesses play in the economy. Some are community businesses that are an important source of local employment and provide vital local services not easily replaceable if they close. Others may be nascent innovators, whose loss could impede future economic growth. Policymakers must balance such considerations with the competing goal of fiscal responsibility. The COVID-19 pandemic offered an important lesson on the trade-offs in policy decisions, providing a roadmap for how government responses can be optimized to manage future economic crises effectively.
Economic rationale for intervention. According to economic theory, in a frictionless world, there would be no rationale for government intervention, as market forces would allocate resources efficiently. However, there are instances where market failures can lead to deviations from this outcome, particularly during periods of significant economic distress. First, market forces could fail to induce private lenders to provide sufficient credit to solvent firms to survive temporary downturns.1 Second, firms may not account for the wider consequences of letting employees go or shutting down, which can negatively affect the community and economy.2 Government support to businesses may be justified to address these challenges.
Once the rationale for government intervention is established—to help correct market failures from financial frictions and externalities—the question becomes how to design it effectively. One key dimension to consider is whether support should be direct (e.g., grants or forgivable loans to firms) or indirect (e.g., capital injections into banks). Direct support can reach small businesses quickly, especially in times of acute disruption, but it also risks misallocation, higher fiscal costs, and moral hazard.3 Indirect support channeled through financial institutions may preserve market discipline and leverage credit screening capacity but can be slower to reach end borrowers and less responsive to firms in need, particularly when banks face their own balance sheet concerns.4
A second important dimension is whether support should be broad-based or targeted. Broad-based programs can ensure speed and wide coverage during systemic shocks but may funnel resources to firms that do not need them. Targeted support, especially toward sectors with high social value or innovation potential, can improve efficiency but may be harder to implement quickly and effectively. The optimal mix depends on the type of economic shock and the policy goal. Stabilizing the economy quickly may call for broad and direct support, while longer-term recovery or restructuring may benefit from more selective and market-mediated approaches.
From theory to practice: economic responses to COVID-19 pandemic. The COVID-19 pandemic serves as a unique case to study the optimal policy responses in times of crisis. This event was characterized by its widespread impact, high level of uncertainty, with varying degrees of exposure and duration for different businesses, and interacting government restrictions. In response, the federal government implemented unprecedented direct support for businesses. Interventions were driven by the need to address financial frictions that could prevent solvent firms from accessing necessary short-term liquidity and to mitigate the negative externalities resulting from potential employee layoffs and firm failures.5 However, the broad-based and direct disbursement of government support involved significant trade-offs. On one hand, support may have extended the survival of small businesses that were not viable before the crisis, sustaining them through government aid.6 This underscores the difficulty of prioritizing between firms ex ante. On the other hand, the swift direct rollout of support programs may have helped prevent the economy from spiraling into a deeper recession driven by negative externalities from firm failures or employee layoffs. Despite the trade-offs, the urgency of intervention seemed to outweigh the potential risk of inefficiencies.
We analyzed small business outcomes during and after the pandemic within the context of these trade-offs, balancing the need for broad and rapid intervention against the risk of inefficiencies. We leveraged a unique dataset of de-identified small businesses using Chase Business Banking deposit accounts that were active in 2019 and followed them through 2024, identifying critical lessons that can inform trade-offs in policy decisions. Understanding both the successes and shortcomings of these policies from an efficiency point of view can provide insights that inform the crafting of policies to better support small businesses during future crises. The findings highlight key patterns in business survival, revenue recovery and cash management, as well as industry and geographical differential recovery paths.
Most small businesses survived the pandemic, with government support possibly delaying some business closures until 2022.
At the onset of the pandemic, local restrictions affected whether and how businesses could operate. Policymakers were particularly concerned about the survival of small businesses, and early research on the initial impact of the pandemic indicated a significant negative effect with substantial temporary business closures (Fairlie 2020). Small businesses often lack the financial liquidity to withstand a prolonged period of distress: the median small firm’s cash reserves can cover average outflows for about two weeks in the event of a complete disruption to inflows (Farrell, Wheat and Grandet 2019). Government support programs, including the Paycheck Protection Program (PPP) and Economic Injury Disaster Loan (EIDL) advances, provided liquidity swiftly.7, 8 While government support programs may have helped many businesses stay open in 2020 and 2021, our data shows a sharp rise in business closures by 2022, coinciding with the end of the government support programs, suggesting that some exits may have been delayed rather than avoided.
Small businesses may find it difficult to operate during challenging economic conditions. Exit rates typically decrease with firm age and cash liquidity, which can help businesses withstand downturns. Historically, the median life expectancy for small businesses has hovered around five years in the JPMorganChase small business sample, with some variation by industry (Farrell, Wheat and Mac 2018).
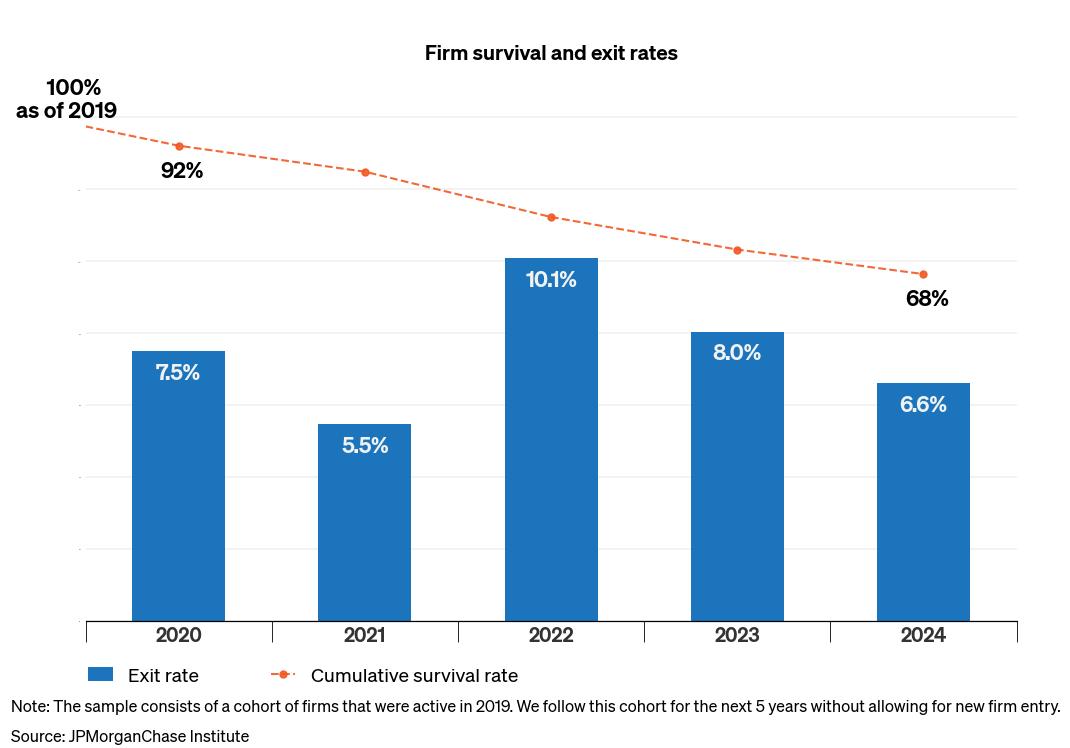
Figure 1: Business closures increased in 2022, as government support ceased, and inflation escalated.
Figure 1 details the cumulative survival rate of the 2019 cohort of firms through 2024, as well as the marginal exit rate in each year. By the end of 2024, 68 percent of the firms remained in business. In 2020 and 2021, the exit rate was 7.5 and 5.5 percent, respectively, before increasing to 10.1 percent in 2022. Firms in the cohort had a median age of four years in 2019. Prior research found that about 9 percent of small businesses in their fourth year exited before their fifth, suggesting lower than expected exit rates in 2020 (Farrell, Wheat and Mac 2020b).9 Exit rates typically decrease as firms age (Farrell, Wheat and Mac 2018), so the increased exit rate in 2022 is unusual.10
The lower exit rates in 2020 and 2021, followed by an increase in 2022, suggest that government support, which ended in 2021, provided the liquidity needed to keep many businesses afloat during a time of significant economic uncertainty. However, this aid could have also delayed some business exits that might have otherwise occurred even without a pandemic.11 This scenario could reflect the trade-offs discussed earlier, where the direct and broad-based nature of the support might have inadvertently sustained firms that would have closed under normal market conditions.
While this outcome could be seen as a distortionary effect of the policy, it might represent a trade-off that policymakers considered. By opting for a wide-reaching and direct approach, they may have aimed to address financial frictions that could prevent otherwise solvent firms from accessing the liquidity they needed to survive. The decision to implement broad-based support could have been made within the context of an urgent need to stabilize the economy and protect these firms from closing and the related potential negative externalities. One of the biggest concerns for policymakers was that extended job loss caused by the lockdown was generating long-term costs for individuals, businesses, and the economy (Rouse 2024). The government support provided to small businesses during the COVID-19 crisis differed significantly from the assistance offered during the Global Financial Crisis (GFC), where relief efforts were more focused on stabilizing the financial system.12 Business closures as a result of the GFC were more closely tied to financial constraints, reduced consumer spending, and credit availability issues, affecting a broader range of industries over a prolonged period (Kennickell et al. 2017).
The subsequent increase in exit rates in 2022 may reflect a recalibration to the usual small business churn rate, as less competitive firms exited the market. Ultimately, the trade-off between direct broad-based support and potential inefficiencies could have been a calculated decision aimed at preserving the broader economic landscape during an unprecedented crisis.
Nominal small business revenues recovered in 2021, while cash balances remained elevated until the end of 2023.
Following the initial economic disruption caused by the COVID-19 pandemic, small businesses experienced a notable recovery in nominal revenues in 2021. This rebound may reflect the resilience of small businesses and the role of government support measures in helping stabilize the economic environment.
Figure 2: While nominal revenues recovered in 2021, inflation eroded their real values.
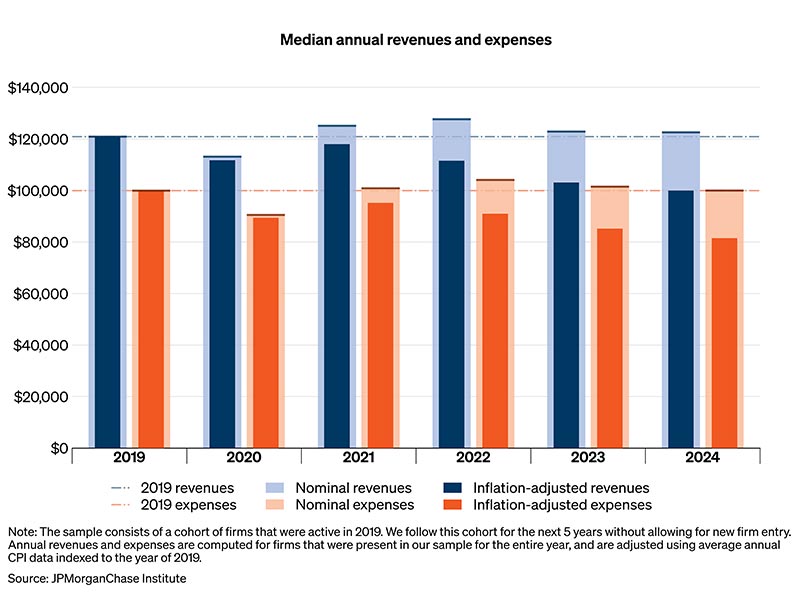
Figure 2 shows the 2019 cohort’s median annual revenues and expenses through 2024. Nominal and real revenues13 declined at the onset of the pandemic, from $120,000 in 2019 to $111,000 in 2020, about an 8 percent decrease.14 As COVID-19 restrictions lifted, median revenue recovered in nominal terms starting in 2021. Small businesses may have also benefited from the direct, broad-based, and rapid deployment of government support to households through Economic Impact Payments and extended unemployment insurance, which mitigated the risk of negative externalities from declining aggregate demand. In subsequent years, median revenue slightly declined and stabilized around 2019 values in nominal terms.15 However, increasing inflation eroded the real values. During this period, median annual expenses moved in concert with changes in revenues, suggesting that firms were able to manage their expenses even as their revenues did not keep up with inflation.
While nominal revenues recovered in 2021, small businesses continued to hold unusually high cash reserves, which may have reflected ongoing uncertainty or revealed an excess of government support. Small businesses often accumulate cash balances during periods of uncertainty, mostly by reducing expenses, to manage cash flow effectively (Wheat and Mac 2023). This is especially critical as small businesses often face challenges in accessing external capital.16 During the early months of the pandemic, the typical small business saw substantial cash liquidity declines (Farrell, Wheat and Mac 2020a). However, in subsequent months of 2020, cash balances increased and remained at levels substantially higher than they were prior to the pandemic due to arrival of aid from federal programs including, but not limited to, the PPP and other CARES Act programs (Farrell, Wheat and Mac 2020c).
Figure 3: Median firm cash balances remained elevated until the end of 2023 and then normalized.
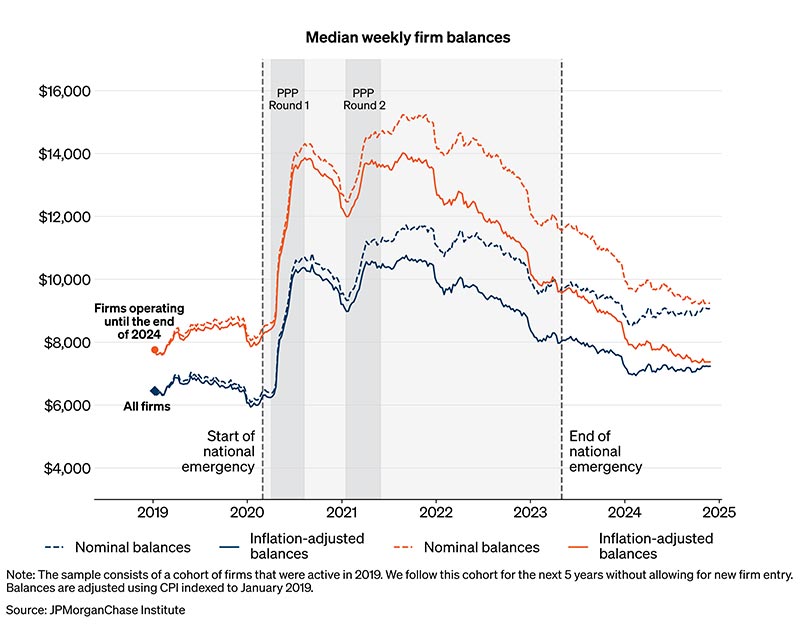
Figure 3 plots the trend in median cash balances for the entire 2019 cohort of small businesses from 2019 to 2024 and for the subsample that survived through 2024. The chart shows noticeable spikes in median cash balances during April–August 2020 and January–March 2021, corresponding to the disbursement of the two rounds of the PPP. The PPP was intended to support small business expenses for an 8-week period, later revised to 24-week period (U.S. Department of the Treasury 2020). However, cash balances remained elevated until the end of 2023.17
From a policy perspective, the sustained elevated cash balances until the end of 2023, coupled with recovering median nominal revenues in 2021, suggest that government support may have not been fully utilized or needed by small businesses. This situation may reflect the trade-offs inherent in the policy response. Broad-based government support might have been unnecessary by 2021 when median nominal revenues returned to 2019 levels, allowing businesses to finance their expenses independently. However, not all small businesses had recovered by 2021, as we illustrate in Finding 3. This highlights the challenge of designing support that effectively targets the diverse needs of firms. The broad-based nature of the policy may have led to support small businesses that did not require it, underscoring the difficulty of distinguishing, ex-ante, between firms that are more resilient and those that are more vulnerable. This trade-off between rapid, widespread intervention and the risk of inefficiencies is a recurring theme in the policy response.
Additionally, businesses might have maintained higher precautionary savings due to economic uncertainty or concerns about loan repayment, reflecting firm behavior rather than policy design.18 This explanation may suggest that even with generous support, firms prioritized financial liquidity in an uncertain environment.
Median cash balances began to decline at the end of 2021, aligning with the end of government support programs and rising inflation, with the latter widening the gap between real and nominal values. By 2024, firms appeared to maintain inflation-adjusted cash holdings slightly higher than pre-pandemic levels. However, this trend was driven by surviving firms: firms that survived through 2024 had higher median balances in 2019 than the overall sample, as shown in Figure 3.
Revenue recovery was not uniform across sectors and years: Restaurants rebounded in 2021 after being hit hard in 2020, while transportation and warehousing boomed in 2020 and later declined.
Median nominal revenues recovered in 2021, but recovery was not uniform across all sectors. While some industries quickly returned to pre-pandemic revenue levels, at least in nominal terms, others continued to face challenges due to ongoing supply chain disruptions, inflationary pressure, and shifts in consumer behavior. For instance, restaurants, personal care services, and non-grocery retail were among the most impacted during the onset (Farrell, Wheat and Mac 2020b). During subsequent years, small businesses in some industries recovered more than others, although inflation eroded gains across all industries.
Figure 4: Revenues in some industries, such as restaurants, initially rebounded in 2021 and then stabilized.

Figure 4 shows the median annual nominal revenues relative to 2019 levels across a selection of industries. Industries reliant on in-person interactions—arts and entertainment, restaurants, and accommodation—experienced larger revenue declines in 2020, likely due to initial lockdowns and social distancing measures.19 However, these industries were able to rebound in 2021 as COVID-19 restrictions were lifted and government support was deployed. For instance, median annual revenue for restaurants bounced back in 2021 to 113 percent of their 2019 levels and then stabilized.
Transportation and warehousing present an interesting case study as the only industry in which most firms avoided revenue losses from the onset of the pandemic. Revenues increased in 2020 and 2021, potentially driven by e-commerce and the rise of online retailers.20 Although demand began to wane after the pandemic, the availability of inexpensive SBA credit enabled firms in this industry to endure, resulting in plummeting freight rates (Hampstead 2024). This case study serves as a cautionary tale for policymakers, emphasizing that while government interventions can provide necessary liquidity, they may also lead to market distortions by sustaining firms beyond their natural demand cycles.
Other industries, such as accommodation, real estate, and retail trade, still lagged behind at the end of 2024 compared to their 2019 levels.
Small businesses in some cities were hit harder than others at the onset of the pandemic, but revenues in most cities have struggled to compensate for increased inflation in recent years.
The recovery trajectory of small businesses across metro areas over the past five years underscores significant disparities, reflecting the complex interplay of local economic conditions and the effectiveness of federal policy interventions. While businesses in some cities managed to generate revenues similar to pre-pandemic levels, others continue to grapple with persistent financial challenges.
Figure 5: Across cities, 2024 revenues varied widely relative to 2019 levels.
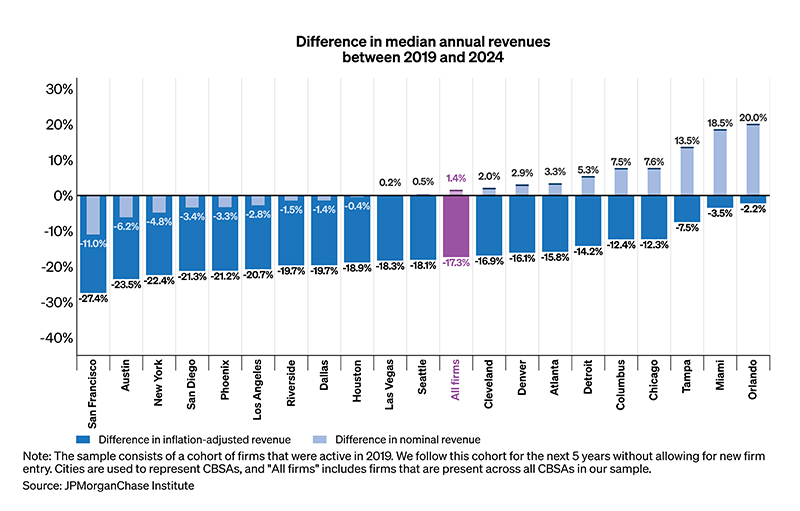
Figure 5 shows how median firm revenues in 2024 compared to 2019 levels across cities.21 The difference in median nominal revenue was positive in some cities, such as Orlando, where 2024 median nominal revenues were 20 percent higher than in 2019, and negative in others, such as San Francisco, where 2024 median nominal revenues were 11 percent lower than in 2019. These variations highlight the differential impact of the pandemic and subsequent recovery efforts across urban landscapes. The difference in median real revenue was negative across all cities, highlighting the role of inflation in recent years.
Overall, cities experienced a range of outcomes at the onset of the pandemic (Farrell, Wheat and Mac 2020a), and most have struggled with similar economic conditions in subsequent years.
During the COVID-19 pandemic, the rapid deployment of broad-based support provided crucial liquidity in a period of high uncertainty, potentially protecting small businesses, such as community businesses and nascent innovators. However, broad-based and direct support can entail trade-offs, such as sustaining firms that might not survive otherwise and challenges in targeting aid effectively. While the intervention was sufficient to prevent the economy from spiraling into a deep recession, whether the trade-offs in efficiency were warranted is debatable. This inefficiency was partly due to the urgency with which the government sought to disburse funds.
Our analysis of the challenges small businesses faced during and after the COVID-19 pandemic offer lessons to policymakers about how firms may react to future negative shocks. Businesses endure financial pressures as they recover and must adapt to rapidly changing market conditions. As policymakers consider how to support small businesses after other major negative shocks, we offer two key implications:
To study the long-term impact of policy interventions during the COVID-19 pandemic on small businesses, we created a sample of de-identified small businesses that have Chase Business Banking deposit accounts and were active in 2019. Since we focus on small business outcomes during and after the pandemic, we do not include any firm created after 2019. For a firm to be considered active in a year, it must have at least 10 transactions and $500 in outflows for a minimum of three months within that year. Additionally, each firm is limited to no more than three business deposit accounts in 2019 and must have no more than one location identified during that year. However, we allow for the possibility of firms having more than three accounts and multiple locations in the years following 2019. This approach ensures a consistent baseline while accommodating growth and changes in business structure over time. With these restrictions, our sample included over one million small businesses from 2019 to 2024.
Firms included in our sample operate in one of the fifteen industries characteristic of the small business sector: professional services (e.g., lawyers, accountants, consultants, marketing, media, and design, education); construction; other services; real estate, rental and leasing; retail trade; health care and social services; transportation and warehousing; administrative services; food services and drinking places (e.g., restaurants); wholesale trade; manufacturing; arts, entertainment, and recreation; information (e.g., independent film production companies, local radio stations, local data backup data services, and independent research data firms); and accommodation. Industries were identified using the 2-digit NAICS code, with the exception of restaurants and accommodation, which were identified using the 3-digit NAICS code.
Table A1: Sample characteristics, by industry
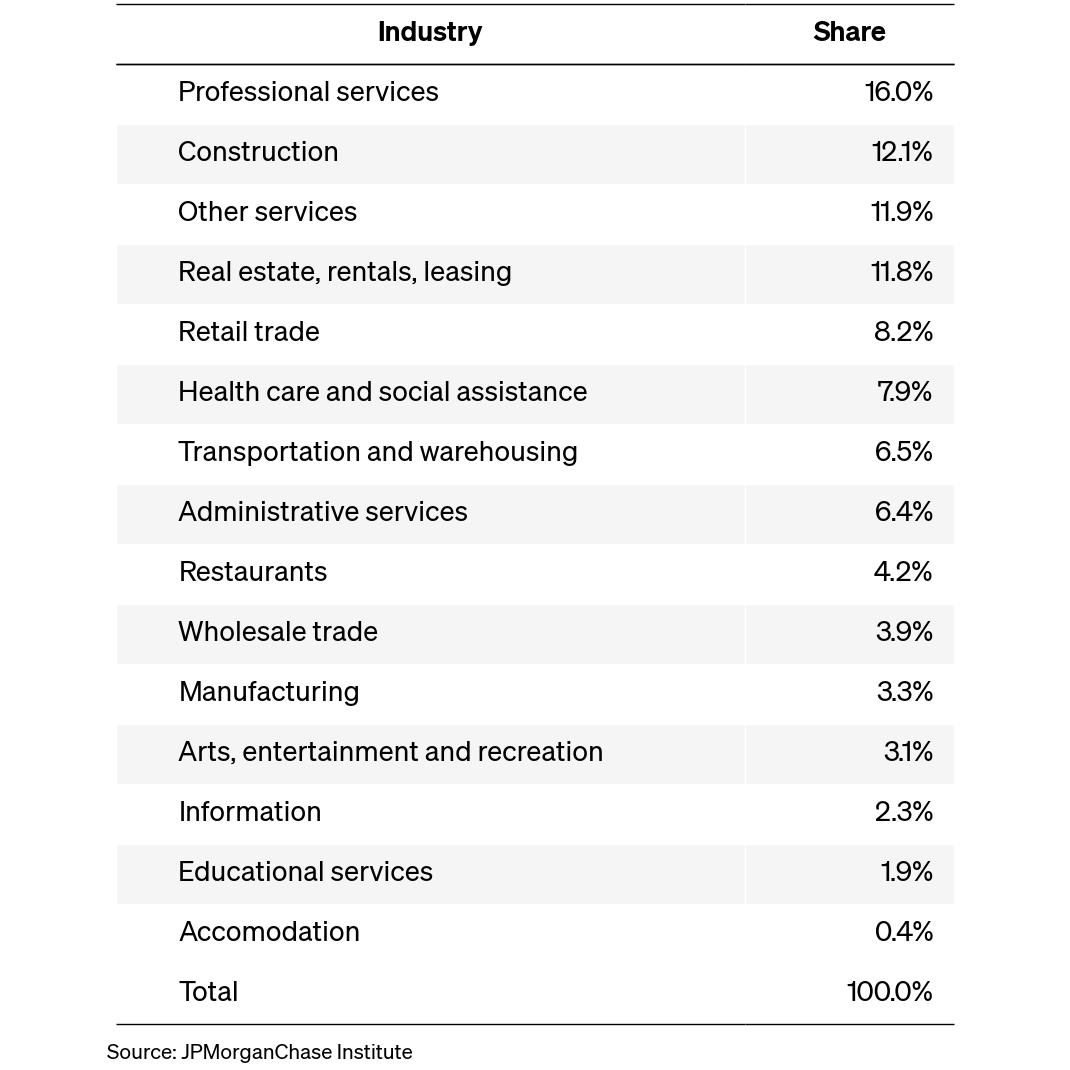
Table A1 provides the industry distribution within our sample for 2019. Professional services represent the largest share of the sample at 16 percent, while accommodation accounts for the smallest share at 0.4 percent.
Figure A1: Inflation increased starting from mid-2021.
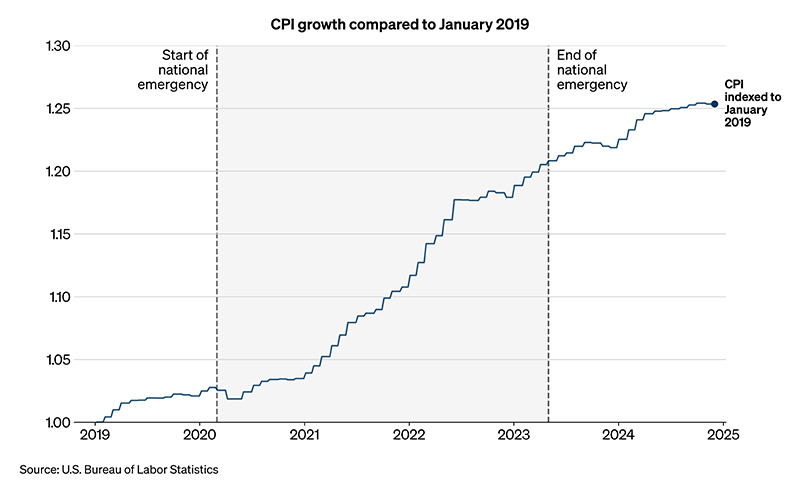
Figure A1 illustrates the trend of inflation from 2019 to 2024, highlighting key periods of inflationary pressure that affected small businesses. The chart plots changes in the Consumer Price Index (CPI) relative to its level in January 2019. A significant increase in inflation is observed starting in 2021, driven by factors such as supply chain disruptions, increased demand, and rising energy prices. By the end of 2024, the index reached 1.25, indicating a 25 percent increase in the CPI since January 2019.
Figure A2: For both the 2014 and the 2019 cohorts, median revenues stabilized as firms matured.
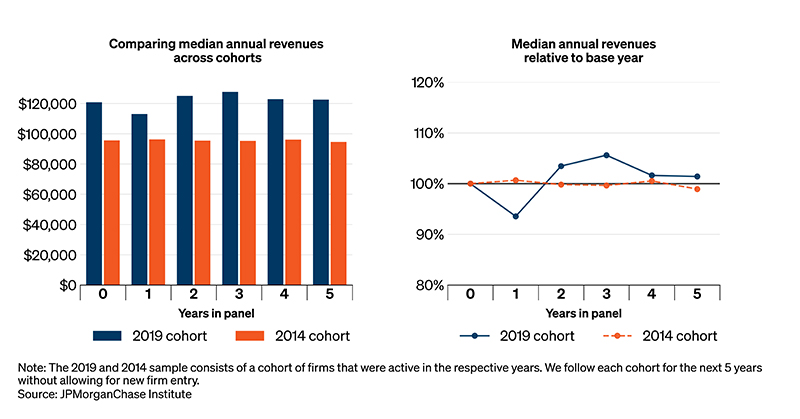
Figure A2 illustrates the dynamics of median annual nominal firm revenue by year for the 2014 firm cohort and the 2019 firm cohort. The 2014 cohort includes only small businesses active in 2014 and, similar to the 2019 cohort, does not account for the entry of newly created firms. The left panel compares median revenues in levels. The 2014 cohort shows a stable median annual revenue slightly lower than $100,000. The right panel considers the median annual revenue compared to the baseline year level for each group, which is 2014 for the 2014 firm cohort and 2019 for the 2019 firm cohort. The x-axis represents the year following the cohort's baseline year, with Year 1 being 2020 for the 2019 cohort and 2015 for the 2014 cohort. The graph shows that, even for the 2014 cohort, which did not face significant inflationary pressure, median revenue stabilized over time. This aligns with the empirical evidence that most revenue growth occurs in the early years of a firm's life (Farrell et al. 2020). Over time, as firms mature, revenue growth tends to stabilize, reflecting a shift from rapid expansion to more stable operations.
Acharya, Viral V., Robert F. Engle, Maximilian Jager, and Sascha Steffen. 2021. “Why Did Bank Stocks Crash during COVID-19?” National Bureau of Economic Research Working Paper 28559.
Autor, David, David Cho, Leland D. Crane, Mita Goldar, Byron Lutz, Joshua Montes, William B. Peterman, David Ratner, Daniel Villar, and Ahu Yildirmaz. 2022a. “An evaluation of the Paycheck Protection Program using administrative payroll microdata.” Journal of Public Economics Vol. 211: 104664.
Autor, David, David Cho, Leland D. Crane, Mita Goldar, Byron Lutz, Joshua Montes, William B. Peterman, David Ratner, Daniel Villar, and Ahu Yildirmaz. 2022b. “The $800 billion paycheck protection program: where did the money go and why did it go there?” Journal of Economic Perspectives Vol. 36, No. 2: 55-80.
Bartik, Alexander W, Marianne Bertrand, Zoë B. Cullen, Edward L. Glaeser, Michael Luca, and Christopher T. Stanton. 2020. “How are small businesses adjusting to COVID-19? Early evidence from a survey.” National Bureau of Economic Research Working Paper 26989.
Bartik, Alexander W., Zoe B. Cullen, Edward L. Glaeser, Michael Luca, Christopher T. Stanton, and Adi Sunderam. 2021. “The Targeting and Impact of Paycheck Protection Program Loans to Small Businesses.” National Bureau of Economic Research Working Paper 27623.
Bates, Thomas W., Kathleen M. Kahle, and Rene M. Stulz. 2009. “Why Do U.S. Firms Hold So Much More Cash than They Used To?” The Journal of Finance Vol. 64, No. 5: 1985-2021.
Black, Lamont, and Lieu Hazelwood. 2012. “The Effect of TARP on Bank Risk-Taking.” International Finance Discussion Papers Vol. 9, No. 4: 790-803.
Board of Governors of the Federal Reserve System. 2022. Availability of Credit to Small Businesses. Report to Congress.
https://www.federalreserve.gov/publications/2022-october-availability-of-credit-to-small-businesses.htm.
Card, David, and Alexandre Mas. 2016. “Introduction: The Labor Market in the Aftermath of the Great Recession.” Journal of Labor Economics Vol. 34, No. S1: S1-S6.
Chodorow-Reich, Gabriel, Olivier Darmouni, Stephan Luck, and Matthew Plosser. 2022. “Bank Liquidity Provision Across the Firm Size Distribution.” Journal of Financial Economics Vol. 144, No. 3: 908-932.
Cole, Rebel A., and Jason Damm. 2020. “How Did the Financial Crisis Affect Small Business Lending in the United States?” The Journal of Financial Research Vol. 43, No. 4: 767-820.
Diamond, Peter A. 1982. “Aggregate Demand Management in Search Equilibrium.” Journal of Political Economy Vol. 90, No. 5: 881-894.
Fairlie, Robert W. 2020. “The Impact of Covid-19 on Small Business Owners: Evidence of Early-Stage Losses from the April 2020 Current Population Survey.” National Bureau of Economic Research Working Paper 27309.
Farrell, Diana, Christopher Wheat, and Carlos Grandet. 2019. “Place Matters: Small Business Financial Health in Urban Communities.” JPMorganChase Institute.
https://www.jpmorganchase.com/institute/all-topics/business-growth-and-entrepreneurship/place-matters-small-business-financial-health-in-urban-communities.
Farrell, Diana, Christopher Wheat, and Chi Mac. 2018. “Growth, Vitality, and Cash Flows: High-Frequency Evidence from 1 Million Small Businesses.” JPMorganChase Institute.
https://www.jpmorganchase.com/content/dam/jpmc/jpmorgan-chase-and-co/institute/pdf/institute-growth-vitality-cash-flows.pdf.
Farrell, Diana, Christopher Wheat, and Chi Mac. 2020a. “Small Business Financial Outcomes during the Onset of COVID-19.” JPMorganChase Institute.
https://www.jpmorganchase.com/institute/all-topics/business-growth-and-entrepreneurship/small-business-financial-outcomes-during-the-onset-of-covid-19.
Farrell, Diana, Christopher Wheat, and Chi Mac. 2020b. “Small Business Owner Race, Liquidity, and Survival.” JPMorganChase Institute.
https://www.jpmorganchase.com/content/dam/jpmc/jpmorgan-chase-and-co/institute/pdf/institute-small-business-owner-race-report.pdf.
Farrell, Diana, Christopher Wheat, and Chi Mac. 2020c. “Small Business Financial Outcomes during the COVID-19 Pandemic.” JPMorganChase Institute.
https://www.jpmorganchase.com/institute/all-topics/business-growth-and-entrepreneurship/report-small-business-financial-outcomes-during-the-covid-19-pandemic.
Farrell, Diana, Christopher Wheat, Chi Mac, and Bryan Kim. 2020. “Small Business Expenses during COVID-19.” JPMorganChase Institute.
https://www.jpmorganchase.com/institute/all-topics/business-growth-and-entrepreneurship/report-small-business-expenses-during-COVID-19.
Favara, Giovanni, Janet Gao, and Mariassunta Giannetti. 2021. “Uncertainty, access to debt, and firm precautionary behavior.” Journal of Financial Economics Vol. 141, No. 2: 436-453.
United States Government Accountability Office. 2023. Unemployment Insurance: Estimated Amount of Fraud during Pandemic Likely Between $100 Billion and $135 Billion.
https://www.gao.gov/assets/gao-23-106696.pdf.
Hampstead, John Paul. 2024. “Analysis: SBA disaster loans propped up carriers, prolonged Great Freight Recession.” FreightWaves.
https://www.freightwaves.com/news/analysis-sba-disaster-loans-propped-up-carriers-prolonged-great-frecession
Harford, Jarrad, Sandy Klasa, and William F. Maxwell. 2014. “Refinancing Risk and Cash Holdings.” The Journal of Finance Vol. 69, No. 3: 975-1012.
International Council of Museums (ICOM). 2020. Museums, museum professionals, and COVID-19: Follow up survey.
https://icom.museum/wp-content/uploads/2020/05/Report-Museums-and-COVID-19.pdf
Kennickell, Arthur B., Myron L. Kwast, and Jonathan Pogach. 2017. “Small Businesses and Small Business Finance during the Financial Crisis and the Great Recession: New Evidence from the Survey of Consumer Finances.” In Measuring Entrepreneurial Businesses: Current Knowledge and Challenges, 291-349. University of Chicago Press.
McLean, David R. 2011. “Share issuance and cash savings.” Journal of Financial Economics Vol. 99, No. 3: 693-715.
Mims, Christopher. 2021. “With Shopify, Small Businesses Strike Back at Amazon.” The Wall Street Journal.
https://www.wsj.com/articles/with-shopify-small-businesses-strike-back-at-amazon-11615611603
Monga, Vipal. 2021. “Shopify’s Secret Weapon Is Thousands of New Business Owners.” The Wall Street Journal.
https://www.wsj.com/articles/shopifys-secret-weapon-is-thousands-of-new-business-owners-11613484000
Opler, Tim, Lee Pinkowitz, Rene Stulz, and Rohan Williamson. 1999. “The determinants and implications of corporate cash holdings.” Journal of Financial Economics Vol. 52, No. 1: 3-46.
Passalacqua, Andrea, Paolo Angelini, Francesca Lotti, and Giovanni Soggia. 2021. “The Real Effects of Bank Supervision: Evidence from On-Site Bank Inspections.” Temi di discussione (Economic working papers) Number 1349.
Rothstein, Jesse. 2023. “The Lost Generation? Labor Market Outcomes for Post-Great Recession Entrants.” Journal of Human Resources Vol. 58, No. 5: 1452-1479.
Rouse, Cecilia E. 2024. “Lessons for Economists from the Pandemic.” The Reporter, National Bureau of Economic Research.
Siegal, Nina. 2020. “Many Museums Won’t Survive the Virus. How Do You Close One Down?” The New York Times.
https://www.nytimes.com/2020/04/29/arts/design/how-do-you-close-a-museum.html
Stiglitz, Joseph E., and Andrew Weiss. 1981. “Credit Rationing in Markets with Imperfect Information.” The American Economic Review Vol. 71, No. 3: 393-410.
U.S. Department of the Treasury. 2020. The CARES Act Provides Assistance to Small Businesses.
https://home.treasury.gov/policy-issues/cares/assistance-for-small-businesses
U.S. Small Business Administration, Office of Inspector General. 2023. COVID-19 Pandemic EIDL and PPP Loan Fraud Landscape.
https://www.sba.gov/document/report-23-09-covid-19-pandemic-eidl-ppp-loan-fraud-landscape
Wang, Jialan, Jeyul Yang, Benjamin Iverson, and Renhao Jiang. 2021. “Bankruptcy and the COVID-19 Crisis.” Working Paper 21-041, Harvard Business School.
Wheat, Christopher, and Chi Mac. 2021a. “The Paycheck Protection Program: Small Business Balances, Revenues, and Expenses in the Weeks after Loan Disbursement.” JPMorganChase Institute. https://www.jpmorganchase.com/institute/all-topics/business-growth-and-entrepreneurship/paycheck-protection-program-small-business-balances-revenues-and-expenses-weeks-after-loan-disbursement
Wheat, Christopher, and Chi Mac. 2021b. “Did the Paycheck Protection Program Support Small Business Activity?” JPMorganChase Institute.
https://www.jpmorganchase.com/institute/all-topics/business-growth-and-entrepreneurship/did-ppp-support-small-business-activity
Wheat, Christopher, and Chi Mac. 2023. “Cash or credit: small business use of credit cards for cash flow management.” JPMorganChase Institute.
https://www.jpmorganchase.com/institute/all-topics/business-growth-and-entrepreneurship/small-business-use-of-credit-cards
Wilson, Michael, and Amelia Nierenberg. 2020. “We're Completely Lost': Coronavirus Hits N.Y. Restaurants.” The New York Times.
https://www.nytimes.com/2020/03/16/nyregion/nyc-closing-bars-restaurants-coronavirus.html
We thank Sarwari Das for her hard work and critical contributions to this research. Additionally, we thank Oscar Cruz and Kate Faryniarz for their support. We are indebted to our internal partners and colleagues, who support delivery of our agenda in a myriad of ways and acknowledge their contributions to each and all releases.
We would like to acknowledge Jamie Dimon, CEO of JPMorgan Chase & Co., for his vision and leadership in establishing the Institute and enabling the ongoing research agenda. We remain deeply grateful to Peter Scher, Vice Chairman; Tim Berry, Head of Corporate Responsibility; Heather Higginbottom, Head of Research, Policy, and Insights and others across the firm for the resources and support to pioneer a new approach to contribute to global economic analysis and insight.
This material is a product of JPMorganChase Institute and is provided to you solely for general information purposes. Unless otherwise specifically stated, any views or opinions expressed herein are solely those of the authors listed and may differ from the views and opinions expressed by J.P. Morgan Securities LLC (JPMS) Research Department or other departments or divisions of JPMorgan Chase & Co. or its affiliates. This material is not a product of the Research Department of JPMS. Information has been obtained from sources believed to be reliable, but JPMorgan Chase & Co. or its affiliates and/or subsidiaries (collectively J.P. Morgan) do not warrant its completeness or accuracy. Opinions and estimates constitute our judgment as of the date of this material and are subject to change without notice. No representation or warranty should be made with regard to any computations, graphs, tables, diagrams or commentary in this material, which is provided for illustration/reference purposes only. The data relied on for this report are based on past transactions and may not be indicative of future results. J.P. Morgan assumes no duty to update any information in this material in the event that such information changes. The opinion herein should not be construed as an individual recommendation for any particular client and is not intended as advice or recommendations of particular securities, financial instruments, or strategies for a particular client. This material does not constitute a solicitation or offer in any jurisdiction where such a solicitation is unlawful.
Wheat, Chris, Chi Mac, and Andrea Passalacqua. 2025. “Small businesses in times of distress: Lessons learned from the pandemic.” JPMorganChase Institute. https://www.jpmorganchase.com/institute/all-topics/business-growth-and-entrepreneurship/small-businesses-in-times-of-distress
Footnotes
This is a classic example of a market failure where financial markets do not function perfectly. This can occur due to information asymmetries, incomplete markets, credit constraints, or other inefficiencies in the financial system (e.g., Stiglitz and Weiss 1981).
This is the case of negative externalities, a form of market failure where the actions of individuals or firms have unintended side effects on others that are not reflected in market prices. In the case of layoffs or firm closures, the negative externalities can include increased unemployment, reduced consumer spending, reduced business spending that affect the firm’s network (e.g., suppliers and customers), and broader economic instability, which are not accounted for by the individual firms making these decisions (e.g., Diamond 1982).
In particular, direct support may generate misallocation of resources if limited vetting criteria are applied and may allow funds to reach firms that were not financially constrained or at risk, reducing program efficiency. Moreover, direct support typically entails higher fiscal costs, since disbursed funds often do not require repayment, resulting in a direct burden on public budgets. Finally, it can create moral hazard for firms, weakening their incentives to manage risk or adapt to changing conditions if they anticipate future bailouts.
An example of indirect support was the Troubled Asset Relief Program (TARP), a government intervention initiated by the U.S. in response to the Great Financial Crisis of 2007−2008, which provided capital injections to distressed financial institutions, with the goal of restoring confidence in the financial markets, improving liquidity, and encouraging lending to businesses.
Compared to the government support during the Great Financial Crisis, the forgiveness of aid to small businesses during the COVID-19 pandemic was contingent upon employment retention and wage maintenance, thereby addressing the potential negative externalities to the economy associated with employee layoffs. Policymakers at the time were concerned with long-term costs for individuals and the economy from extended job loss. Extensive literature discusses the lasting effect of recessions on labor market, ranging from the cost of entering a poor labor market for young people to the scarring for prime age and older workers (Card and Mas 2016; Rothstein 2023).
This situation is analogous to zombie lending, where banks continue to extend credit to non-viable firms to avoid recognizing losses (e.g., Acharya et al. 2021; Passalacqua et al. 2021).
In particular, the PPP was established by the U.S. federal government as part of the Coronavirus Aid, Relief, and Economic Security (CARES) Act in March 2020, aimed at mitigating the economic impact of the COVID-19 pandemic. Its primary objective was to provide financial support to small businesses to help them retain their employees during the crisis. Administered by the Small Business Administration (SBA) in collaboration with participating lenders, the program featured low interest rates and deferred repayment terms to ensure affordability (https://www.sba.gov/funding-programs/loans/covid-19-relief-options/paycheck-protection-program). The loans could be forgiven if the funds were used for eligible expenses, such as payroll, rent, utilities, and mortgage interest, effectively turning them into grants. Over time, the PPP underwent two rounds of funding and adjustments to better address the evolving needs of businesses affected by the pandemic. Policymakers learned firsthand the complexities involved in designing optimal policy interventions, and they adjusted the second round to address some of the issues that arose. The PPP was initially available only to employer firms, but eligibility was later extended to sole proprietors, independent contractors, and self-employed individuals. The impact of the PPP on small businesses has been widely studied (e.g., Wheat and Mac 2021a; Wheat and Mac 2021b; Bartik et al. 2020; Bartik et al. 2021).
EIDL advances did not need to be repaid (https://www.sba.gov/funding-programs/loans/covid-19-relief-options/eidl).
This finding is consistent with Wang et al. (2021), which showed that business bankruptcies fell 27 percent in 2020 relative to 2019, and that filing rates in 2021 were similar to those in 2020. For small businesses with less than $10 million in assets, filing rates declined at the onset of the pandemic and rebounded over the year, stabilizing around 20 percent lower than 2019 levels. Chodorow-Reich et al. (2022) found similar results for small businesses, where small businesses are defined as firms with less than $10 million in assets.
This trend is also consistent with data on business exit rates from the Bureau of Labor Statistics (BLS). Studying the BLS data for private sector establishments founded in 2016, the exit rates were 10 percent in March 2020, 7.9 percent in March 2021, 6.4 percent in March 2022, 8.7 percent in March 2023, and 7.8 percent in March 2024. It is important to note that, while the BLS reports these statistics as of March each year, our data considers the exit rate at the end of the year. Therefore, to make a more accurate comparison between our statistics and the BLS data, one might consider taking the average of the two years. Similar to our findings, the BLS data indicates an increase in exit rates in calendar years 2022 and 2023 (https://www.bls.gov/bdm/us_age_naics_00_table7.txt).
Another potential explanation for the spike in business closures in 2022 is the increase in inflation. The end of 2021 also coincided with increased inflationary pressure due to several potential contributing factors, including pandemic-related supply chain disruptions, monetary and fiscal stimulus, pent-up demand as economies reopened, tight labor markets, and energy price surges resulting from the Russia-Ukraine conflict. Figure A1 shows changes in the Consumer Price Index (CPI) relative to its level in January 2019. A significant increase in inflation is observed starting in 2021. By the end of 2024, the index reached 1.25, indicating a 25 percent increase in the CPI since January 2019.
For instance, TARP was aimed at large financial institutions, with less direct support for small businesses. The indirect nature of this support slowed assistance to small businesses, as it depended on banks internalizing the liquidity boost from the capital injection and deciding to extend credit, which could have been constrained by risk aversion or regulatory concerns. While TARP succeeded in stabilizing the banking sector, its impact on small business lending was mixed. For instance, Cole and Damm (2020) found that banks receiving capital injections from the TARP failed to increase their small‐business lending and the reduction was more pronounced than non-TARP banks. Black and Hazelwood (2012) found that the risk profile of loan originations changed post-TARP capital injection. Specifically, while large TARP banks increased it, small TARP banks decreased it. This finding suggests that small banks may have used TARP funds more conservatively, potentially limiting their lending expansion to larger and more established firms.
Real values are calculated by adjusting nominal values for inflation using the average annual Consumer Price Index (CPI) as the deflator and 2019 as the base year.
This is consistent with previous research showing a negative impact on small business revenue and expense (e.g., Farrell, Wheat, and Mac 2020c).
Revenue growth typically slows as firms age (Farrell et al. 2020). We validated this finding in Figure A2 by analyzing the 2014 cohort of firms, which did not encounter any major economic shocks or inflationary pressures and observed that their real and nominal median annual revenue remained stable over time.
These challenges in accessing external capital are due to their perceived higher risk and the elevated costs associated with lending to them. Moreover, these challenges are compounded by a high risk of failure and "informational opacity," where reliable financial information is scarce, making it difficult for lenders to assess creditworthiness accurately (Board of Governors of the Federal Reserve System 2022).
Wheat and Mac (2021b) showed that the PPP supported extra spending for 4−5 months.
This is true especially for firms with limited access to capital markets (e.g., Opler et al. 1999; Bates et al. 2009; McLean 2011; Harford et al. 2014; Favara et al. 2021).
For instance, the temporary lockdown and social distancing strained most restaurants in New York (Wilson and Nierenberg 2020). Additionally, while museums were hit hard, with nearly 95 percent of institutions around the world forced to close temporarily to protect the well-being of staff and visitors, the sector faced severe economic, social, and cultural repercussions (ICOM 2020). There was also concern that many museums might not survive the pandemic (Siegal 2020).
Due to the lockdown and social distancing, e-commerce became vital for many retailers, whether through their own websites, marketplaces, or cloud-based third-party services that offer payment and fulfillment operations. These services have helped small businesses reduce the burden of establishing an online presence (Mims 2021; Monga 2021).
Cities refer to Core-Based Statistical Areas (CBSA) and are labeled with the name of the largest city they contain.
Autor et al. (2022a, 2022b) estimated that PPP loans cost between $169,000 and $258,000 per job-year saved, more than twice the average salary of these workers. They also estimated that more than two-thirds of the total outlays in the program accrued to business owners and shareholders rather than employees. Outright fraud was also very common. SBA (2023) estimated that about $64 billion of PPP loans (about 8 percent) and $136 billion of EIDL may have been fraudulent, while GAO (2023) identified that between $55 to $135 billion of Unemployment Insurance (UI) could have been fraudulent.
Authors

Chris Wheat
President, JPMorganChase Institute

Chi Mac
Business Research Director

Andrea Passalacqua
Small Business and LED Research Lead
Media Contact
Shelby Wagenseller, Shelby.Wagenseller@jpmchase.com