
Figure 1: Amount of debt forgiven under different scenarios
Latest news

An Ohio-based company is protecting first responders around the world
With support from JPMorganChase, Fire-Dex is providing protective equipment to firefighters in 100 countries and all 50 states.
Learn moreLatest news

Veteran’s Unconventional Path to Landing her Dream Job in Tech
U.S. Army Veteran Ashley Wigfall transitioned to a civilian role and charted her path to technologist through mentorship and skills training at the JPMorgan Chase tech hub in Plano, Texas.
Learn more
Findings
Total student debt in the United States is approximately $1.7 trillion.1 At the same time, the COVID-19 pandemic has caused historic levels of unemployment and economic hardship. Even before the pandemic, many student loan borrowers faced payment burdens well over 10 percent of take-home income or debt traps, in which they cannot keep up with monthly interest rates (Farrell, Greig, and Sullivan 2020). Government action paused payments and interest accumulation on federal student loans beginning in March 2020 to ease economic burdens brought on by the pandemic. In addition to this temporary relief, policy makers have proposed permanent forgiveness of federal student loans, which represent roughly 92 percent of total student loan debt (Amir, Teslow, and Borders 2020).2,3
In this insight, we use administrative banking and credit bureau data to estimate how the benefits of different debt cancellation scenarios would be distributed by household income, borrowers’ remaining time to pay off their debt, and borrower race and ethnicity.4 We examine four scenarios: (1) universal cancellation of up to $10,000 of every debtor’s balance; (2) cancellation of up to $50,000 of debt for people earning less than $125,000; (3) cancellation of up to $25,000 for people earning less than $75,000 and phasing out at $100,000; and (4) cancellation of up to $50,000 with the same income phase-out as scenario 3.
From our linked banking and credit bureau data, we take individual borrowers’ student debt balances, annual income, and debt repayment patterns in 2016 to calculate several aspects of these hypothetical cancellation scenarios. First, how much debt will be cancelled? Second, how is cancelled debt spread across the income distribution—how much goes to high- versus low-income households? Third, how much of the cancelled debt is held by people who are on track to repay their loans on time versus those that may never be able to fully repay? Finally, how is cancelled debt spread across race and ethnicity groups?
We find that income cut offs significantly reduce the total amount of debt forgiven and make cancellation less regressive, while all cancellation scenarios we examine distribute forgiveness across borrowers by race in roughly the same way. The $10,000 universal cancellation would forgive roughly a quarter of all student loan debt, while the income-limited $50,000 cancellation would forgive half of all debt. The $25,000 cancellation with income phase-out cancels the same amount of debt as the $10,000 universal cancellation. Cancellation also disproportionately benefits middle- and high-income families, though income targeting makes cancellation less regressive. This relative regressivity is driven by the fact that higher-income households carry larger debts, often from professional or graduate degrees. Conversely, more aggressive income targeting does not necessarily result in a greater share of forgiveness going to borrowers in a debt trap or facing long repayment horizons. Raising the total cancellation available, however, does slightly increase the share of forgiveness received by borrowers with longer term payoff horizons. The share of cancellation received across race and ethnicity is largely unaffected by income targeting and mirrors the share of total debt held by race and ethnicity.
In general, we find that more aggressive income limits reduce costs and increase progressivity.5 For example, a $25,000 cancellation phasing out between $75,000 and $100,000 of income forgives roughly the same amount of total debt as the universal $10,000 cancellation (28 versus 27 percent) but gives $3.85 to low-income borrowers for every dollar given to high-income borrowers. A $50,000 cancellation with the same phase-out cancels more debt (39 percent of all debt) and is slightly more regressive but delivers more total forgiveness to low-income borrowers, borrowers facing a debt trap or long repayment horizons, and Black and Latinx borrowers.6
It should also be noted that several options available to policymakers were not considered here due to limitations in our data. For example, exempting graduate school debt would likely make forgiveness less regressive and reduce overall costs. Forgiving accumulated interest would also likely be progressive, as people with the means to repay debt are unlikely to have accumulated a great deal of back interest.7 We discuss these options in the implications section.
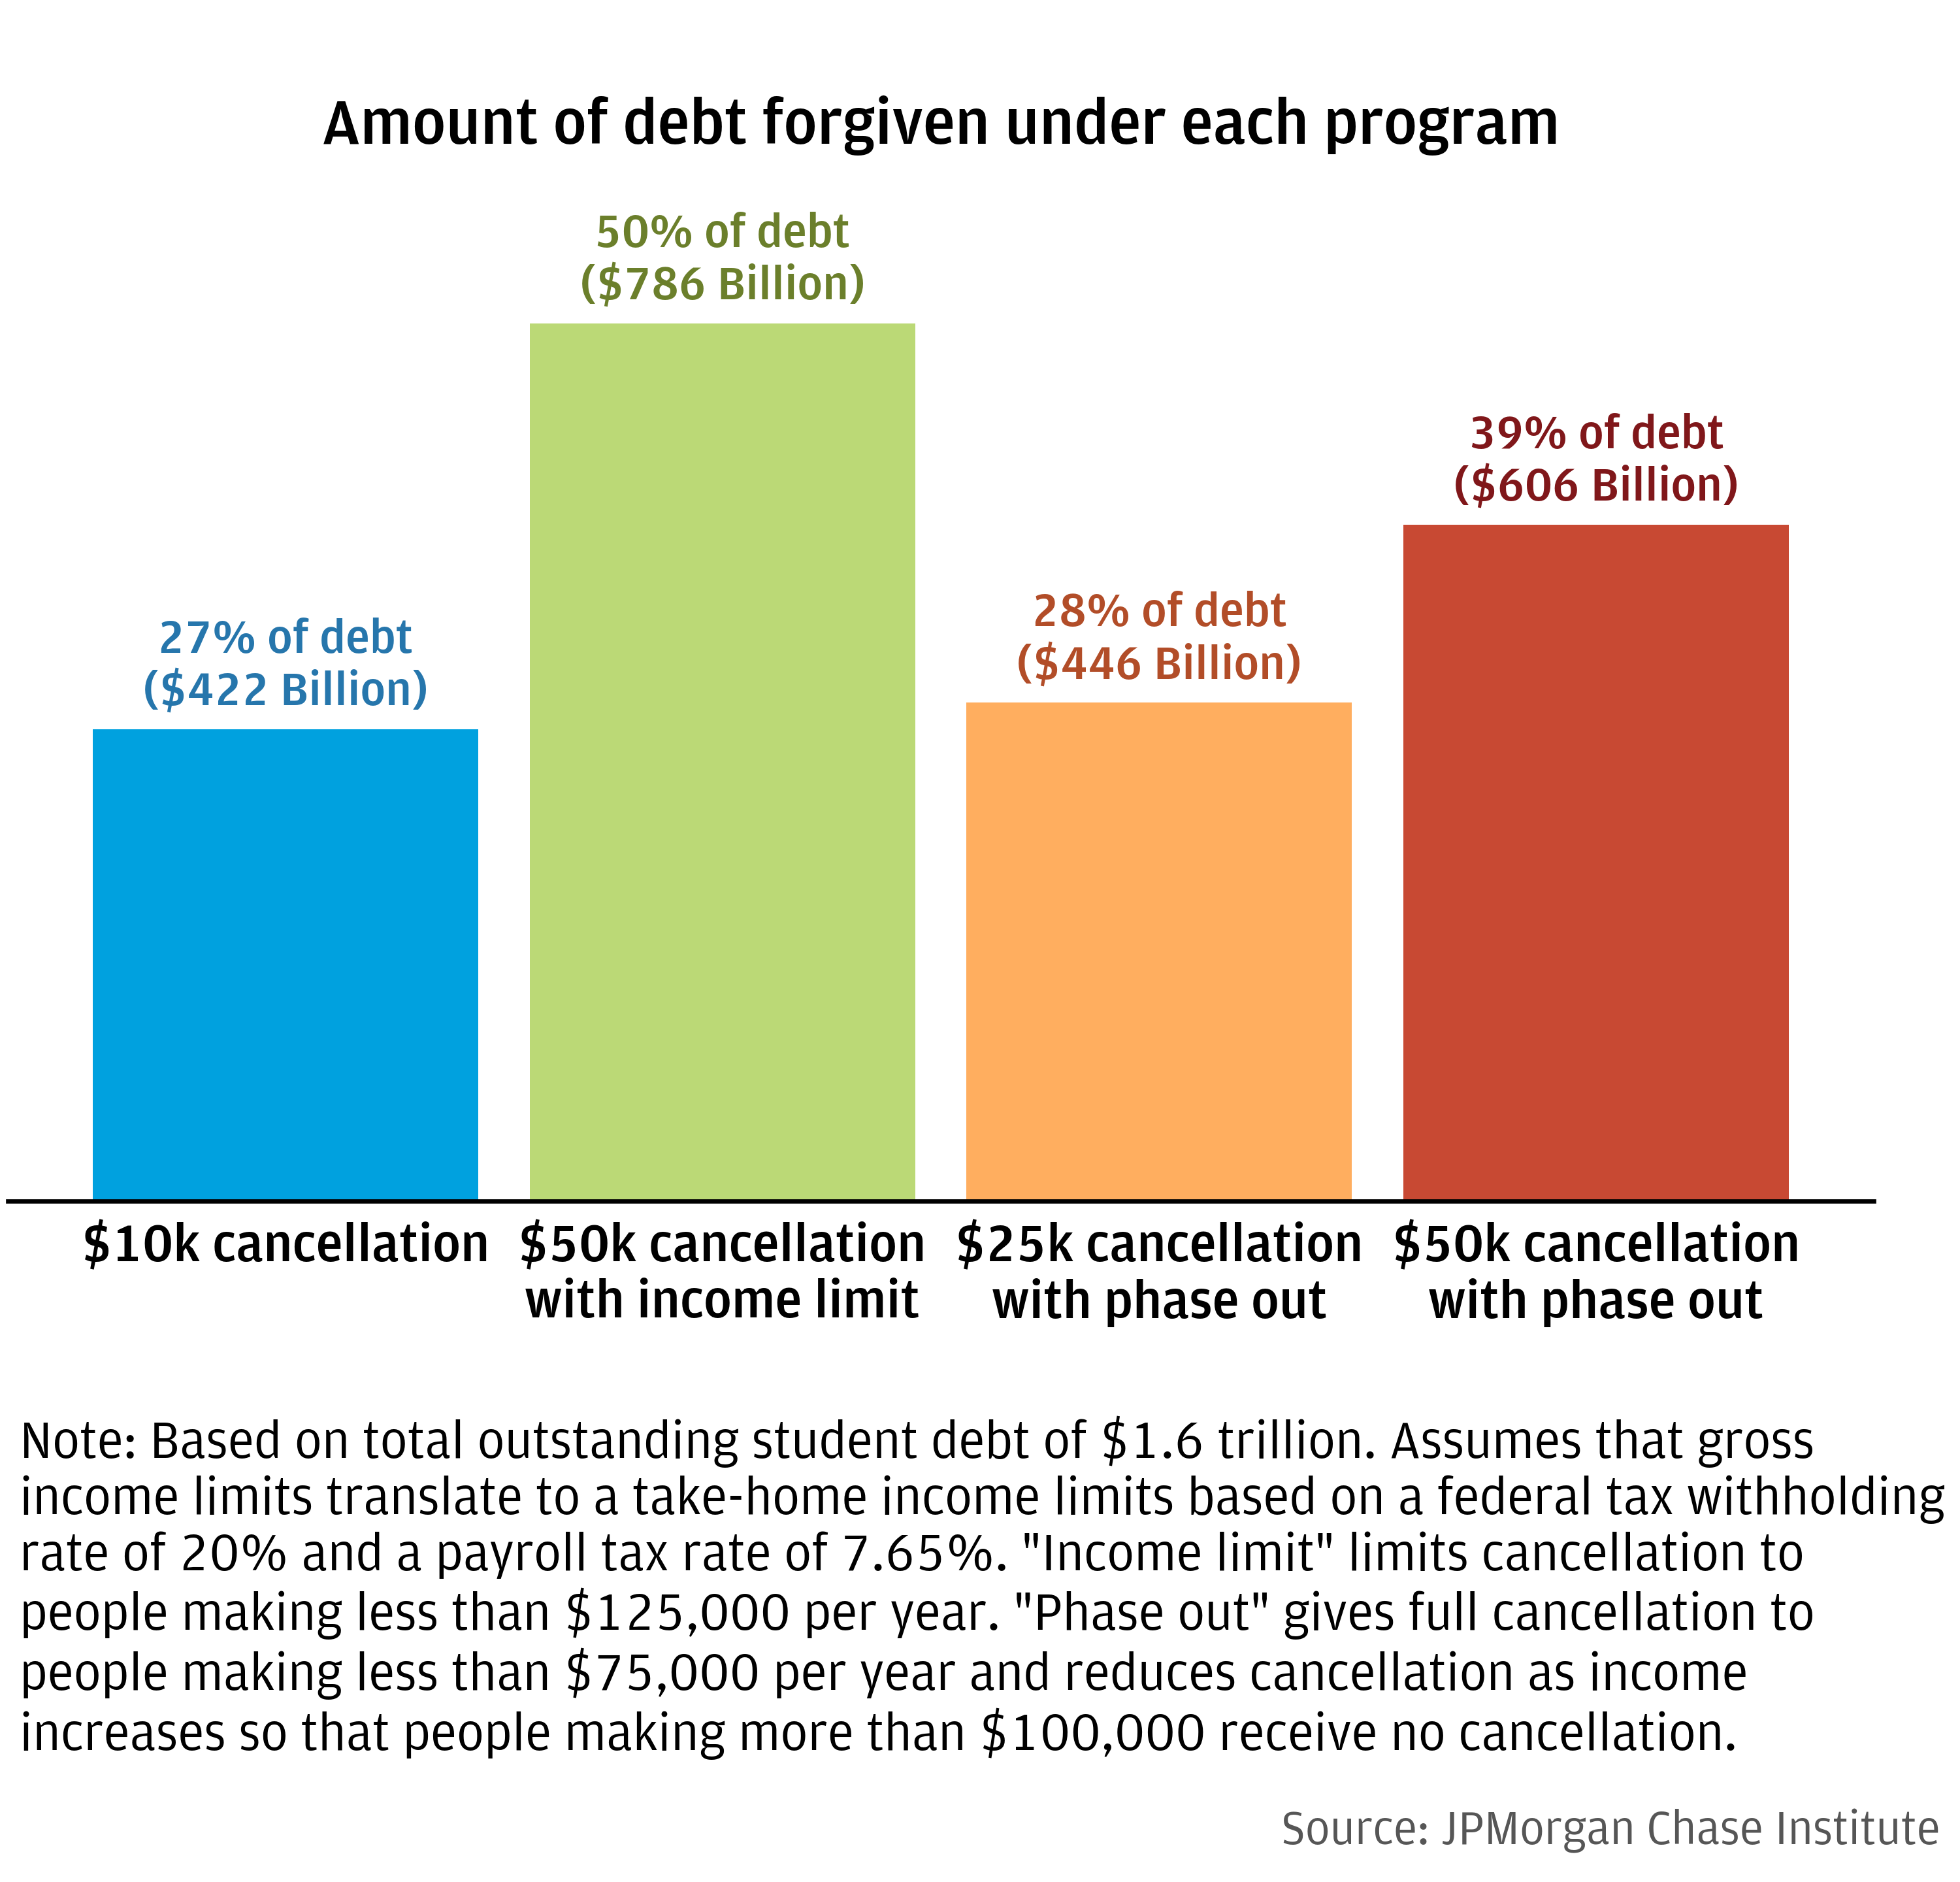
Figure 1 shows the total amount of debt cancelled under each scenario. Because we only observe take-home income in our checking account data, we translate the gross income cutoffs of $75,000, $100,000, and $125,000 to net income limits of $54,263, $72,350, and $90,438 by assuming a tax withholding rate of 20 percent and an additional payroll tax rate of 7.65 percent.
The $50,000 cancellation with income limit forgives the most total debt (50 percent of all debt), or $786 billion off a base of $1.566 trillion. A more aggressive income limit like the $75k-to-$100k income phase-out reduces the total debt cancelled significantly (39 percent of debt or $606 billion) for the same $50,000 potential cancellation for individuals. A $25,000 cancellation with phase-out further reduces total debt forgiven (28 percent, $446 billion) while a universal $10,000 cancellation does not greatly reduce total forgiveness beyond that (27 percent, $422 billion) despite the significantly lower amount of forgiveness afforded individual borrowers. Taken together, these alternatives would leave between $919 Billion and $1.283 Trillion in outstanding federal and private student loans, on par with 2012-2014 levels.
Figure 1: Amount of debt forgiven under different scenarios
We find that a disproportionate amount of debt forgiveness goes to middle- or high-income households under all the cancellation scenarios we consider because higher-income households tend to hold more student debt. However, more aggressive income targeting can make a cancellation program significantly more progressive.
The left panel of Figure 2 shows what share of total cancellation dollars goes to each income quintile and the income boundaries of each quintile.8
Figure 2: Distribution of cancellation benefits by income
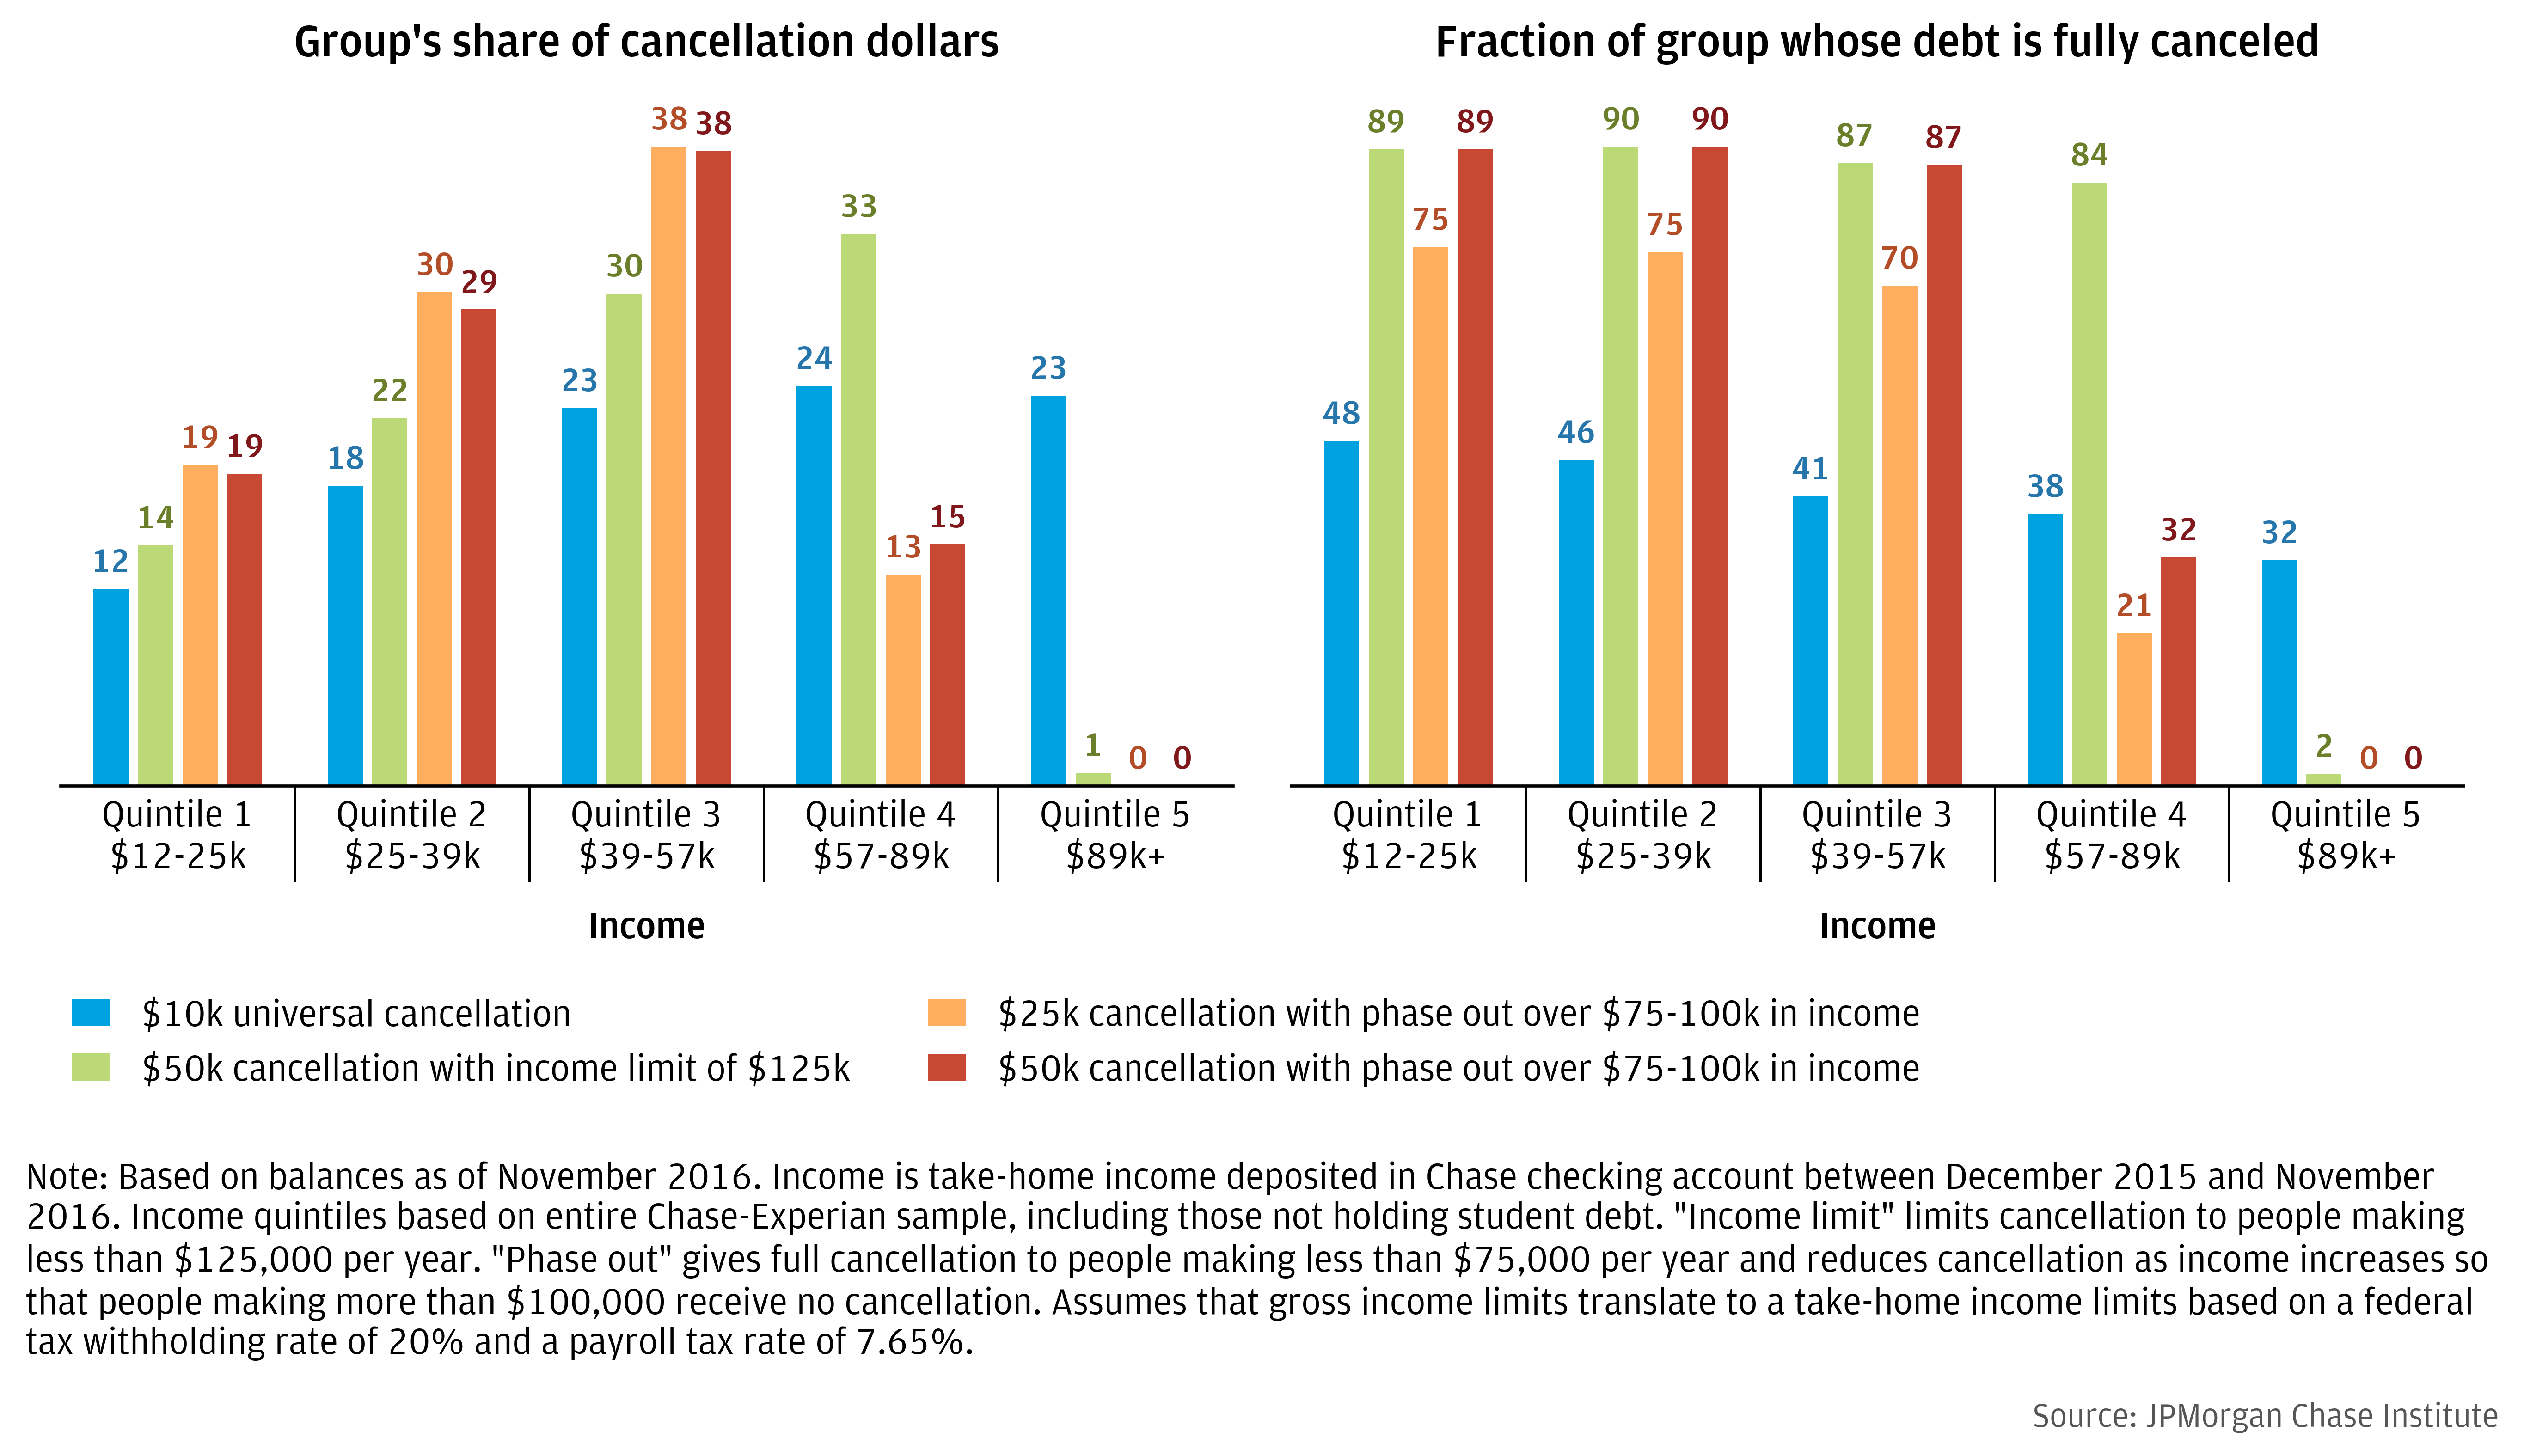
Under the universal $10,000 cancellation (shown in blue), only 12 percent of cancellation dollars go to the lowest quintile (i.e., the lowest 20 percent of earners) while 23 percent goes the highest income quintile. Under the income-limited $50,000 scenario (green), the highest income quintile receives almost no forgiveness at all because the vast majority of people in the top quintile exceed the $125,000 gross income limit ($90,438 net income limit). However, the share of forgiveness going to the lowest income households is only slightly higher (14 percent) while the share going to borrowers in quintiles 3 and 4 is higher. This is driven by the higher balances held by higher-income households, such as larger debts for professional school, medical school, etc., discussed more in Figure 3, below. The scenarios with an income phase-out and $25,000 and $50,000 cancellation are very similarly distributed across income groups and provide relatively more relief to borrowers in quintile 1, while middle-income borrowers (quintile 3) still receive roughly twice as much as borrowers in quintile 1.
The right panel of Figure 2 shows what fraction of people within each quintile has all their debt forgiven. The universal $10,000 cancellation would completely eliminate student loan debt for 48 percent of the lowest earning group versus 32 percent for the highest earning group. The $50,000 cancellation policies eliminate all debt for 87 to 90 percent of borrowers in the first three quintiles. Note that both $50,000 policies yield nearly identical results over this income range because neither scenario’s income limits has any effect for quintiles 1 and 2 and most of quintile 3. The $25,000 option fully cancels almost as many people in this range as the $50,000 options (70–75 percent).
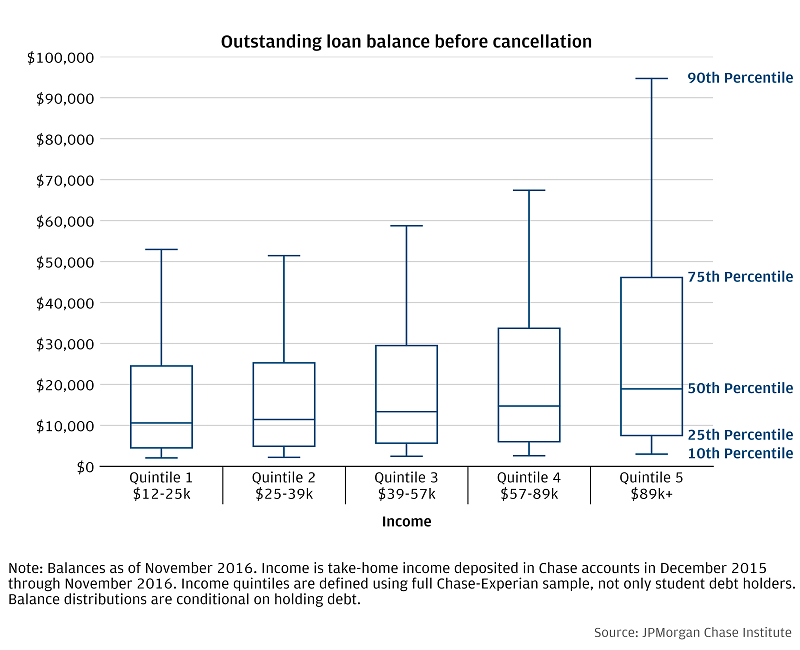
These dynamics are unsurprising given the distribution of balances within each income quintile, which can be seen in Figure 3. For example, the median debt holder in the quintile 1 has a balance just over $10,000 and the $10,000 universal cancellation completely forgives the debt of roughly 48 percent of borrowers in that quintile as shown in the right panel of Figure 2. Similarly, the 75th percentile balance in quintile 1 is roughly $25,000, and the $25,000 cancellation completely cancels the debt of 75 percent of borrowers in quintile 1.
Figure 3: Outstanding student debt balances before cancellation, conditional on holding student debt
Examining the share of benefits by income gives a sense of the progressivity of each hypothetical scenario and how much relief goes to those who need it most. Another way to assess how well targeted the scenarios are is to examine how much forgiveness goes to people who are about to pay off their debts versus people who won’t be able to pay off their debts for many years, if at all. Figure 4 is analogous to Figure 2, but instead of showing the distribution of cancellation by income, it shows how cancellation affects people based on their projected time to pay off their debt under current rules.9 We should note that borrowers with any tradelines in deferral or forbearance during our sample period are not included in any time-to-payoff analyses. Most of these borrowers are making zero payments toward their loans, putting them in the “never” pay off category; however, a primary reason for deferral is that the borrower is still in school or has returned to school as not required to make payments, and including these borrowers in the analysis would inflate the number of people in the “never” category.
The left panel of Figure 4 shows that for the unconditional $10,000 cancellation, 51 percent of all cancellation dollars go to those who are projected to pay off in less than 10 years (note that 10 years is the standard repayment term for borrowers who have not refinanced their loans), while 9 percent goes to those who will take longer than 20 years. Five percent goes to those who are on track to “never” pay off their loans in that they are paying less than their monthly interest charges. In general, raising the cancellation ceiling pushes a larger share of cancellation dollars into the longer-term payoff categories. This is driven mostly by the fact that people closer to paying off have smaller balances.10 Similarly, more stringent income caps do not significantly alter the distribution. The exception to these patterns is the group of people projected to never payoff, 47 percent of whom are not making any payments toward their loans.
Figure 4: Distribution of cancellation benefits by borrower’s projected time to pay off debt under current rules
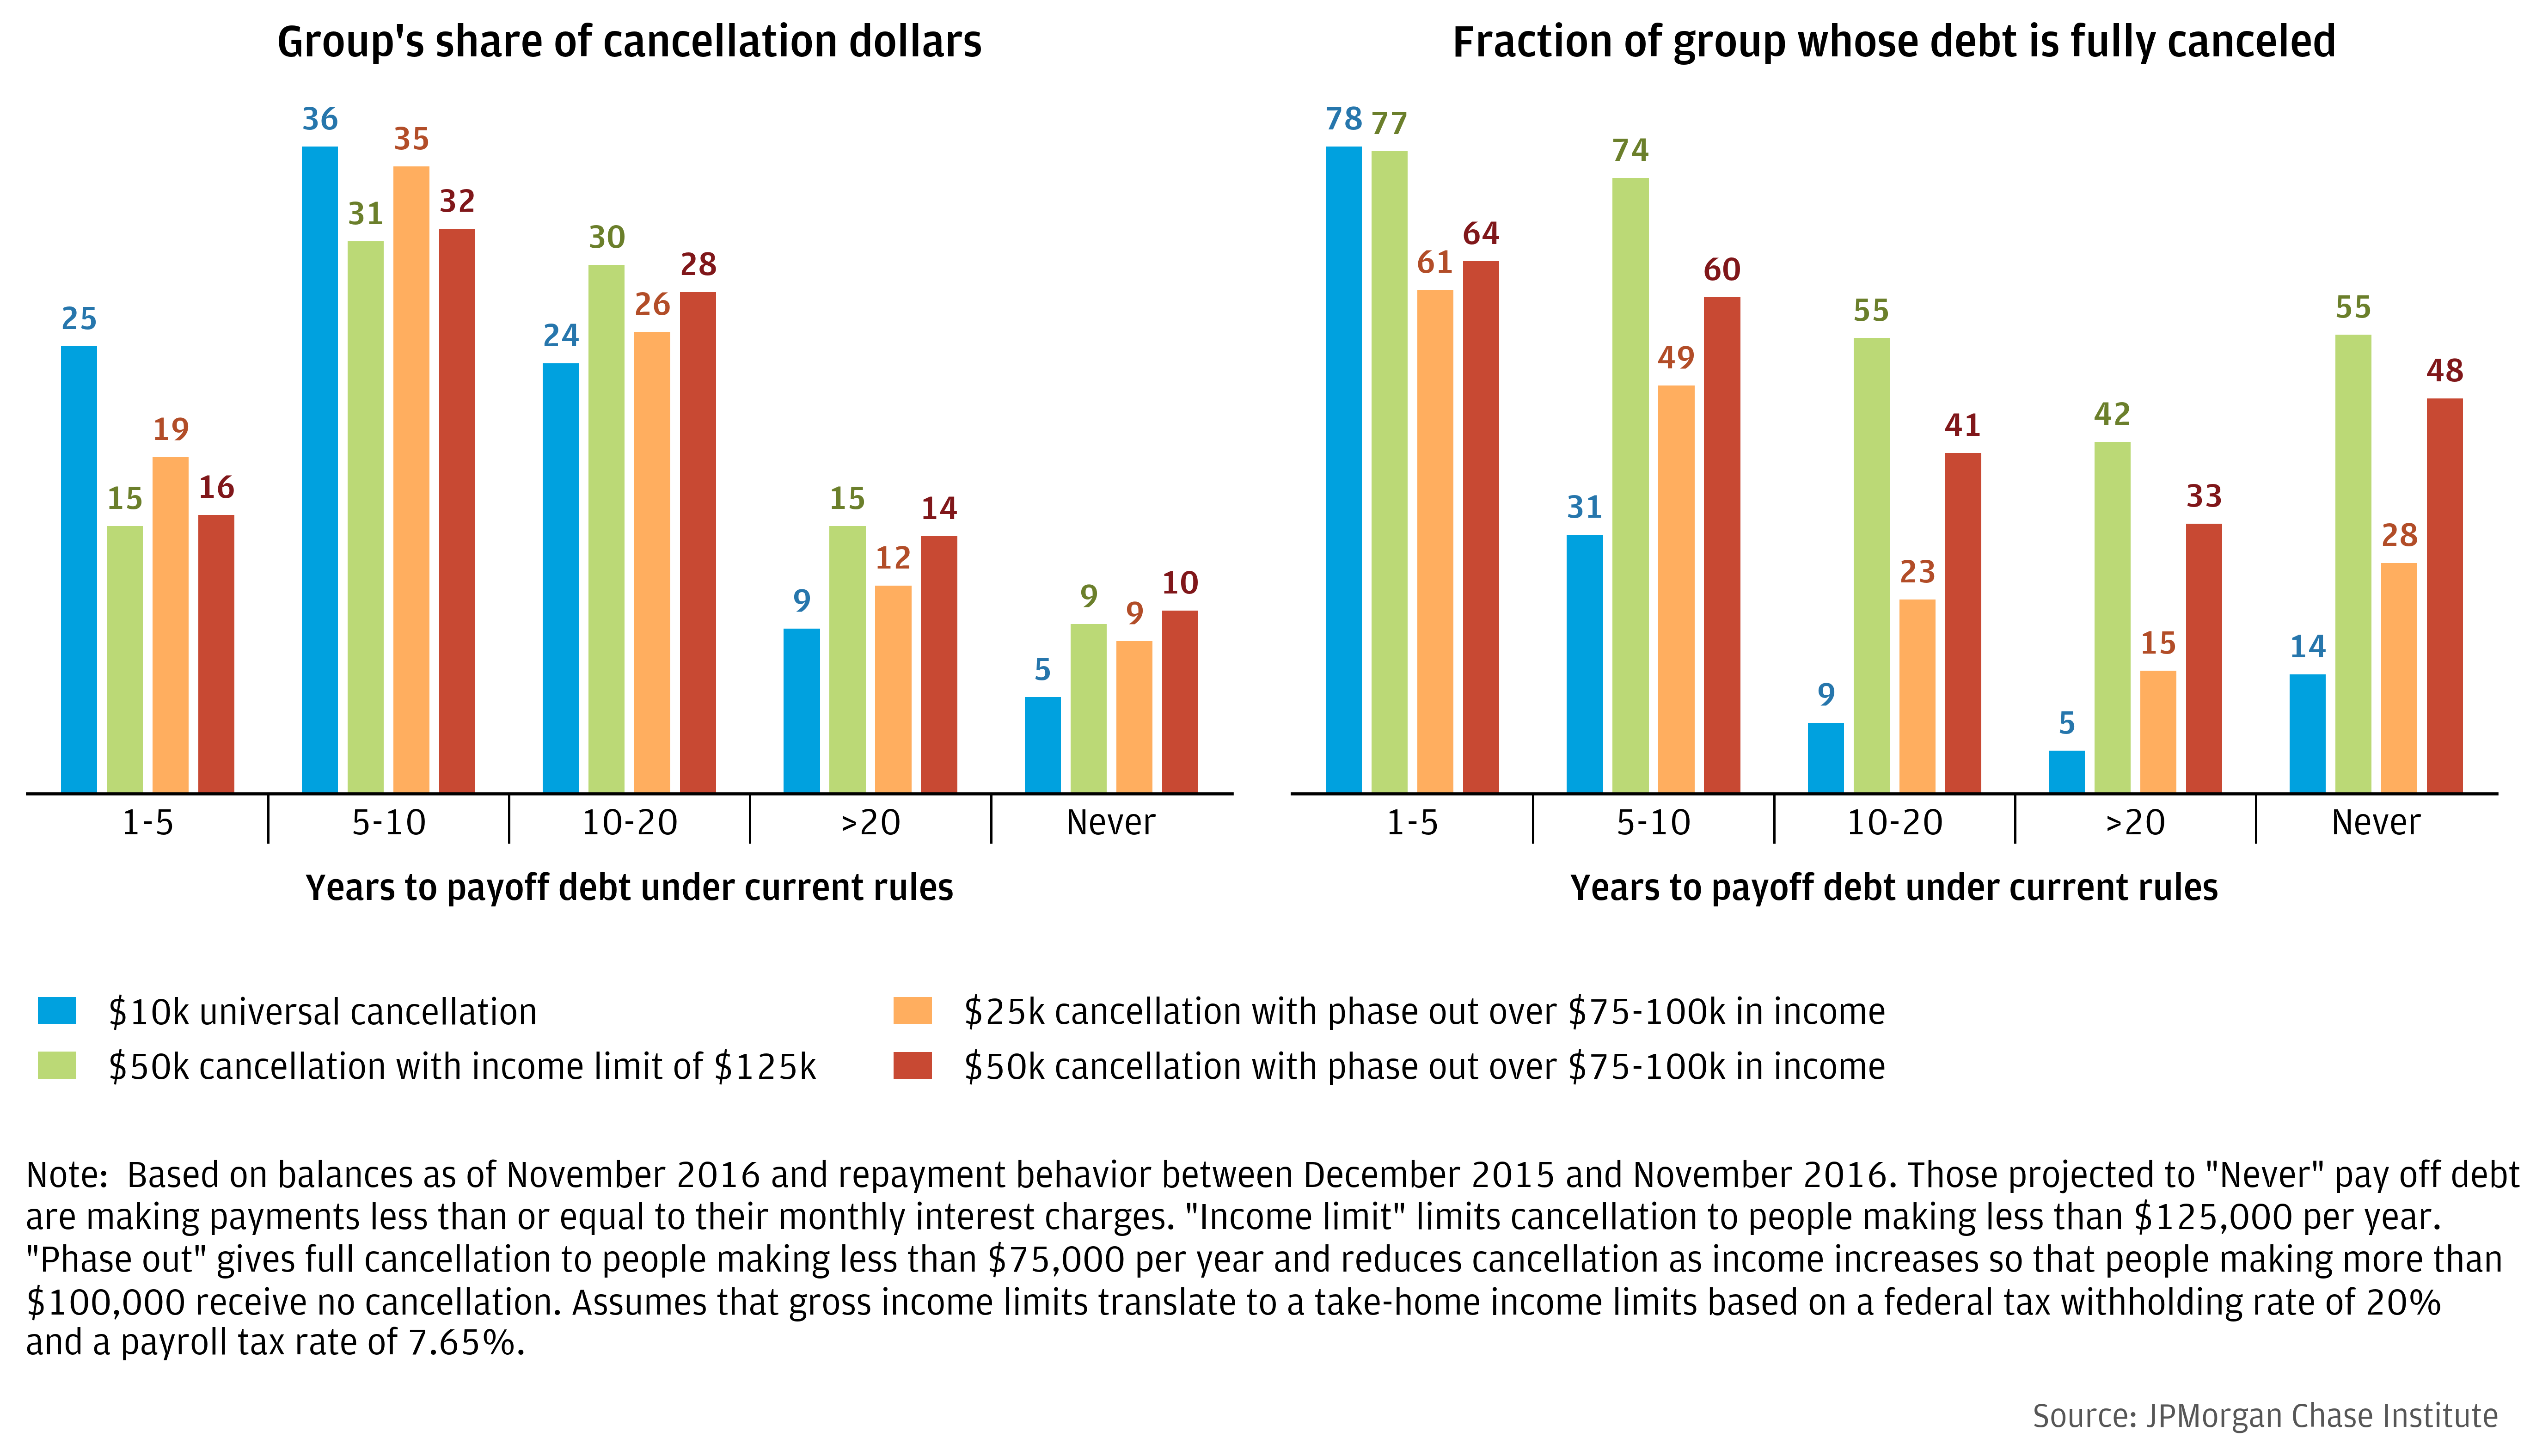
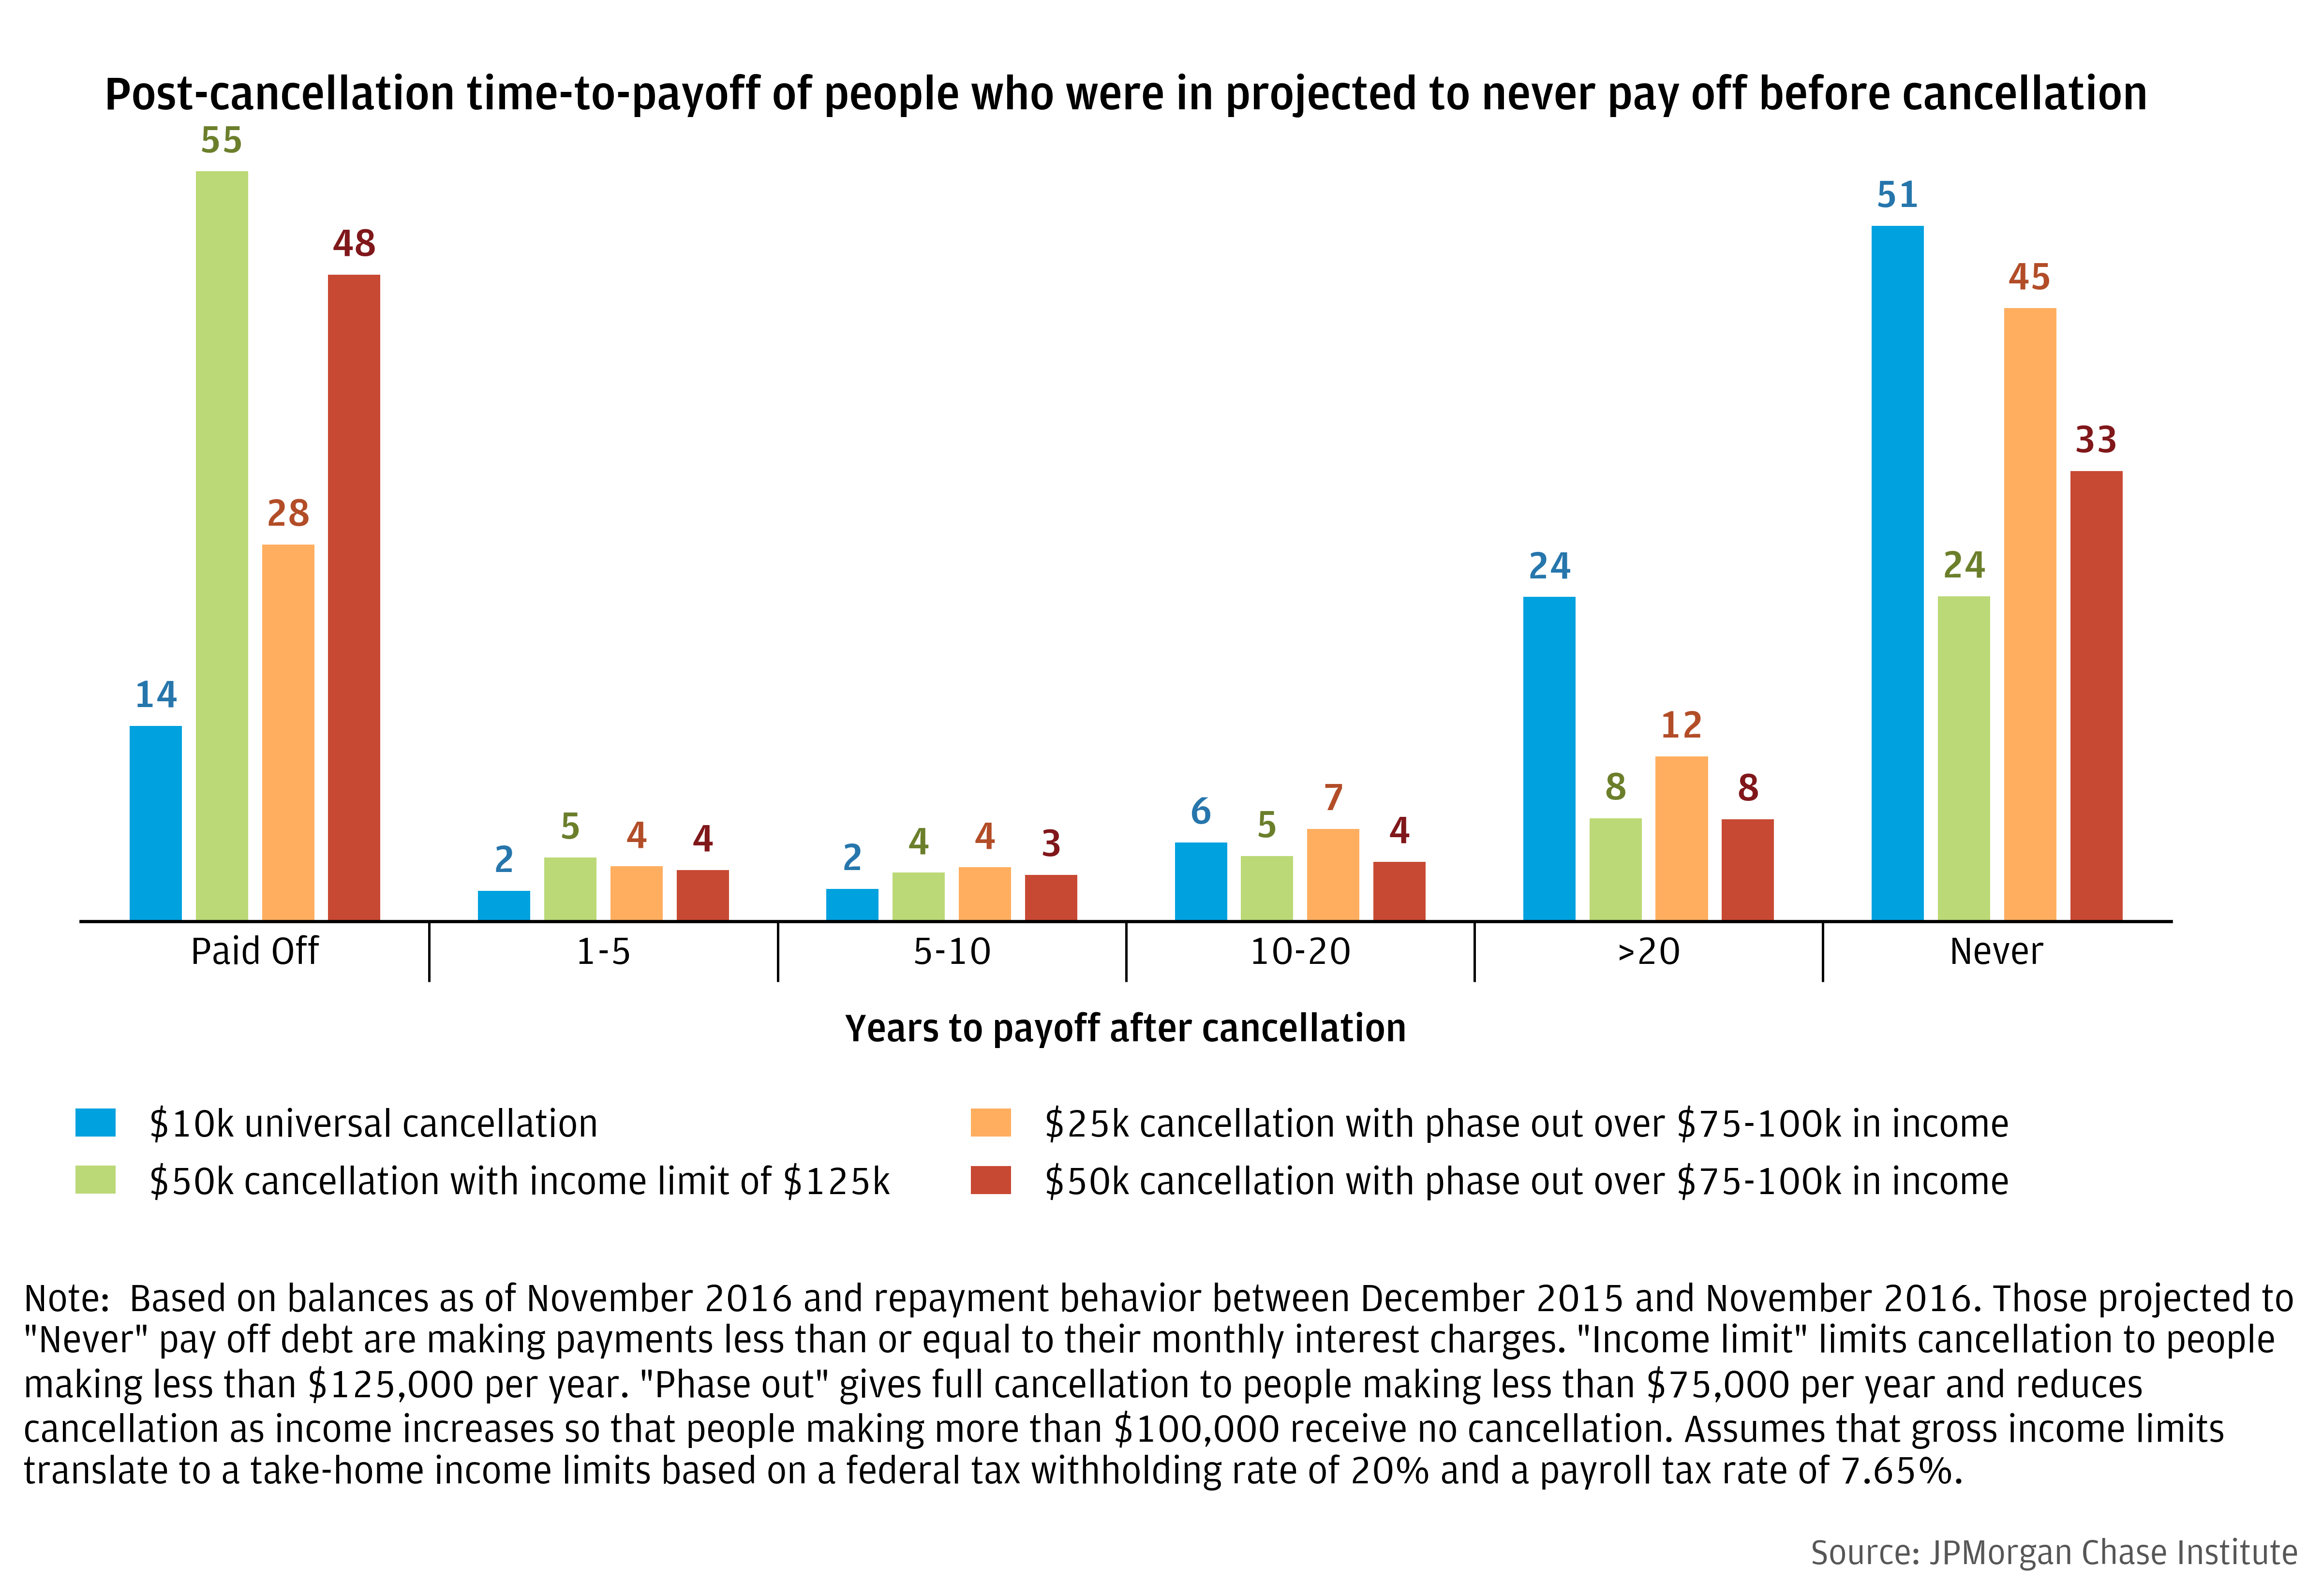
The right panel of Figure 4 shows what fraction of each pay off group has their debts completely forgiven and the patterns again reflect the fact that shorter pay off terms are correlated with smaller balances. The fraction of people in the “Never” category who receive complete forgiveness is of particular interest because nearly half of this group is making no debt payments. Figure 5 takes the “Never” group and calculates their new projected time to debt payoff after cancellation, assuming they continue their previous repayment behavior. The figure shows that most of this group either gets complete forgiveness or remains in the “Never payoff” category. This suggests that many of those projected to never pay off are facing circumstances, including potentially enrollment in an income-driven repayment program, that cause them to make no student loan payment at all. As such, unless forgiveness fully cancels their loan, they remain in a debt trap.
Figure 5: Projected time to pay off after cancellation for borrowers previously projected to never pay off debt
The left panel of Figure 6 shows the distribution of cancellation dollars by race and the right panel shows the fraction of each group that has their debt fully cancelled.11 All four of the scenarios are relatively similar, with no option pushing more of the cancellation dollar from one group towards another. The patterns in both panels of Figure 6 are driven by the distribution of student debt across and within racial groups, as shown in Figure 7.
Figure 6: Distribution of cancellation benefits by race
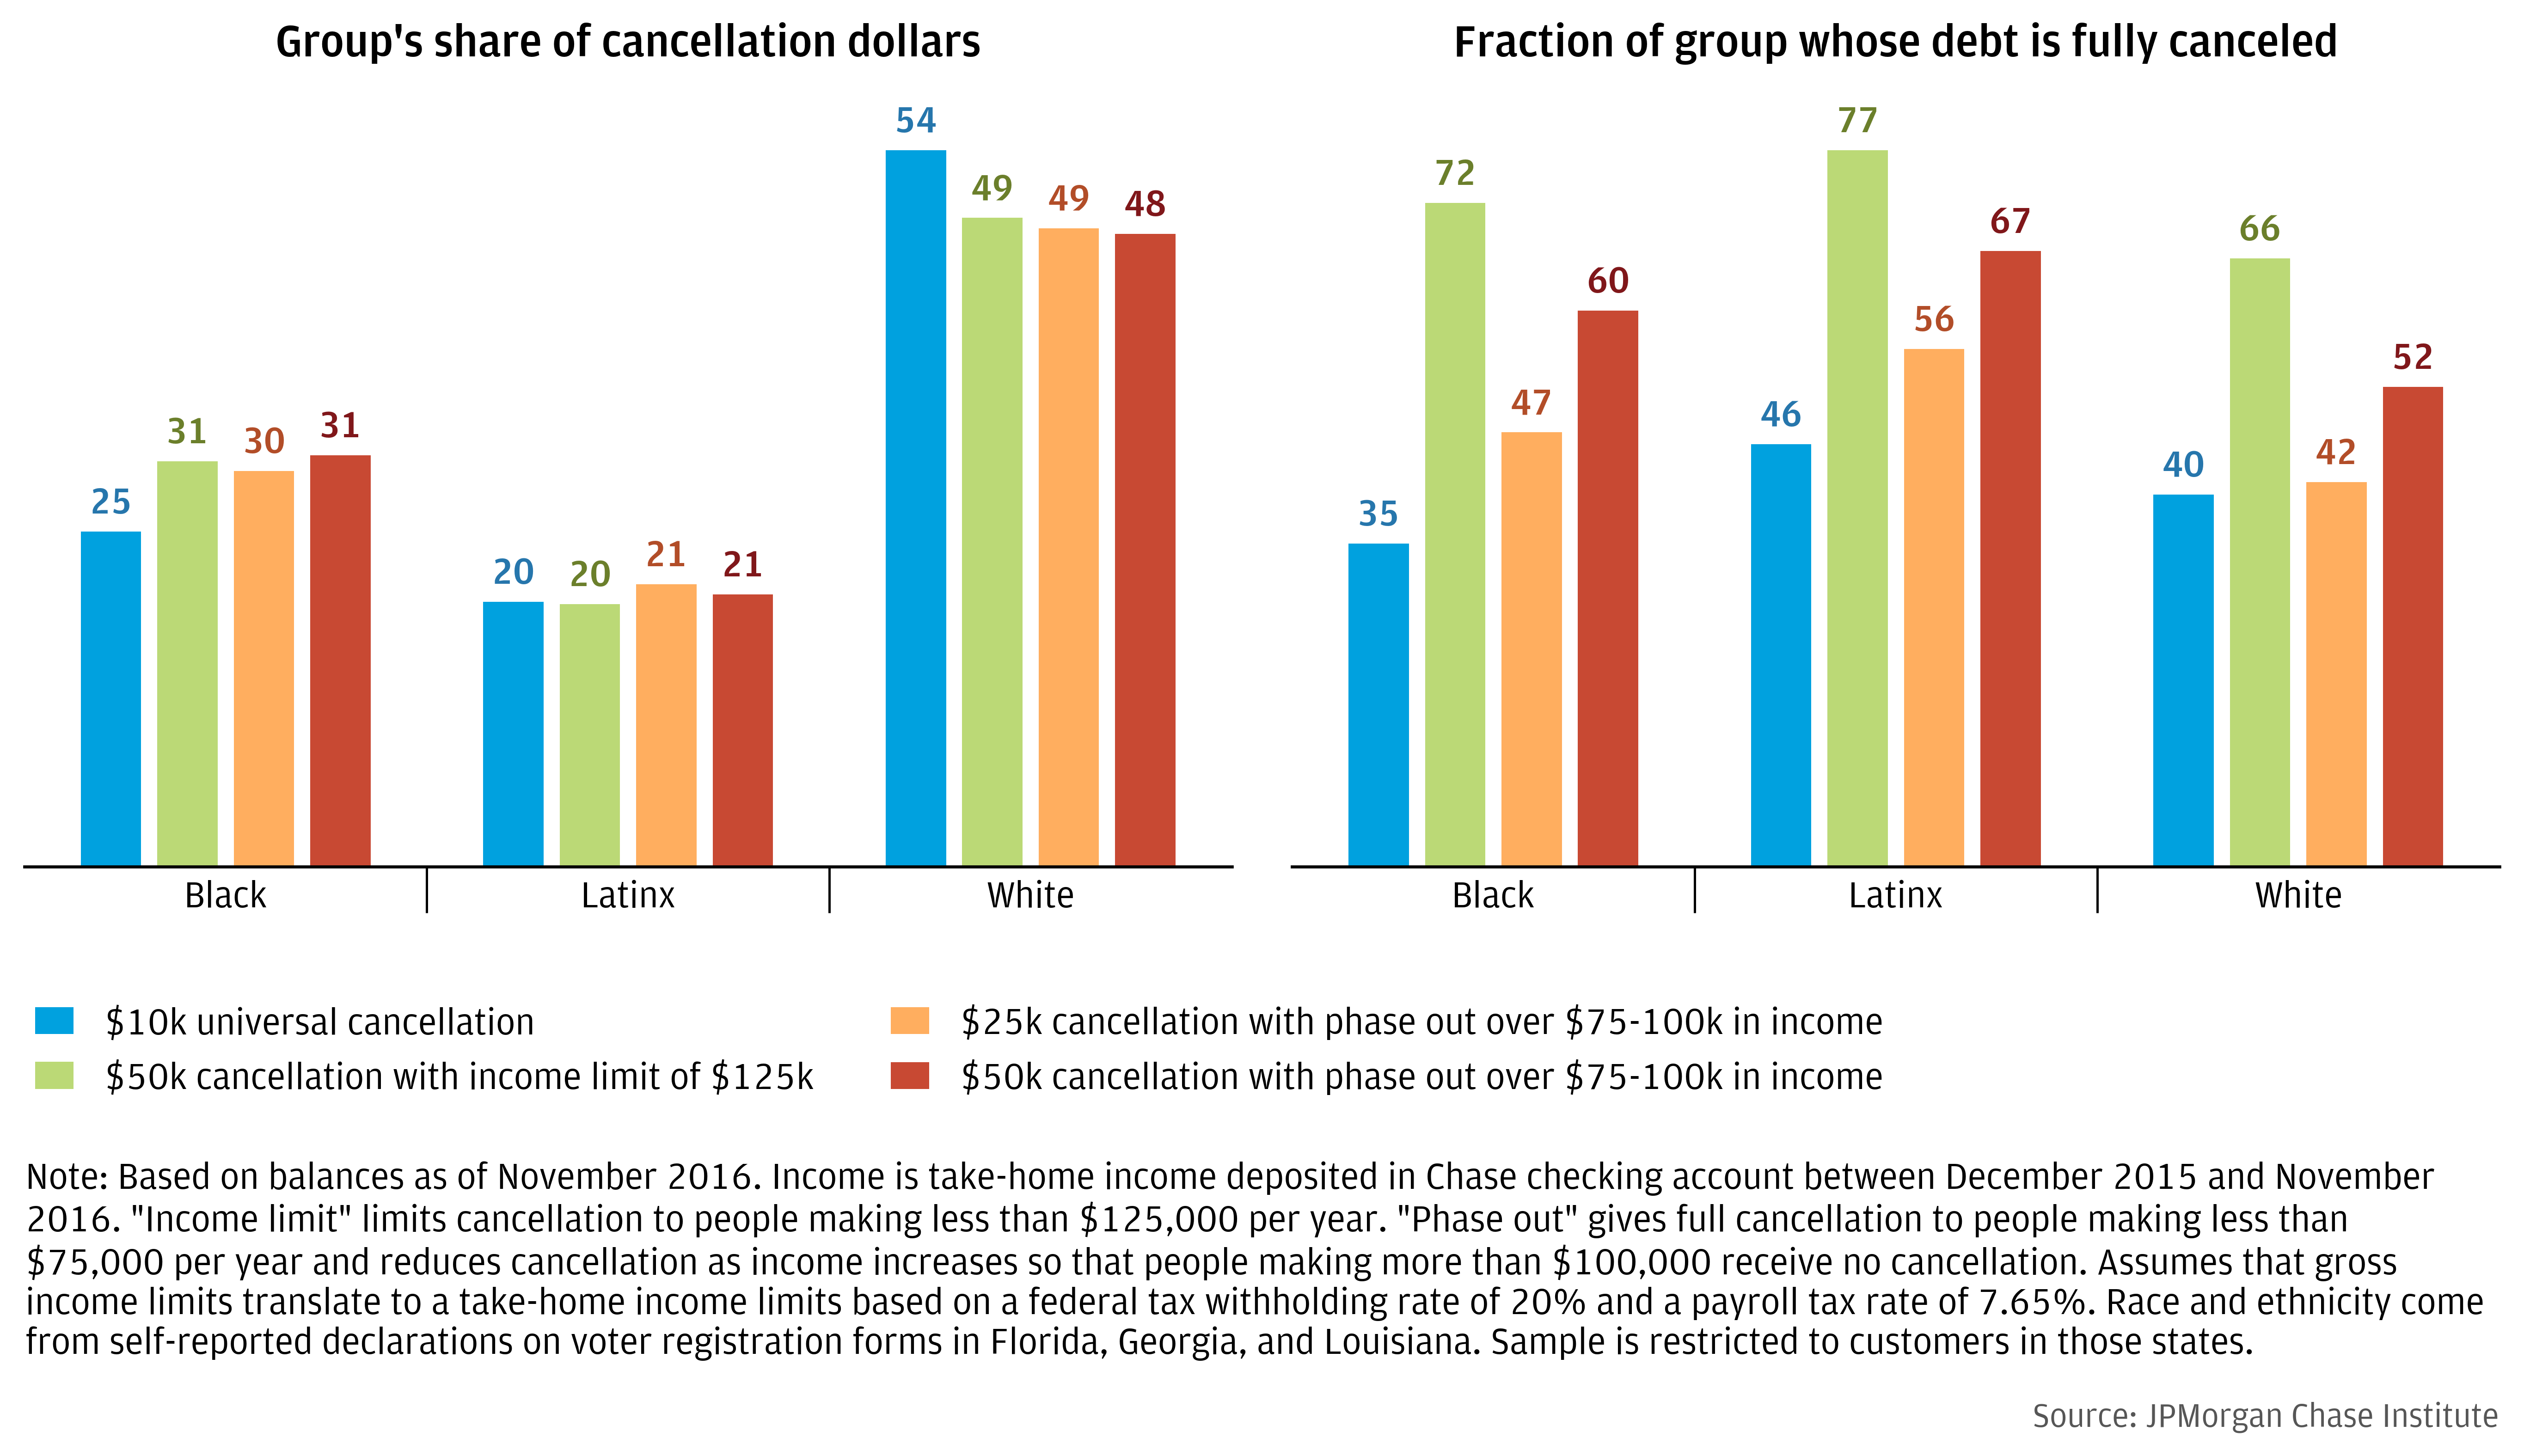
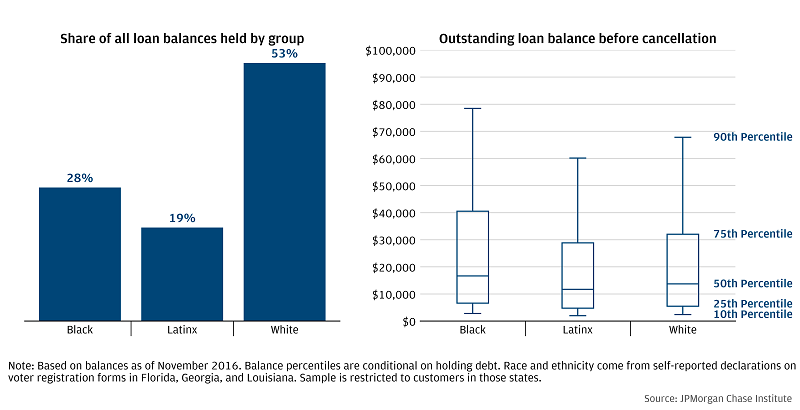
The left panel of Figure 7 shows how outstanding balances are distributed across Black, Latinx, and White borrowers and largely mirrors the pattern in the left panel of Figure 6. The right panel of Figure 7 shows the distribution of balances within each group and shows that while Black borrowers tend to have lower income than White borrowers, they also tend to have higher balances. It should be noted, however, that high balances among Black and White borrowers may arise for different reasons. Black borrowers are more likely to borrow more for a given degree, largely due to lower amounts of familial wealth (Nam et al. 2015; Farrell et al. 2020); White borrowers are more likely to attend more schooling, especially graduate and professional school. Furthermore, lower familial wealth among Black borrowers also results in worse repayment outcomes, even conditional income (Farrell, Greig, and Sullivan 2020). These dynamics mean that a student debt cancellation program, at least those considered here, may not be effective at narrowing the racial wealth gap. However, policy levers not considered here, such as interest forgiveness or making graduate school debt ineligible for forgiveness, may be more effective than income targeting alone.
Figure 7: Pre-cancellation student debt balances by race
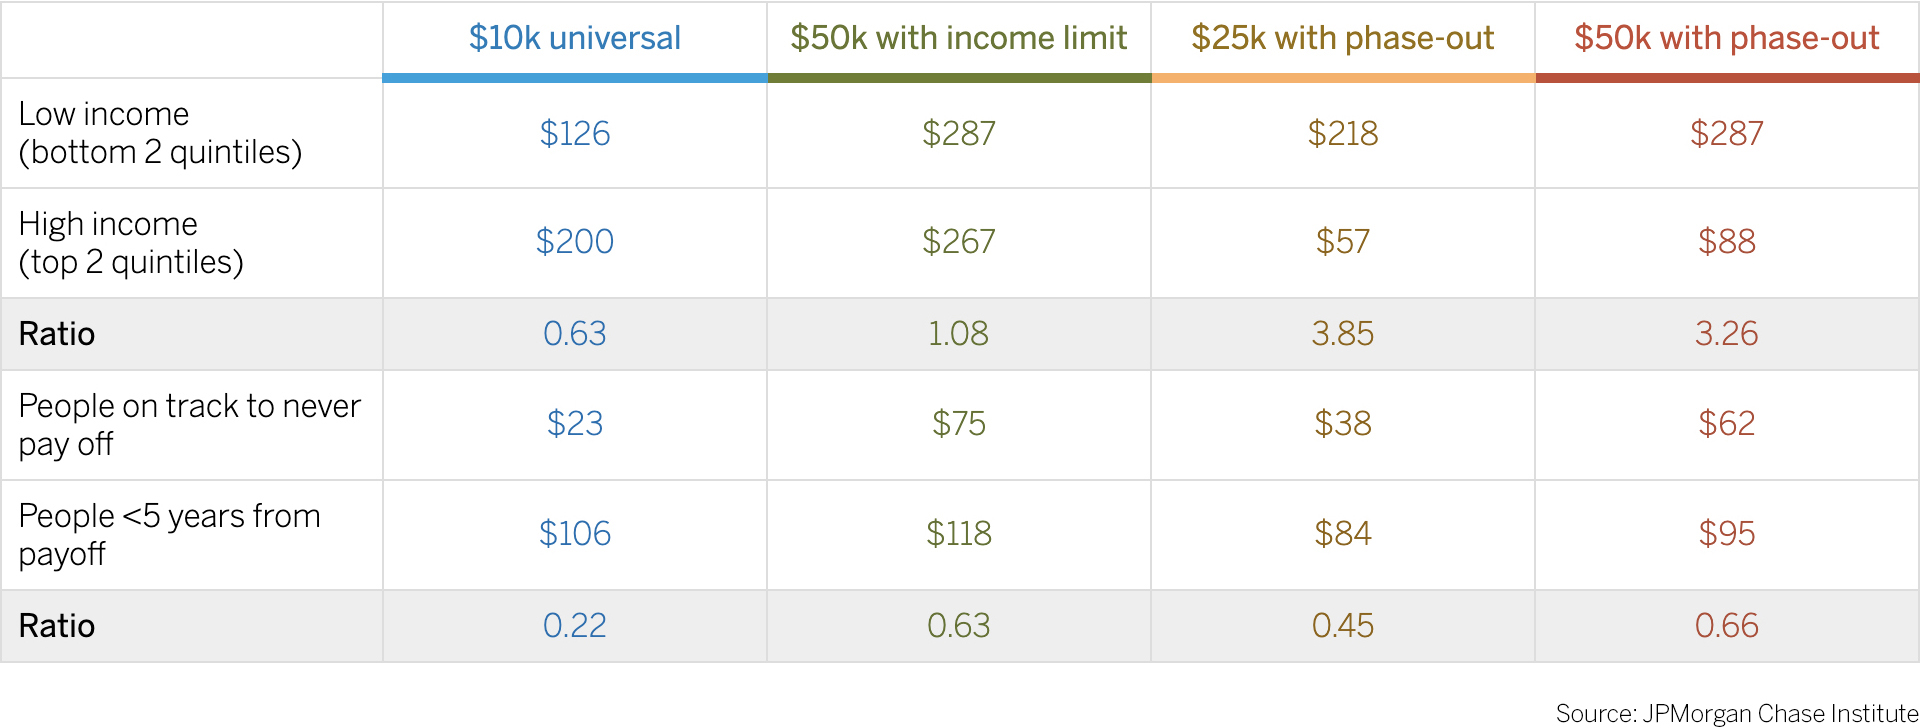
Combining the total costs of each cancellation option (Figure 1) and the distributional results (Figures 2 and 4), we can see how much debt is cancelled for low- versus high-income borrowers as well as people who are stuck in a debt trap versus those who are about to pay off their debt without cancellation. Table 1 shows how much each of these groups receives under each cancellation scenario. For example, the first row in the first column shows that low-income borrowers (those in the lowest two income quintiles) receive $126 billion in debt cancellation under a universal $10,000 plan. The cell beneath that shows that high-income borrowers (those in the top two income quintiles) receive $200 billion under the $10,000 plan. The third row is the first row divided by the second row and can be interpreted as how many dollars of forgiveness a low-income borrower receives per dollar of forgiveness received by a high-income borrower. The ratio of 0.62 in the first column implies that a low-income borrower receives $0.62 for every $1 received by high-income borrower. This is relatively low compared to, for example, the $25,000 plan (column 3), which gives low-income borrowers $3.85 per $1 given to high-income borrowers. Note also that both of the $50,000 plans give the same amount of forgiveness to low-income borrowers ($287 billion) because neither plan’s income limit binds for low-income borrowers. However, the $50,000 plan with the more aggressive phase out gives significantly less money to high-income borrowers, lowering the overall cost of cancellation and increasing progressivity.
The bottom half of Table 1 repeats this exercise by borrowers’ time to pay off debt rather than income. Recall that forgiving debt of people projected to never pay off their debt (row 4), especially those making zero payments, may carry lower cost to the government insofar as that debt may not ever be recovered. Conversely, forgiving the debts of people about to pay off their debt by making their scheduled payments carries a high cost to the government as those debts are very likely to be repaid.
Table 1: Total forgiveness received by a given group under each scenario (in billions)
1. Targeting student loan forgiveness to lower-income families increases the progressivity of this relief. Cancellation options that target relief to families earning less than $75,000 (with a phase out to $100,000) direct a much larger share of forgiveness dollars to low-income borrowers. For example, a program that cancels $25,000 of debt for borrowers earning less than $75,000 (phasing out to $100,000) cancels as much total debt as a universal $10,000 cancellation, but borrowers in the bottom 40 percent of the income distribution receive almost twice as much money.
2. Income targeting significantly reduces the cost of cancellation. A $50,000 cancellation for people earning less than $125,000 would cancel roughly $786 billion of debt. Changing this income limit to a phase-out between $75,000 and $100,000 in income reduces cancels only $606 billion, a reduction of 23 percent, and does not affect the amount of forgiveness received by low-income borrowers. Similarly, moving from a universal $10,000 plan to a phased-out $25,000 plan keeps overall costs the same while reducing the amount of money going to people on track to pay off their loans on time and increasing the amount of money going to those who are unlikely to ever repay their loans.
3. Additional targeting criteria besides income could also help direct more of the total forgiveness to those who need it most. While income targeting by its nature would make cancellation more progressive, the Department of Education may not have access to income information of its borrowers aside from those who are enrolled in income driven repayment programs. Income targeting would then require the government verify borrowers’ incomes or a change in law to access other government data, such as Internal Revenue Service data. Targeting loan forgiveness based on family income recorded in the FAFSA at the time of origination could be a proxy long-run familial wealth and the ability to repay of the borrower and the help they may receive with repayment. Farrell, Greig, and Sullivan (2020) document that 40 percent of people involved financially with student loans are making payments on someone else’s debt.
Additionally, targeting loan forgiveness to undergraduate debt or forgiving any accrued interest could alleviate debt burdens for those facing the most repayment difficulty. Indeed in our sample, roughly one in five borrowers is carrying accrued interest, suggesting that back interest may be a significant part of current student debt balances.12
4. Income-targeted forgiveness alone is unlikely to significantly affect the racial wealth gap. Black borrowers have disproportionately higher student debt balances relative to White borrowers and large balances occur within these groups for very different reasons. Current balances are determined by the amount of original debt as well as the pace of repayment. Due to differences in familial wealth documented by Farrell et al. (2020) and others, original debt is higher and repayment is slower among Black borrowers, even for high-income borrowers (Farrell, Greig, and Sullivan 2020). This means that more aggressive income targeting does not significantly change the share of cancellation dollars.
5. Debt cancellation may create moral hazard problems if people believe there will be future debt cancellations. If people believe debt could be forgiven in the future, they may change their behavior today, taking out more debt or repaying current debt more slowly than they would otherwise. A policy with a hard income limit may also induce people to adapt to the cut off—the limit could create a marginal incentive to reduce work or to cut reported income in other ways. However, a one-time cancellation based on already filed tax documents could lessen these problems, insofar as the government can convince the public the cancellation is a one-time action. However, if cancellation is not coupled with some reduction of the ongoing economic pressures that caused the accumulation of debt in the first place, claims of a “one-time” cancellation are less credible, increasing the chance of moral hazard problems.
6. One-time student loan forgiveness addresses the stock of student loan debt today but does nothing to reduce the amount of debt accrued tomorrow. As noted above, even in the most generous cancellation scenario, student loan debt would total over $900 billion, roughly on par with 2012 levels. Any economic forces that contributed to the current stock of student debt today, such as increasing tuition costs and increasing enrollment among low-income families, will continue to push tomorrow’s students to accumulate debt. Any long-term solution to relieving students is incomplete without addressing these underlying forces.
Amir, Elan, Jared Teslow, and Christopher Borders. 2020. “The MeasureOne Private Student Loan Report”. https://www.measureone.com/industry-report
Catherine, Sylvain, and Constantine Yannelis. 2020. “The Distributional Effects of Student Loan Forgiveness.” NBER working paper #28175. https://www.nber.org/papers/w28175
Department of Education. 2021. “Federal student loan portfolio.” https://studentaid.gov/data-center/student/portfolio
Farrell, Diana, Fiona Greig, and Daniel M. Sullivan. 2020. “Student Loan Debt: Who is Paying it Down?” JPMorgan Institute.Chase https://www.jpmorganchase.com/insights/all-topics/financial-health-wealth-creation/student-loan-debt.
Farrell, Diana, Fiona Greig, Chris Wheat, Max Liebeskind, Peter Ganong, Damon Jones, and Pascal Noel. 2020. “Racial Gaps in Financial Outcomes: Big Data Evidence.” JPMorgan Chase Institute. https://jpmorganchase.com/insights/all-topics/financial-health-wealth-creation/report-racial-gaps-in-financial-outcomes
Nam, Yunju, Darrick Hamilton, William Darity Jr, and Anne Price. 2015. “Bootstraps are for black kids: Race, wealth, and the impact of intergenerational transfers on adult outcomes.” Oakland, CA: Insight Center for Community Economic Development.
We thank our research team, specifically Bernard Ho and Malu Menon for their hard work and contributions to this research. Additionally, we thank Anna Garnitz and Sruthi Rao for their support. We are indebted to our internal partners and colleagues, who support delivery of our agenda in a myriad of ways, and acknowledge their contributions to each and all releases.
We would like to acknowledge Jamie Dimon, CEO of JPMorgan Chase & Co., for his vision and leadership in establishing the Institute and enabling the ongoing research agenda. We remain deeply grateful to Peter Scher, Head of Corporate Responsibility, Heather Higginbottom, President of the JPMC PolicyCenter, and others across the firm for the resources and support to pioneer a new approach to contribute to global economic analysis and insight.
Total debt owed to the federal government is $1.566 trillion (Dept of Education 2021). Debt owed to non-federal institutions, including private banks, is $139 billion (Amir, Teslow, and Borders 2020).
See recent reporting here: https://www.cnbc.com/2021/01/08/student-loan-forgiveness-could-be-more-likely-but-challenges-remain-.html
Beyond wholesale debt cancellation, a number of policies might be explored, such as expanding enrollment in income-driven repayment programs, expanding Pell grant access for current students, and reforming bankruptcy laws, the last of which has been proposed by Senators Warren, Leahy, and Whitehouse.
Our data asset includes checking account data—including incomes, asset balances, demographic information—for 220,000 de-identified Chase customers linked to Experian credit bureau records—including student loan balances and payment histories from 2016. This sample is restricted to people who are likely to use their Chase checking accounts as their main accounts. For example, they must deposit at least $12,000 of income into their accounts over our 12 month sample period. See Farrell, Greig, and Sullivan (2020) for details on sample construction. Our data for race and ethnicity is taken from public voter rolls in Florida, Georgia, and Louisiana, and all analyses of race effects are restricted to those states. See Farrell et al. (2020) for further discussion of that sample.
Note that the cost of forgiveness to the government is the forgone revenue that would have been collected on the forgiven debt and not the amount of debt that is forgiven. Cancelling debts of higher-income households who are making their scheduled payments incurs a higher cost (more forgone revenue) because they are more likely to repay the debt. Conversely, cancelling debts of borrowers who are not making payments incurs relatively little cost in the since there is no forgone revenue. Indeed, forgiving these borrowers’ debts could obviate the need for them to participate in income-driven repayment (IDR) programs, removing the administrative burden while providing instant financial relief. One may also consider the time-discounted or net-present value of debt to both the government and the borrower; however, for the sake of brevity, we consider only the amount of debt forgiven, not the net present value (see, e.g., Catherine and Yannelis 2020).
The voter registration forms in these states ask respondents if they identify as White, Black, Hispanic, or other. The use of a single question where respondents select one option is in line with how the Census asked about race and ethnicity in 1960 and 1970. However, it means that we are unable to separately analyze race and Hispanicity (e.g. we cannot distinguish Hispanic individuals who identify as White from Hispanic individuals who identify as Black). For this reason, we use the word “race” as a shorthand to describe responses to the question on the voter registration form, acknowledging that many people consider Hispanic identity an ethnic category and not a racial group. Furthermore, the voter registration data offers the choice “Hispanic”, but not “Chicana”, “Chicano”, “Cuban”, “Latina”, “Latino”, “Latinx”, “Mexican”, “Puerto Rican”, or other choices that voters might otherwise use to self-identify. We use the term “Latinx” in this report to refer to the group of respondents whose chose the “Hispanic” category, acknowledging that there is substantial variation in the way people choose to self-identify.
Here we say “progressive” in that more of the net benefits of the program being considered go to lower-income households.
Income quintiles are calculated using the full sample Chase–Experian as described in Farrell, Greig, and Sullivan (2020). That is, the income quintiles represent the distribution of income across the population and not the distribution of student debt holders alone. This more accurately reflects the distribution of cancellation benefits across society as a whole, rather than student debt holders only, whose income skew significantly higher than the overall population.
We calculate projected time to pay off using each borrower’s payment history in the last 12 months of our data, December 2015 to November 2016, the calculated interest rates for each loan, and the balance of each loan in November 2016. Note that because we do not observe whether borrowers are participating in an IDR program, some people classified as “Never” paying off may in fact have their debt forgiven after 20 years of successful participation in their program. See Farrell, Greig, and Sullivan (2020) for further details.
While the standard term for loan repayment is 10 years, people who refinance their debt can have terms up to 30 years, with longer repayment terms given to people with larger balances. Thus, people in the 10-20 year and greater than 20 year bins are a mix of people who are taking longer to repay their original loans—due either to delinquency or participation in an income-driven repayment (IDR) program—and people who refinanced their loans and are making payments as scheduled. Farrell, Greig, and Sullivan (2020) show that people in these payoff groups skew higher income, likely due to the presence of high-income and high-balance borrowers who have refinanced.
Information on borrower race is drawn from voter registration files in Florida, Georgia, and Louisiana, and all analyses on race are restricted to these states. See Farrell, Greig, and Sullivan (2020) for additional details on this sample.
Authors

Fiona Greig
Former Co-President
Daniel M. Sullivan
Consumer Research Director, JPMorganChase Institute