Findings

Even amidst strong macroeconomic conditions, families experience high levels of income volatility that have important implications for well-being. Previous JPMorgan Chase Institute research has shown that families cut consumption on everyday necessities when they experience job loss, and delay spending on healthcare and durable purchases until their tax refund arrives. A key reason for this is that they have an insufficient liquid cash buffer. Families with limited liquid assets are dramatically less likely to smooth consumption in the face of income fluctuations.

It stands to reason then that racial gaps in liquid assets and wealth could result in racial differences in consumption smoothing. Longstanding gaps in income and wealth between White families and Black and Hispanic families have been well documented and have only grown following the Great Recession. What are the downstream consequences of these racial gaps in financial circumstances, particularly when families’ incomes fluctuate on a day-to-day and month-to-month basis?

This report provides a first-ever high-frequency look at racial gaps in liquid assets, take-home income, and families’ consumption response to income volatility from the vantage point of a novel de-identified data source: administrative banking data paired with self-reported race information. We matched Chase banking records with 2018 voter registration records in the states that had Chase branches in 2018 and that, under the Voting Rights Act, collect race information during voter registration.

This match yielded a large sample of 1.8 million families for whom we observe the race of the primary account holder along with other demographic characteristics, and a high-frequency, integrated view of income, spending, and liquid assets. This sample is broadly representative of the respective income distributions of Black, Hispanic, and White registered voters nationally and provides a reliable window into racial gaps in financial outcomes compared to benchmarks.

We used administrative banking data paired with self-reported race infor­mation. We matched Chase banking records with 2018 voter registration records in the states that had Chase branches in 2018 and that, under the Voting Rights Act, collect race information during voter registration. This match yielded a large sample of 1.8 million families for whom we observe the race of the primary account holder along with other demographic characteristics, and a high-frequency, integrated view of income, spending, and liquid assets. This sample is broadly represen­tative of the respective income distributions of Black, Hispanic, and White registered voters nationally and provides a reliable window into racial gaps in financial outcomes compared to benchmarks.

We used administrative banking data paired with self-reported race infor­mation. We matched Chase banking records with 2018 voter registration records in the states that had Chase branches in 2018 and that, under the Voting Rights Act, collect race information during voter registration. This match yielded a large sample of 1.8 million families for whom we observe the race of the primary account holder along with other demographic characteristics, and a high-frequency, integrated view of income, spending, and liquid assets. This sample is broadly represen­tative of the respective income distributions of Black, Hispanic, and White registered voters nationally and provides a reliable window into racial gaps in financial outcomes compared to benchmarks.

With this new data asset, we answer three key questions in this report. First, how large are the racial gaps in take-home income and liquid assets among Black, Hispanic, and White families and to what extent do they persist after accounting for other demographic factors? Second, are there racial differences in how much families smooth their consumption? We examine changes in everyday spending in response to two different sources of income volatility: involuntary job loss identified through the receipt of unemployment insurance benefits, a negative cash-flow event; and the arrival of a tax refund, a positive cash-flow event. Third, to what extent do racial gaps in liquid and financial asset buffers account for racial differences in families’ consumption response to job loss and tax refunds?

01

Median Black and Hispanic families earn roughly 70 cents in take-home income for every dollar earned by White families, and racial gaps in earnings are largest for higher-income and older account holders.

Black-White and Hispanic-white ratios of annual take-home income (2018), by group-specific decile of take-home income

Line graph showing Black-White and Hispanic-White ratios of annual take-home income in 2018, by group-specific decile of take-home income. For every dollar earned by the 90th percentile White family, the 90th percentile Black family earns just 60 cents and the 90th percentile Hispanic family earns 68 cents. Racial gaps in take-home income exist at all rungs of the income ladder and decline continuously with income levels.

Source: JPMorgan Chase Institute

We measure the racial gap as the ratio of the take-home income for Black and Hispanic families, respectively, relative to White families, where race refers to the race of the primary account holder. Given that these measures are expressed as ratios, a ratio of 1.0 represents parity, and a lower ratio represents a larger racial gap.

01

Racial gaps in liquid assets are twice as large as gaps in take-home income. They persist across the income spectrum and are widest in the 65+ age cohort.

Black-White and Hispanic-White ratios of liquid assets (2018), by age

Bar chart showing the Black-White and Hispanic-White ratios of take-home income in 2018 by age. Racial gaps in liquid assets are twice as large as gaps in take-home income and are the widest in the 65+ age cohort. The Black-White ratio for this cohort is .27 and the Hispanic-White ratio for this cohort is .26.

Source: JPMorgan Chase Institute

01

Black women face the greatest gap in take-home income and liquid assets compared to White men, but racial gaps are larger among men than women.

Black-White and Hispanic-White ratios of median liquid assets (2018), by gender

Bar chart showing the Black-White and Hispanic-white ratios of median liquid assets in 2018 by gender. Black women face the greatest gap in liquid assets compared to white men at 0.26. For Black men, the ratio of median liquid assets as compared to White men is 0.29, while for Hispanic men it is 0.45. Controlling for gender, racial gaps are larger among men than women, however. For example, the Black-White ratio of median liquid assets for Black women compared to White women is 0.36.

Source: JPMorgan Chase Institute

01

Across geographies, the financial outcomes of Hispanic families vary the most, while the financial outcomes of Black families vary the least. Black-White gaps in financial outcomes are largest in Louisiana, while Hispanic-White gaps are largest in Florida.

Black-White and Hispanic-White ratios of annual median liquid assets (2018), by geography

Horizontal bar chart showing the Black-White and Hispanic-White ratios of median liquid assets in 2018 by geography: Florida, Georgia, and Louisiana, including the metro areas of Miami, Orlando, Tampa, Atlanta, New Orleans, and Baton Rouge. Black-White gaps in financial outcomes are the largest in Louisiana, at .27 while Hispanic-White gaps are largest in Florida at .36.

Source: JPMorgan Chase Institute

01

After involuntary job loss, Black and Hispanic families cut their everyday spending more so than White families, differences that are explained by racial gaps in liquid and financial asset buffers.

Ratio of non-durable spending to five months prior to first Unemployment Insurance (UI) receipt

Line graph showing the ratio of nondurable spending to five months prior to first Unemployment Insurance (UI) receipt. A dollar drop in income led to a 46 cent drop in nondurable spending among Black families and a 43 cent drop among Hispanic families compared to a 28 cent drop for White families.

Source: JPMorgan Chase Institute

01

Upon receipt of a tax refund, Black and Hispanic families increase their expenditures more so than White families, differences that are explained by racial gaps in liquid and financial asset buffers.

Cumulative increase in expenditures as a share of tax refund (Marginal Propensity to Consume)

Line graph showing cumulative increase in expenditures as a share of tax refund, also known as Marginal Propensity to Consume. Thirty days after receiving the tax refund, Black and Hispanic families had spent roughly 50 percent of the refund. White families had spent 38 percent of the refund.

Source: JPMorgan Chase Institute

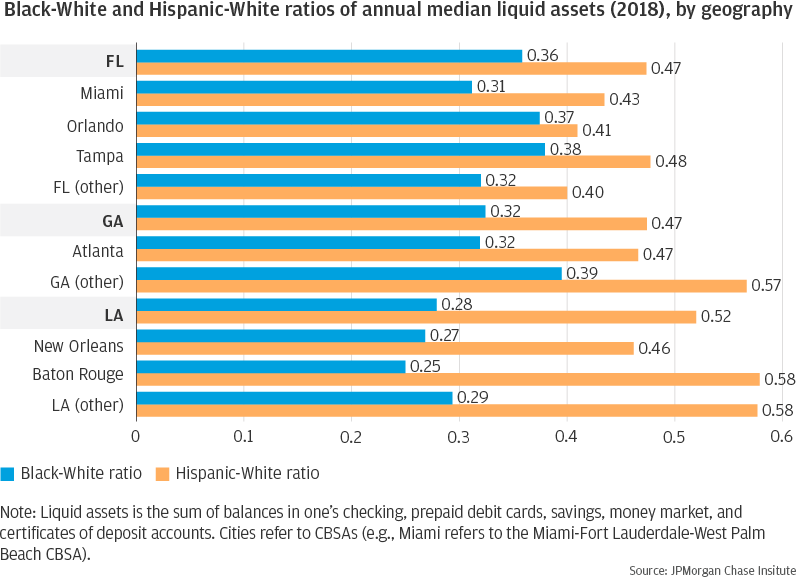
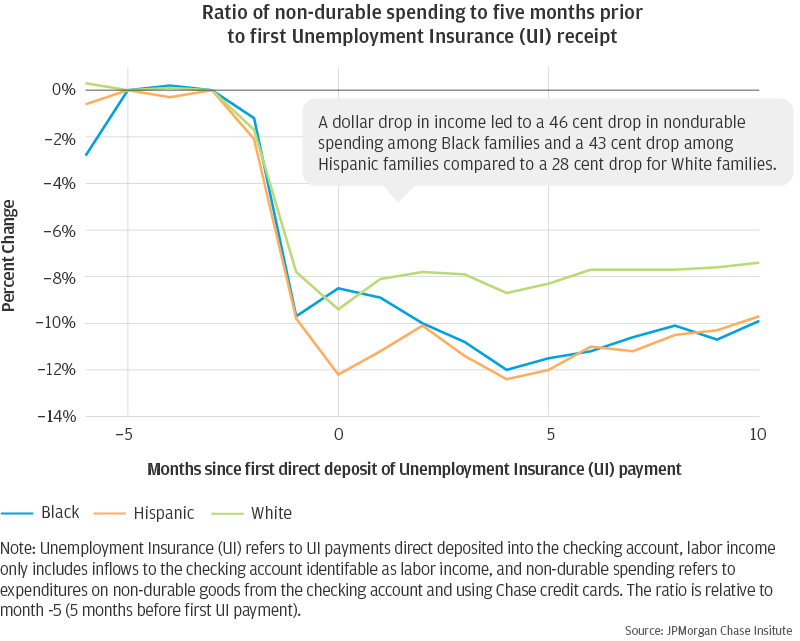
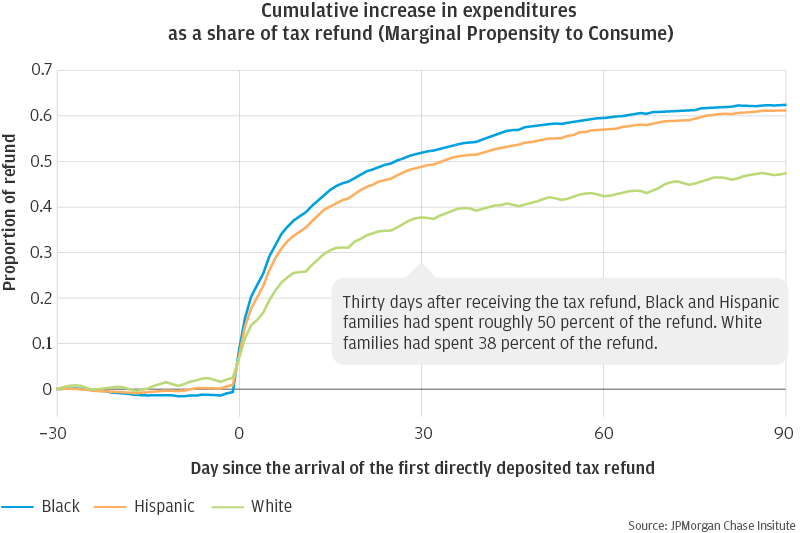
In conclusion, we find large racial gaps in take-home income and liquid assets which persist across age, income, gender, and geography. The racial gap in liquid assets makes Black and Hispanic families more vulnerable to income fluctuations. Families with lower liquid asset buffers—disproportionately Black and Hispanic families—cut their consumption to a greater extent when they experience involuntary job loss and increase their consumption to a greater extent when they receive a tax refund. However, racial gaps in consumption smoothing disappear when we account for the racial gaps in liquid and financial asset buffers.

These findings have important implications for public policy and the distributional impacts of policy interventions. They raise broader questions about how to reduce financial volatility and increase liquid assets for low-income families and, importantly, address the structural factors that contribute to racial gaps in income and assets.

Efforts to reduce income volatility, particularly among low-income families, may include expanding unemployment insurance benefits and ensuring access to workplace benefits and protections such as paid sick and family leave and a predictable work schedule. They could also include distributing tax credits and withholdings throughout the tax year.

In addition, we must consider ways to help families manage financial volatility. We estimate that a liquid asset buffer of roughly $5,000 to $6,000—as a form of “private insurance”—might enable Black and Hispanic families to sustain their typical consumption levels through a job loss or major cash-flow event. This is considerably more than the $1,000 to $1,500 that the median Black and Hispanic family in our sample currently has. Thus, a key question is how to support families in building these liquid assets.

Policies and programs that boost income and address the underlying challenges Black and Hispanic families face within the labor market could help to close racial gaps in income in the short-run. These could include increasing the minimum wage, strengthening the Earned Income Tax Credit, investing in job training programs, and reducing the barriers to employment for individuals with criminal backgrounds.

To close the racial gap in liquid assets, which is much larger, we also need stronger programs, policies, and innovations to both reduce expenses that disproportionately burden Black and Hispanic families and promote asset building among low-income families. These might include efforts to make housing, high-quality childcare, and higher education more affordable as well as employer- and government-sponsored supports for asset building.

The private, nonprofit, and government sectors all have important roles to play as policymakers, service providers, and employers in closing racial gaps in income and wealth. Our research shows the importance of disaggregating economic and financial statistics by race and measuring these statistics at a high frequency. Doing so can help shed light on the factors that contribute to racial differences in financial outcomes and instruct us on how to design more efficient and equitable policies.

Authors

Diana Farrell

Founding and Former President & CEO

Fiona Greig

Former Co-President

Chris Wheat

President, JPMorganChase Institute

Max Liebeskind

JPMorgan Chase Institute, Consumer Research Associate

Peter Ganong

Assistant Professor at the University of Chicago Harris School of Public Policy

Damon Jones

Associate Professor at the University of Chicago Harris School of Public Policy

Pascal Noel

Neubauer Family Assistant Professor of Finance at the University of Chicago Booth School of Business