
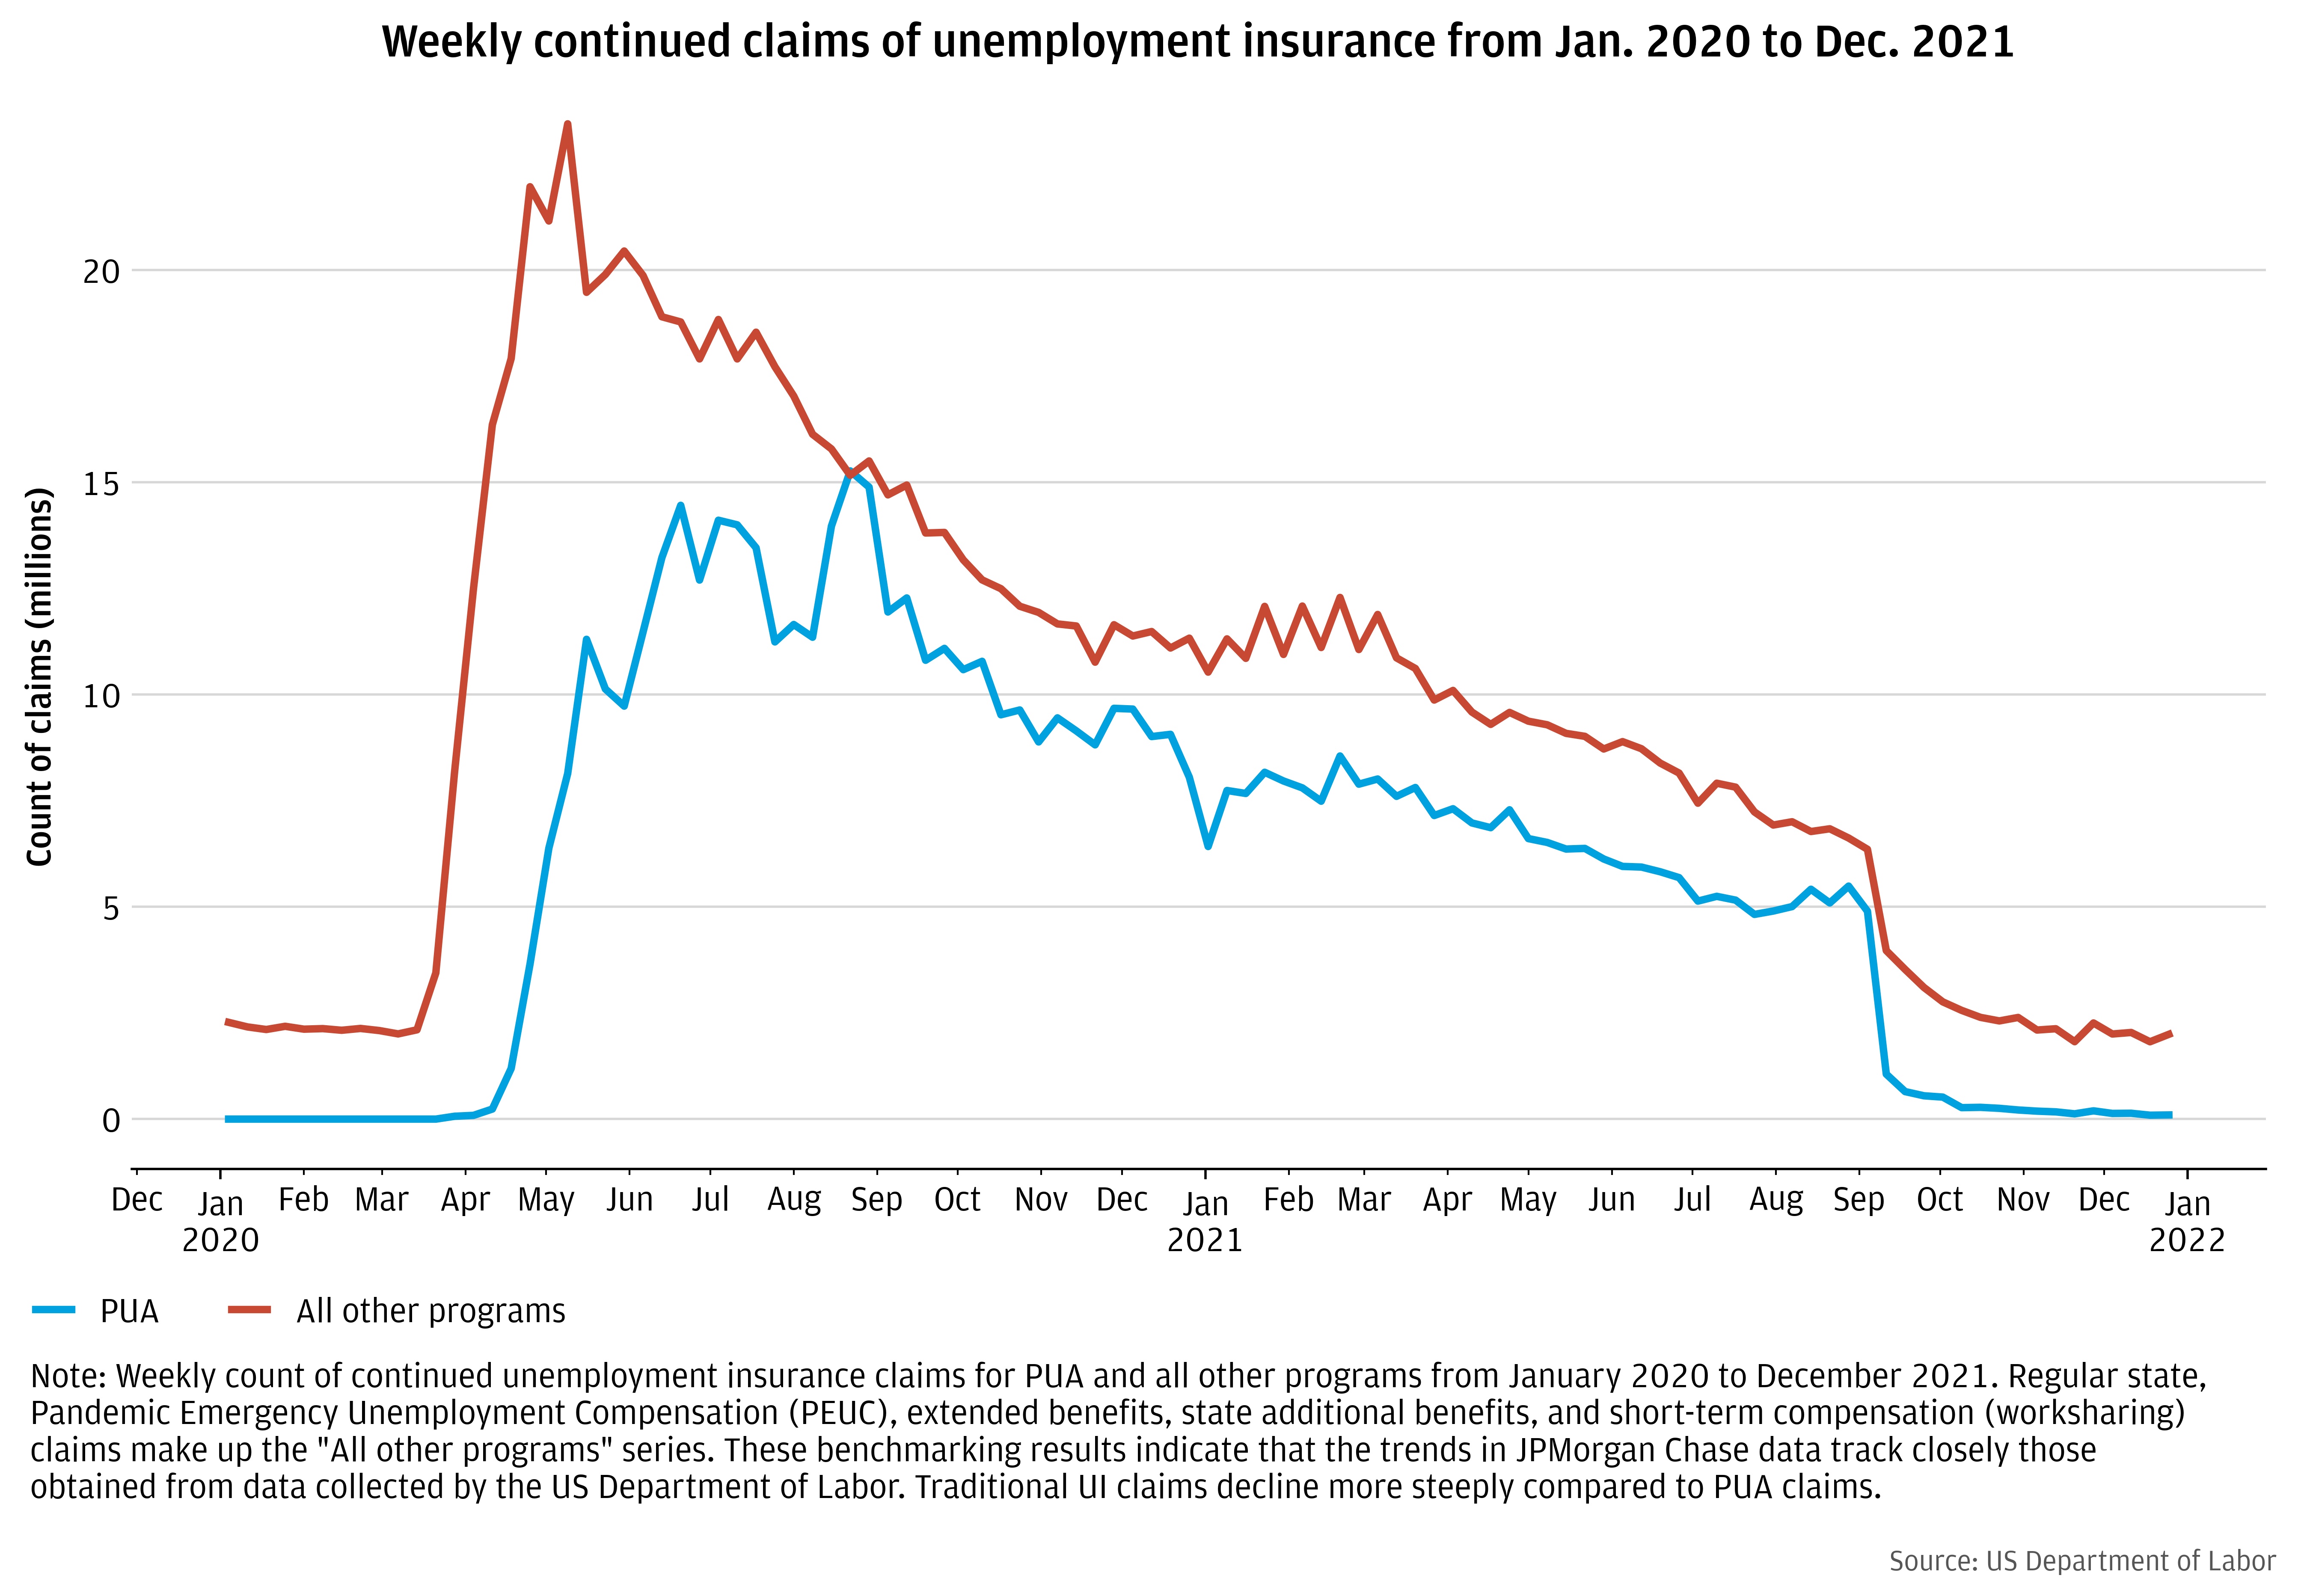
Figure 1: Continuing unemployment insurance claims in all programs, 2020-2021

Creating thriving communities together
See how our clients and partners—from small business owners to workforce training leaders—work with JPMorganChase to drive meaningful impact and economic growth where they live and work.
Learn moreLatest news

Veteran’s Unconventional Path to Landing her Dream Job in Tech
U.S. Army Veteran Ashley Wigfall transitioned to a civilian role and charted her path to technologist through mentorship and skills training at the JPMorgan Chase tech hub in Plano, Texas.
Learn more
In response to the COVID-19 pandemic, the U.S. government implemented the largest expansion in eligibility to federal Unemployment Insurance (UI) benefits in history through the creation of the Pandemic Unemployment Assistance (PUA) program. This program expanded eligibility to self-employed workers, gig workers, independent workers and others not previously eligible for UI or who were unable to work for a variety of COVID related reasons.1 Once implemented, the PUA program accounted for roughly 40 percent of total claims through expiration (Figure 1) and $80 Billion (20%) of the $400 Billion spent on UI expansions in 2020 (DOL IG, 2021).
The PUA program officially ended on September 6, 2021, and 21 states opted to terminate the program in June or July of 2021. When the Omicron surge hit the U.S. in December 2021, it resulted in disruptions in dependent care, widespread quarantines, and a return of virtual school or school cancellations for many children. According to the U.S. Census Household Pulse Survey, the number of individuals who reported not working due to having or caring for someone with COVID-19 increased from 3 million in the first half of December 2021 to almost 9 million between December 29 2021 and January 10 2022, the highest level ever recorded by the survey. With PUA no longer in place in 2022, workers had fewer means of receiving income supports if they lost earnings as a result of these circumstances.
What policy lessons can be learned from the “PUA experiment” for policymaking going forward? Specifically, the PUA program marked an important departure in the UI eligibility framework. States would normally rely on employers to verify whether a worker is ineligible for UI if they were fired for cause, did not respond to a recall, or started working in a new job. The PUA program enabled self-employed and other workers to become eligible for UI for many reasons beyond involuntary job loss. The central question when evaluating the PUA program – what was the tradeoff between expanding benefit eligibility versus work disincentive effects or overpayments, as compared to traditional UI recipients?
Figure 1: Continuing unemployment insurance claims in all programs, 2020-2021
In this brief we highlight two findings. First, the PUA program was successful in increasing access to benefits and insuring against income losses for workers on the margins of the labor market. Second, we do not see clear evidence that PUA recipients exhibited greater work disincentives than did traditional UI recipients.
We conclude reforming UI to more permanently broaden eligibility warrants consideration. A key challenge states faced during the rollout of these income supports is that they were establishing an entirely new program amidst peak claims volume. Thus, keeping a version of PUA permanent has the important benefit of allowing states time to establish protocols and enhance systems to accommodate populations of uncovered workers in non-peak times.
The PUA program marked a significant expansion in the UI eligibility framework. PUA provided benefits to individuals who were not otherwise eligible for traditional UI benefits, including the self-employed, those seeking part-time employment, and those lacking sufficient work history. It was generally not payable to individuals able to telework or who were receiving paid leave, but it did qualify individuals unable or unavailable to work for a variety of COVID-19 related reasons. These included instances where the worker or her family member was diagnosed with COVID-19, had primary caregiving responsibility for a member of the household as a result of COVID-19, or became the primary source of income if the primary breadwinner died due to COVID-19. It remains unclear exactly which types of PUA eligibility were most common. DOL data suggest that the share of eligible claimants who were self-employed was 41 percent in 2020 and 49 percent in 2021. Bell et al (2021a) report that most PUA recipients in California were self-employed. Given the many non-work-related reasons one could become eligible for PUA, this is critical to evaluating work disincentive effects of this program.
Other key design questions were whether and how to verify income and set benefit levels. As mentioned above, PUA represented a meaningful departure in the previous policy framework insofar as it did not require third party (i.e. employer) verification of prior earnings or eligibility; it relied on the applicant to provide documentation.2 PUA claims were meant to document ineligibility for traditional UI on the application, and many states did so by requiring workers to first apply for (and be denied) traditional UI benefits before applying for PUA.
As for benefit levels, rather than receive a flat benefit, PUA recipients were required to provide documentation to verify their income. This determined their weekly benefit amount, subject to the state minimum benefit level. All told, the PUA program dramatically expanded UI eligibility insofar as it represented roughly 40 percent of total UI claims. Who benefited from this program and what was the impact?
It is worth underscoring that there is little empirical evidence on the impacts of PUA program. The JPMorgan Chase Institute data was able to distinguish between the PUA and UI in a handful of states that paid out the benefits via separate channels (i.e. they carried different transaction descriptions when directly deposited into bank accounts).3 The California Policy lab was also able to distinguish between traditional UI and PUA recipients in administrative California state data.
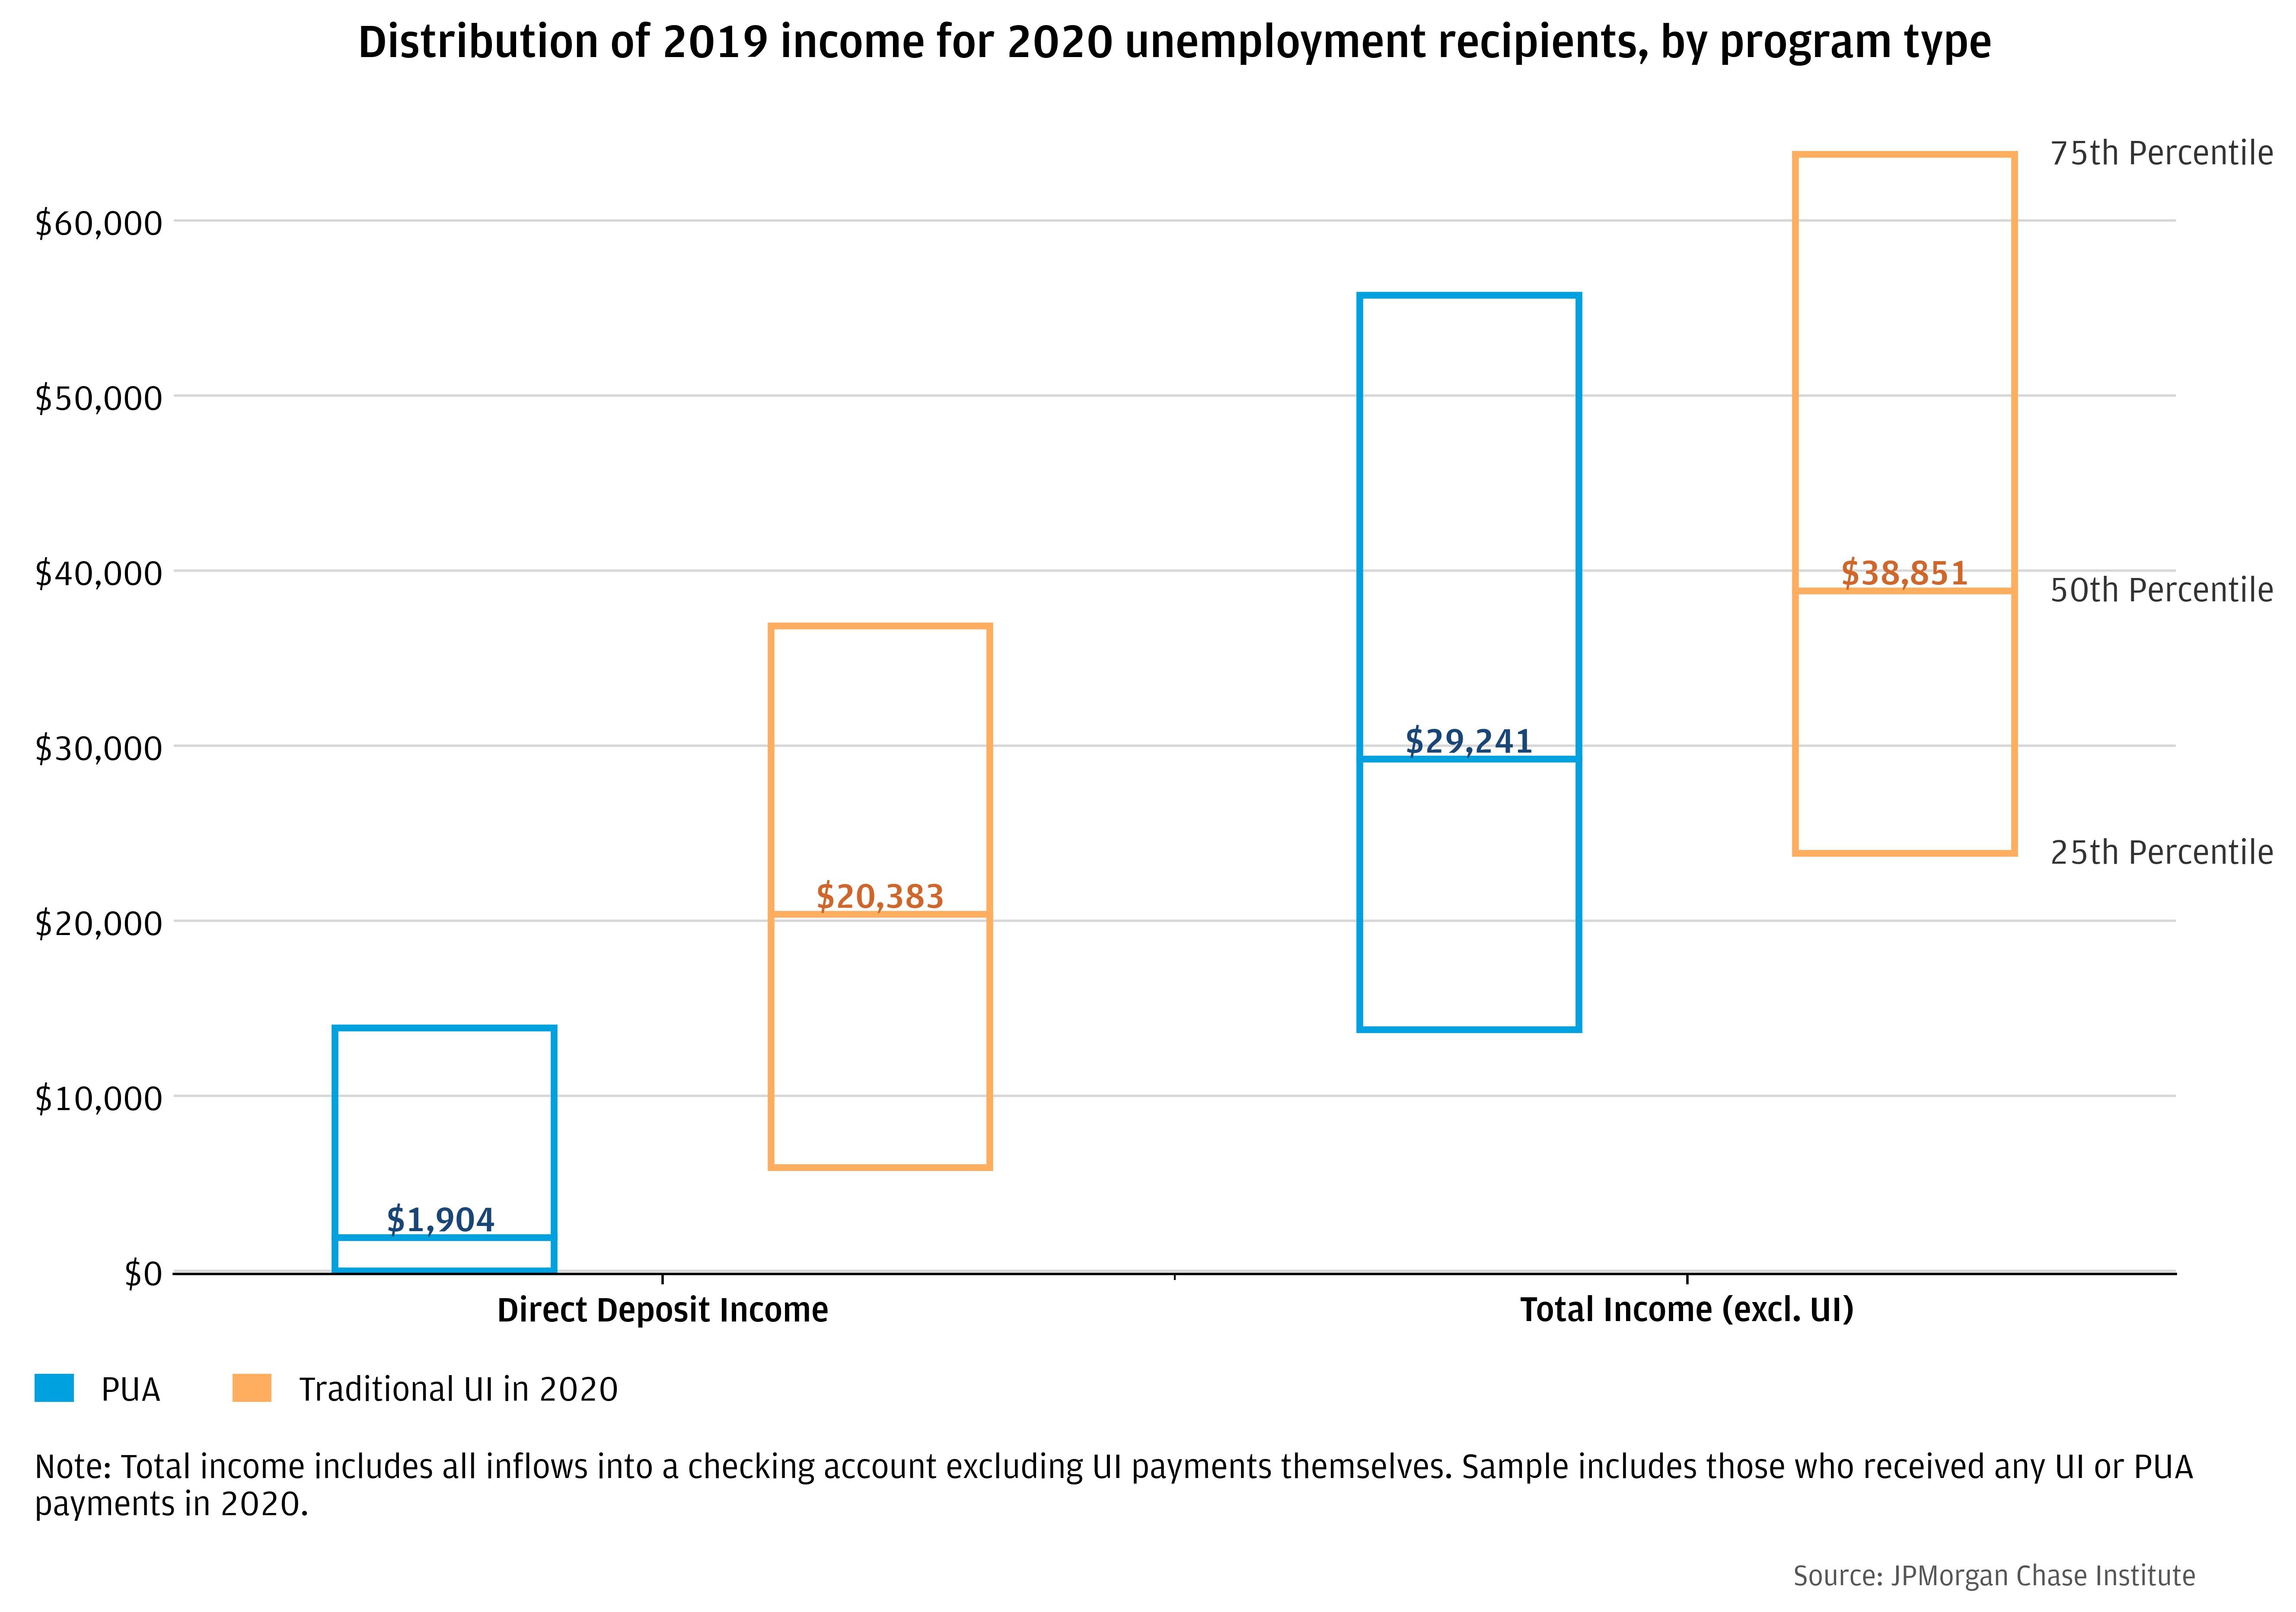
PUA disproportionately benefited lower-income families and those more marginally attached to the labor market. We offer three illustrations of this. First, compared to traditional UI recipients, PUA recipients exhibited dramatically (91%) lower direct deposit labor income—characteristic of more formal employment arrangements—and 25% lower total income (excluding UI) prior to the pandemic among PUA recipients (Figure 2).
Figure 2: PUA recipients had roughly 25 percent lower pre-pandemic income than traditional UI recipients
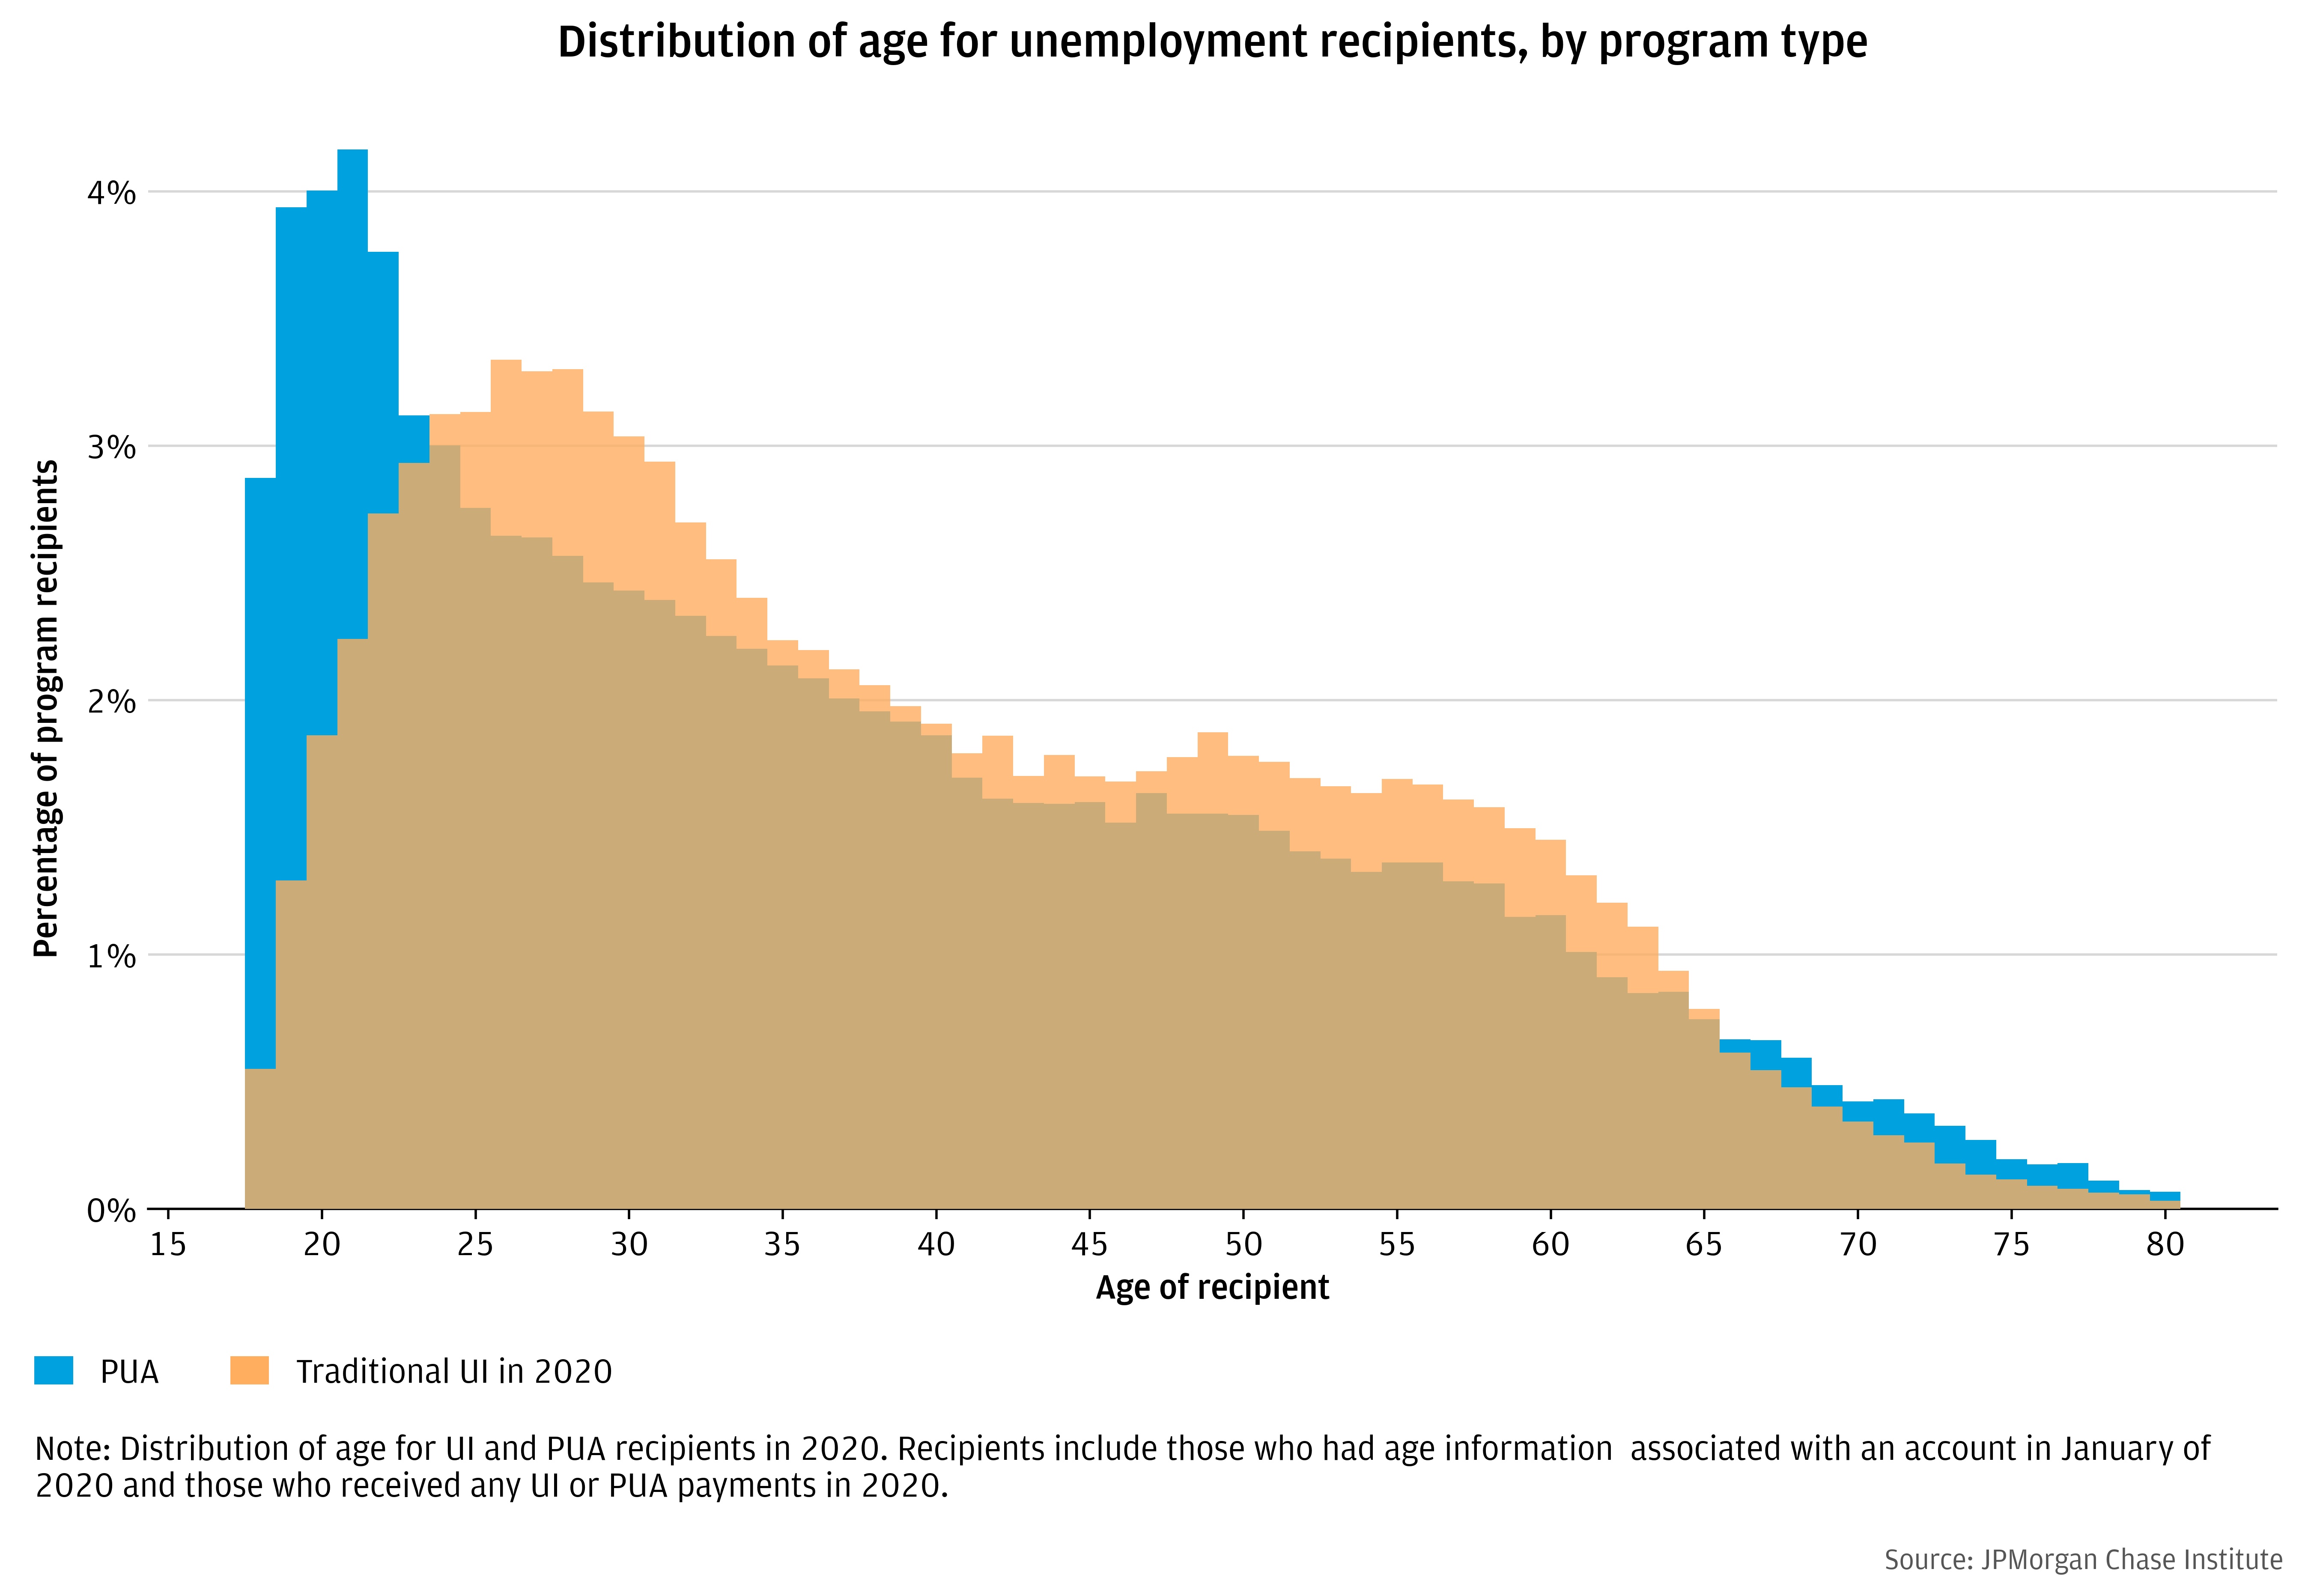
Second, the PUA program disproportionately benefited both younger workers with more limited work histories as well as older, potentially semi-retired workers (Figure 3). This was also evident in California (Bell et al., 2021a).
Figure 3: Age distribution of PUA recipients versus traditional UI recipients
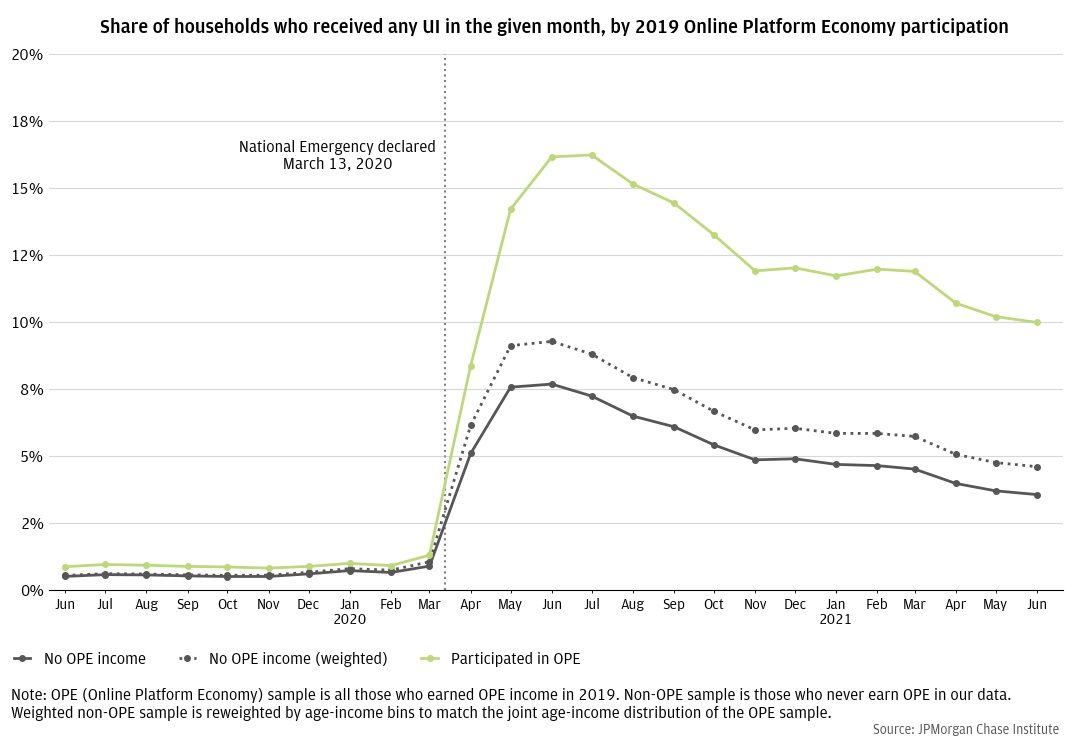
Third, contingent workers saw a larger increase in UI receipt during the pandemic than those who never earned income as contingent workers. For example, families who in 2019 had earned income from the Online Platform Economy (OPE), such as rideshare platforms, were much more likely to receive unemployment insurance in 2020 and 2021 than those without (Greig and Sullivan, 2021). Prior to the pandemic, OPE workers were 61 percent more likely to receive UI in the last six months of 2019 than families who had not earned platform income. During the pandemic this share increased to 138 percent for the last six months of 2020, suggesting a larger proportional increase in UI receipt among platform workers than non-OPE workers.4
Figure 4: Families with income from the Online Platform Economy in 2019 were much more likely to receive UI benefits during the pandemic than families without
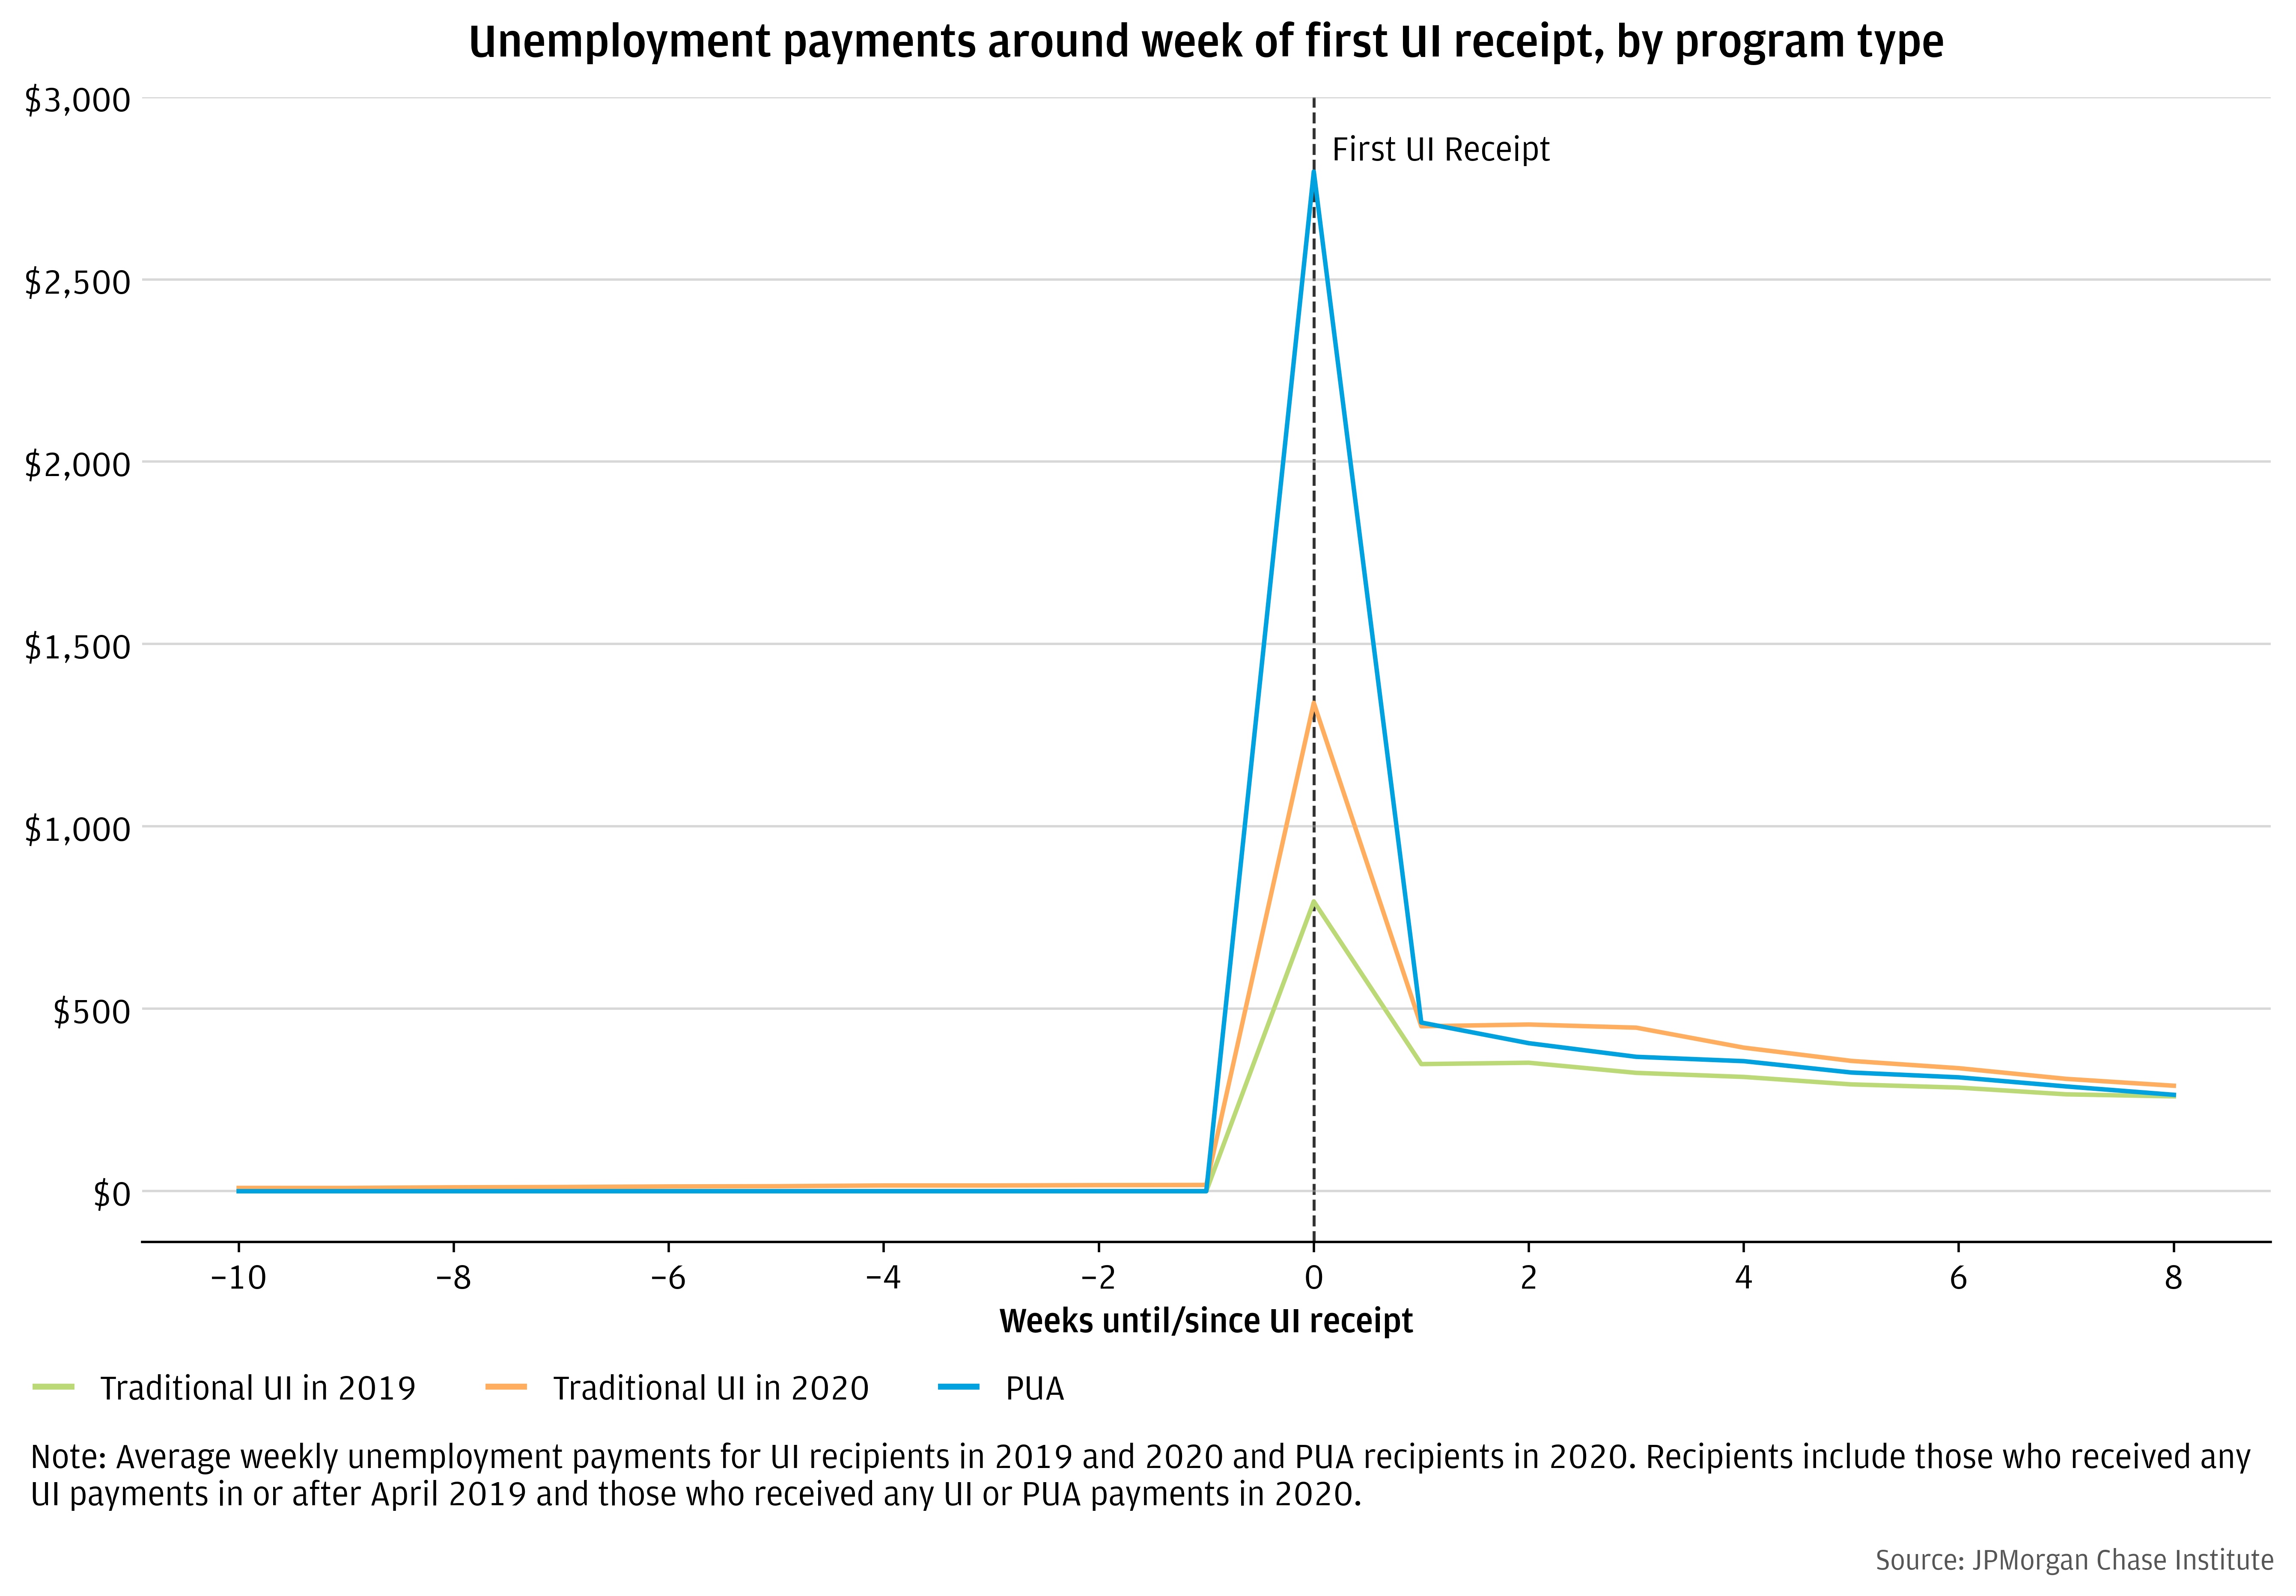
The PUA program provided meaningful income insurance that would not have been covered by the traditional UI program. PUA recipients experienced more significant delays in payment receipt than traditional UI recipients. We document payment delays by comparing the size of the first UI payment to subsequent weekly payments for traditional UI versus PUA.5 In 2019 when the UI system was not overloaded, delays were fairly short, and workers’ first UI checks contained roughly two weeks’ worth of payments. In 2020 when the UI system was heavily burdened, initial checks had about three weeks’ worth of payments. In contrast, the PUA system had much larger initial payments corresponding to delays of six or seven weeks.
Figure 5: PUA recipients received much larger initial UI benefit payments than traditional UI recipients, indicating much longer delays in benefit receipt
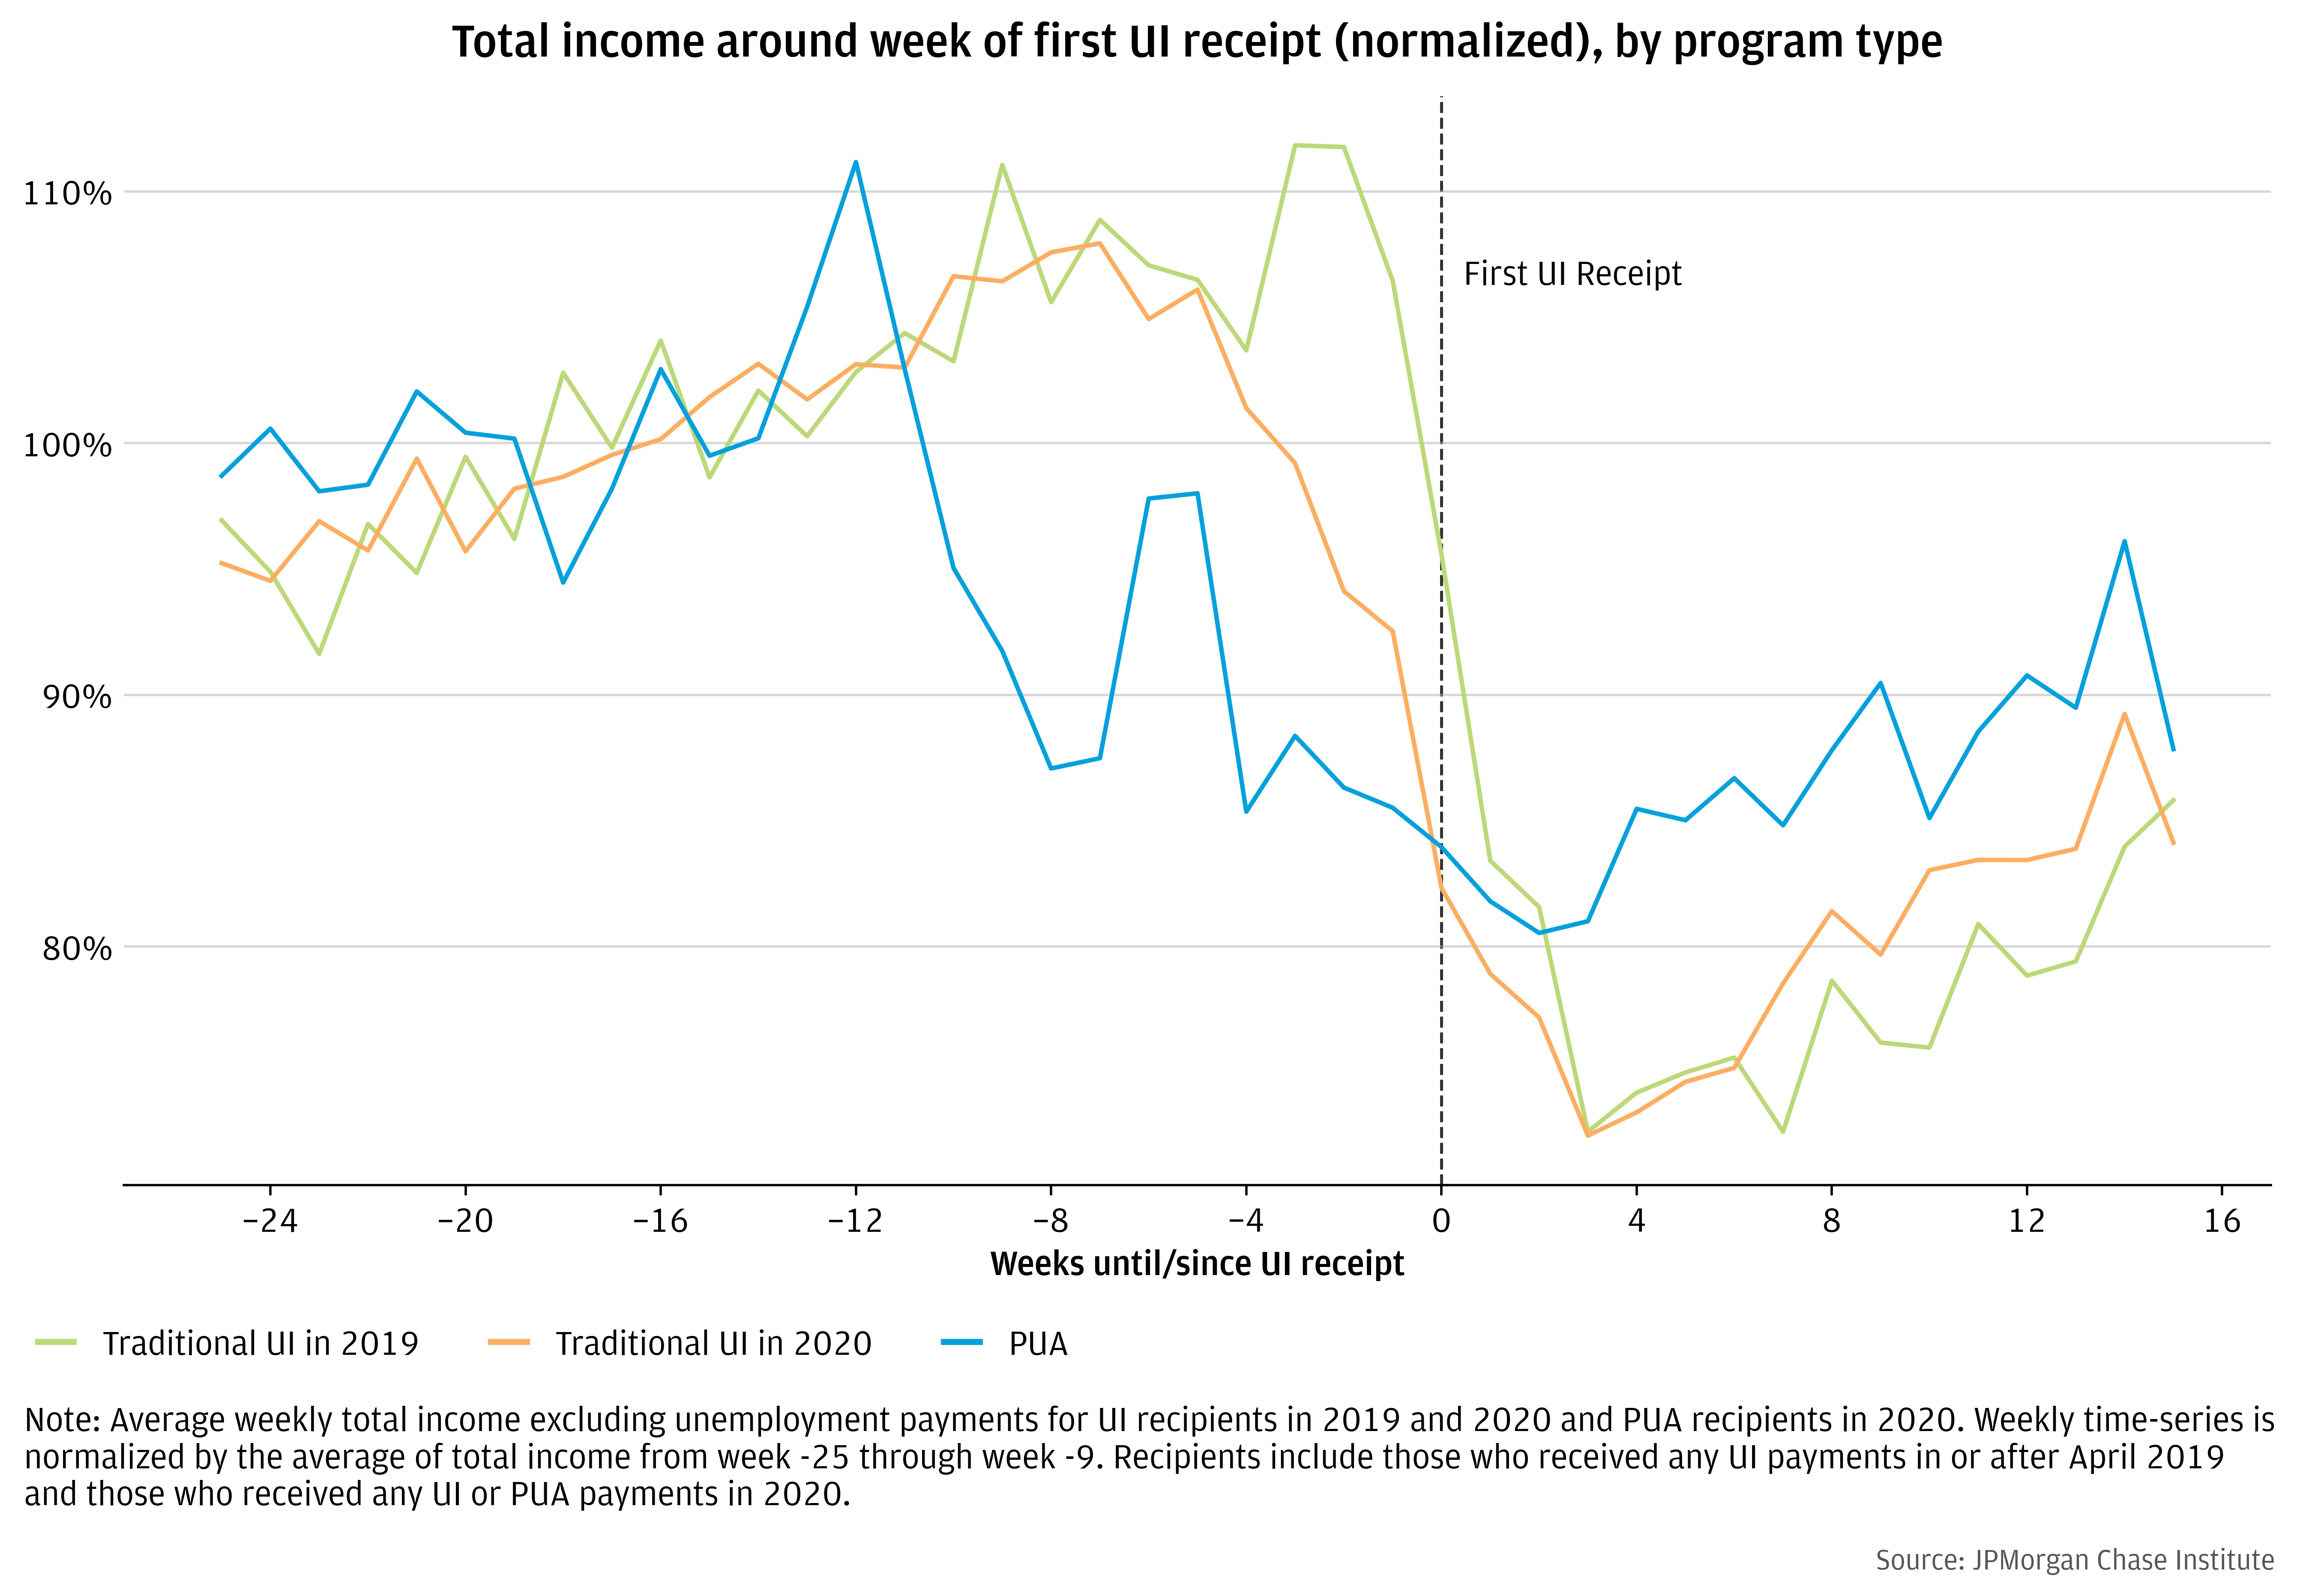
Delays in UI payments make it difficult to know exactly when the worker experienced job loss and the magnitude of their income loss. Given the large delays in benefit receipt for PUA recipients, by the time individuals received their PUA payments, some recipients may have already returned to work. Notwithstanding these measurement challenges, Figure 6 shows the change in workers’ total income (excluding UI benefits) around the time of first benefit receipt (see Greig et al, 2021). As a reference point, 2019 UI recipients experience a sharp 30 percent drop of income right before they get their first UI payment. This lines up with workers losing their income one or two weeks before their first UI payment. In 2020, when UI payments were more likely to be delayed, there is a 30 percent drop in income, but the drop is not as sudden because some workers were laid off several weeks before their first UI payment. PUA recipients’ income drops about 20 percent from peak to trough, but there is no steep drop off as with the UI recipients. This is what we would expect if some workers experienced their income loss six, seven, or eight weeks before benefit receipt, which in the aggregate creates a much more gradual decline in income. Moreover, if some workers returned to work before receiving their first benefits, this would effectively hide the total extent of their income loss. Despite these various measurement problems, the data suggest that PUA did in fact compensate recipients for significant income loss.
Figure 6: PUA recipients experienced similar income losses to traditional UI recipients
As documented by Ganong et al., (2021a), the spending impacts of UI were large: UI benefits provided a powerful stimulus to the macro economy by boosting consumption particularly among low-incomer workers. Next, we turn to the question of whether PUA recipients exhibited greater work disincentive effects than traditional UI recipients did.
A number of studies have evaluated the impacts of expanded UI on work disincentives during the pandemic. Some of that work has focused on the impacts of the weekly supplements on work disincentives (Ganong et al., 2021; Greig et al., 2021), while others have focused more on when the federal expansions were phased out during the summer of 2021 (Coombs et al., 2021; Dube 2020; Dube, 2021; Finamor and Scott, 2021; Holzer et al (2021). When this occurred, roughly two-thirds of UI recipients, including all PUA recipients, lost their UI benefits entirely, and the remaining one-third lost the $300 weekly supplement but continued to receive traditional UI benefits. Generally, these studies find relatively small work disincentive effects compared to overall pandemic fluctuations in employment, and also compared to historical estimates from pre-pandemic evidence.
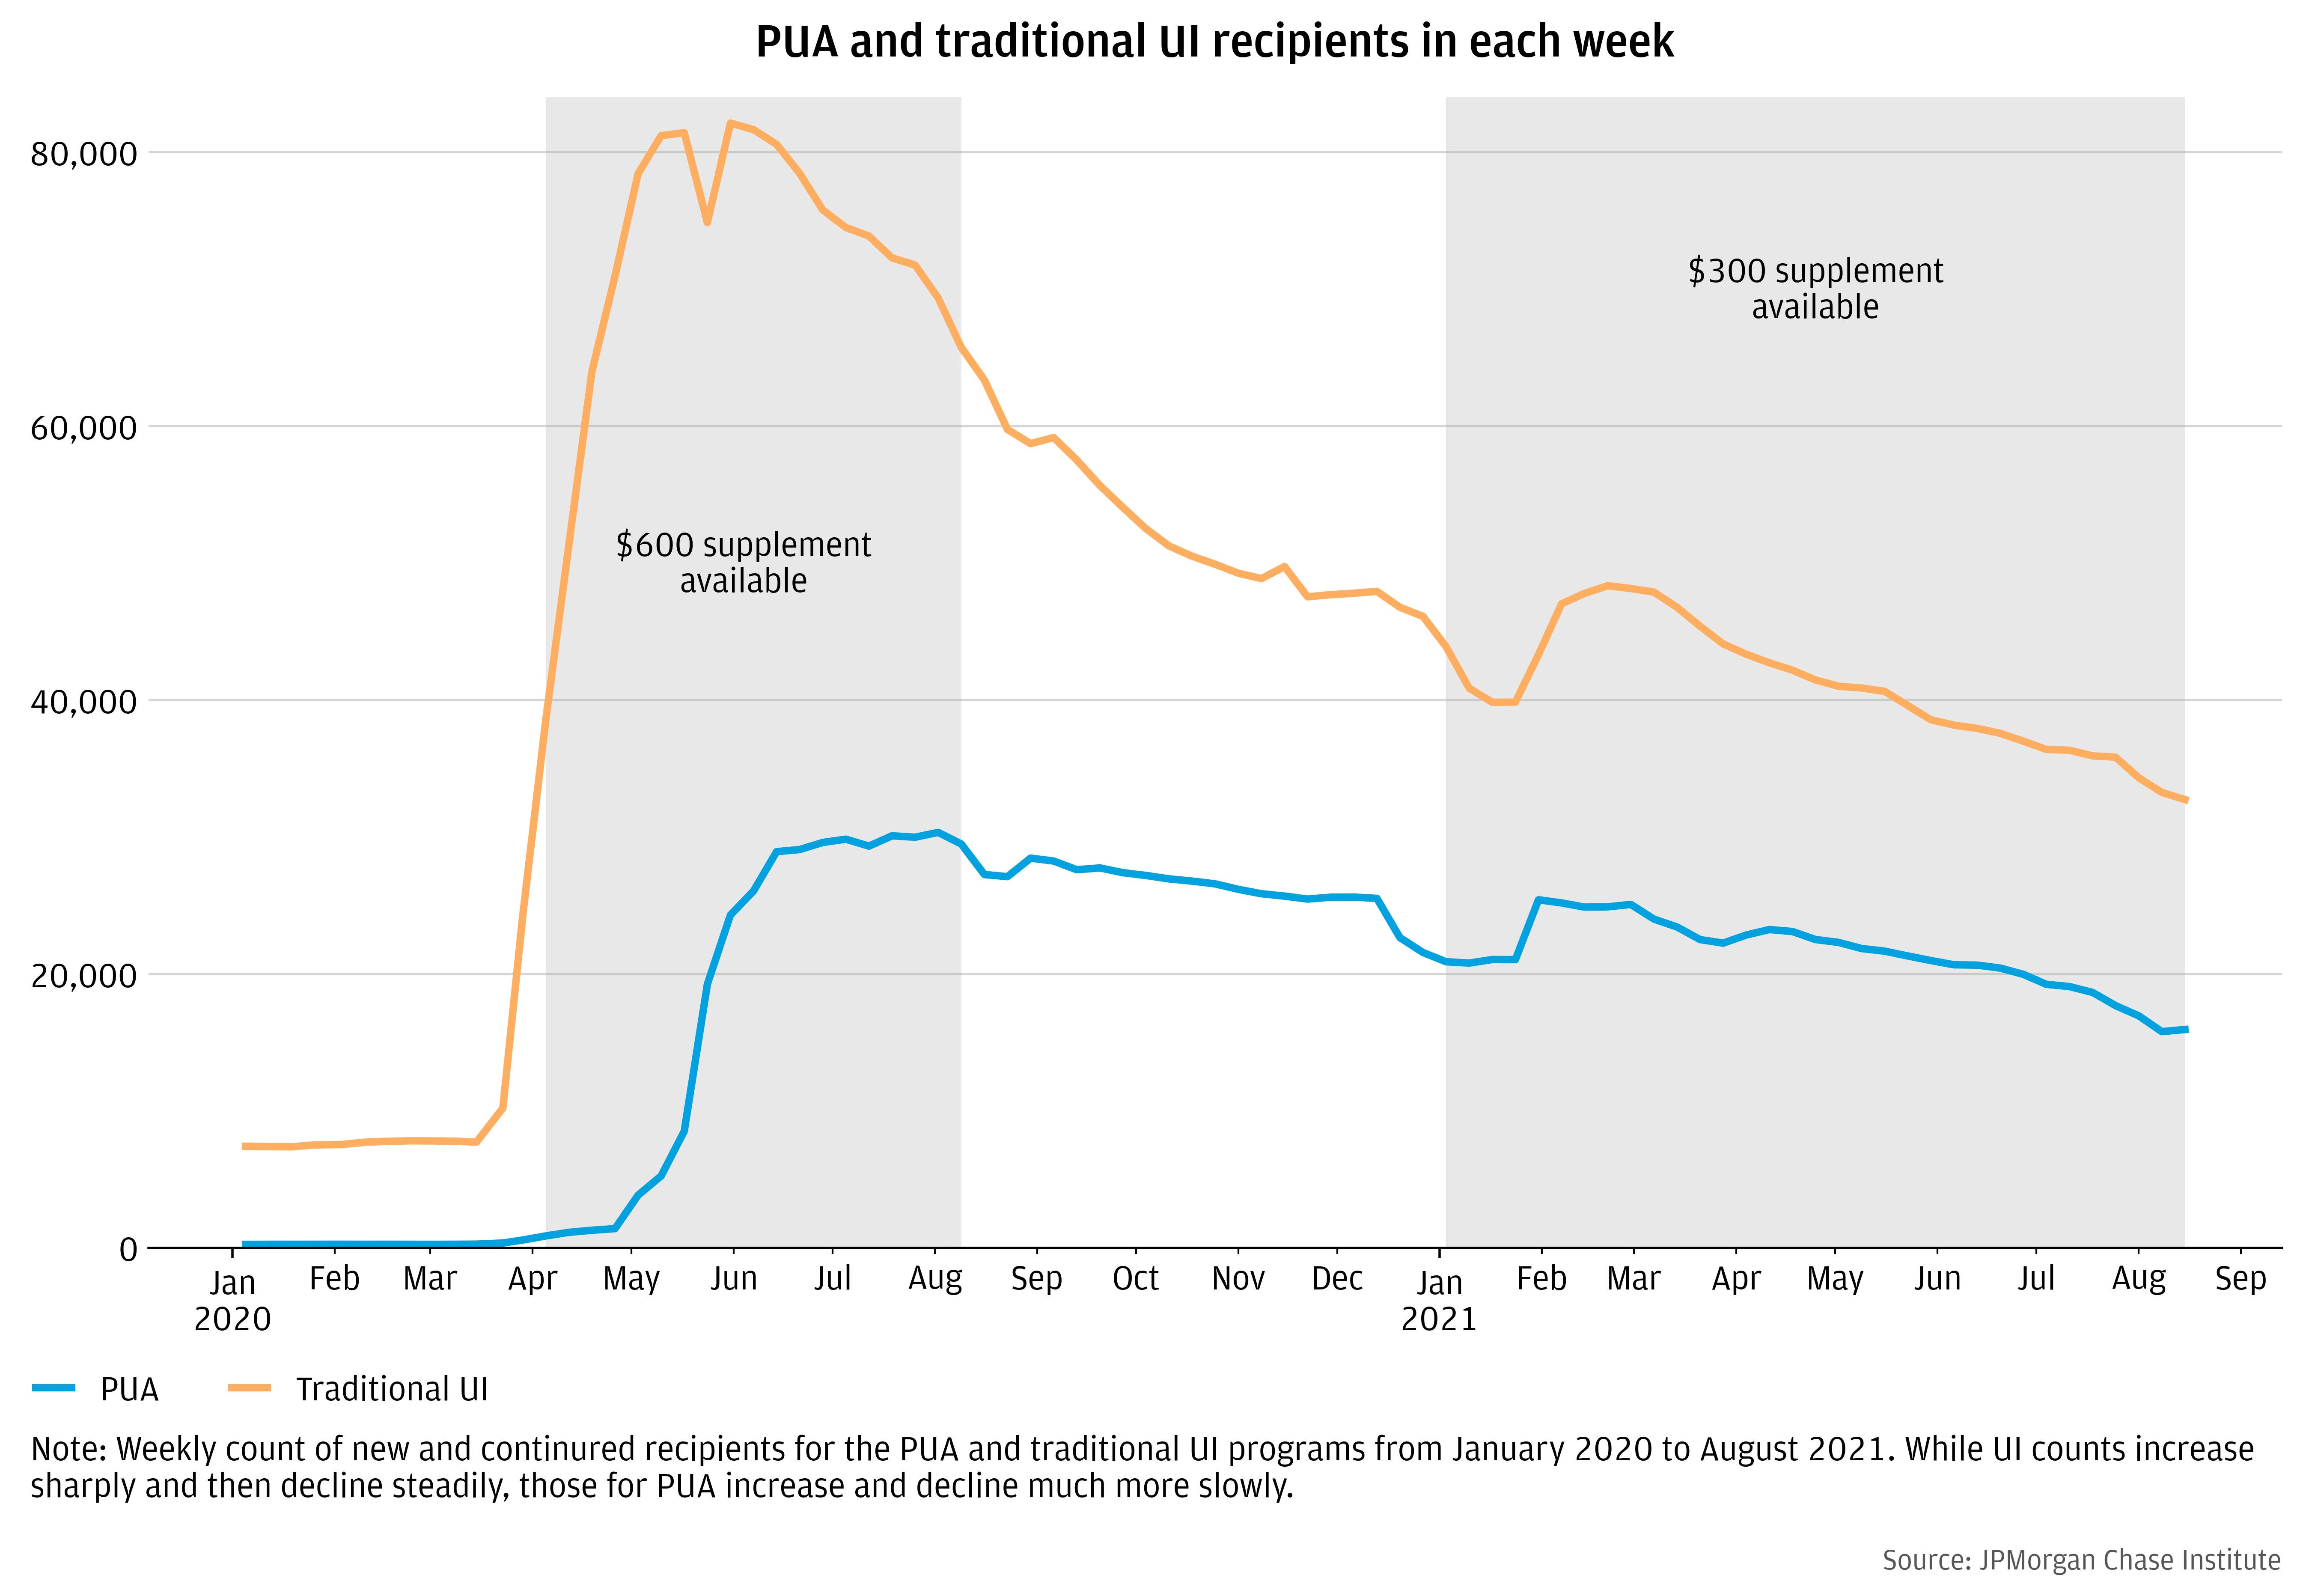
Here we attempt to examine this question specifically for PUA recipients. This analysis relies on data from New Jersey and Ohio. In contrast to causal evidence summarized above for all UI recipients, here the evidence is purely descriptive. Figure 7 presents the number of active claims in each week separately for normal UI versus PUA between January 2020 and August 2021 in Chase data from New Jersey and Ohio. It exhibits a similar pattern as the national claims data represented in Figure 1, showing that PUA claims fell more slowly than traditional UI claims particularly in 2020 (Figure 7).
Figure 7: Active spells fell more slowly among PUA recipients than traditional UI recipients.
However, when we examine the flows of recipients entering and exiting the PUA program versus traditional UI, we see there is significant churn in these two populations. Many new workers were entering and exiting the PUA program in any given week, even when supplements were available. In other words, one reason for the slower fall in active PUA claims than traditional UI claims is that new workers continued to enter the PUA program, even as others were exiting.
Figure 8: Entrances and exits for the traditional UI program began to track one another after surging in early 2020
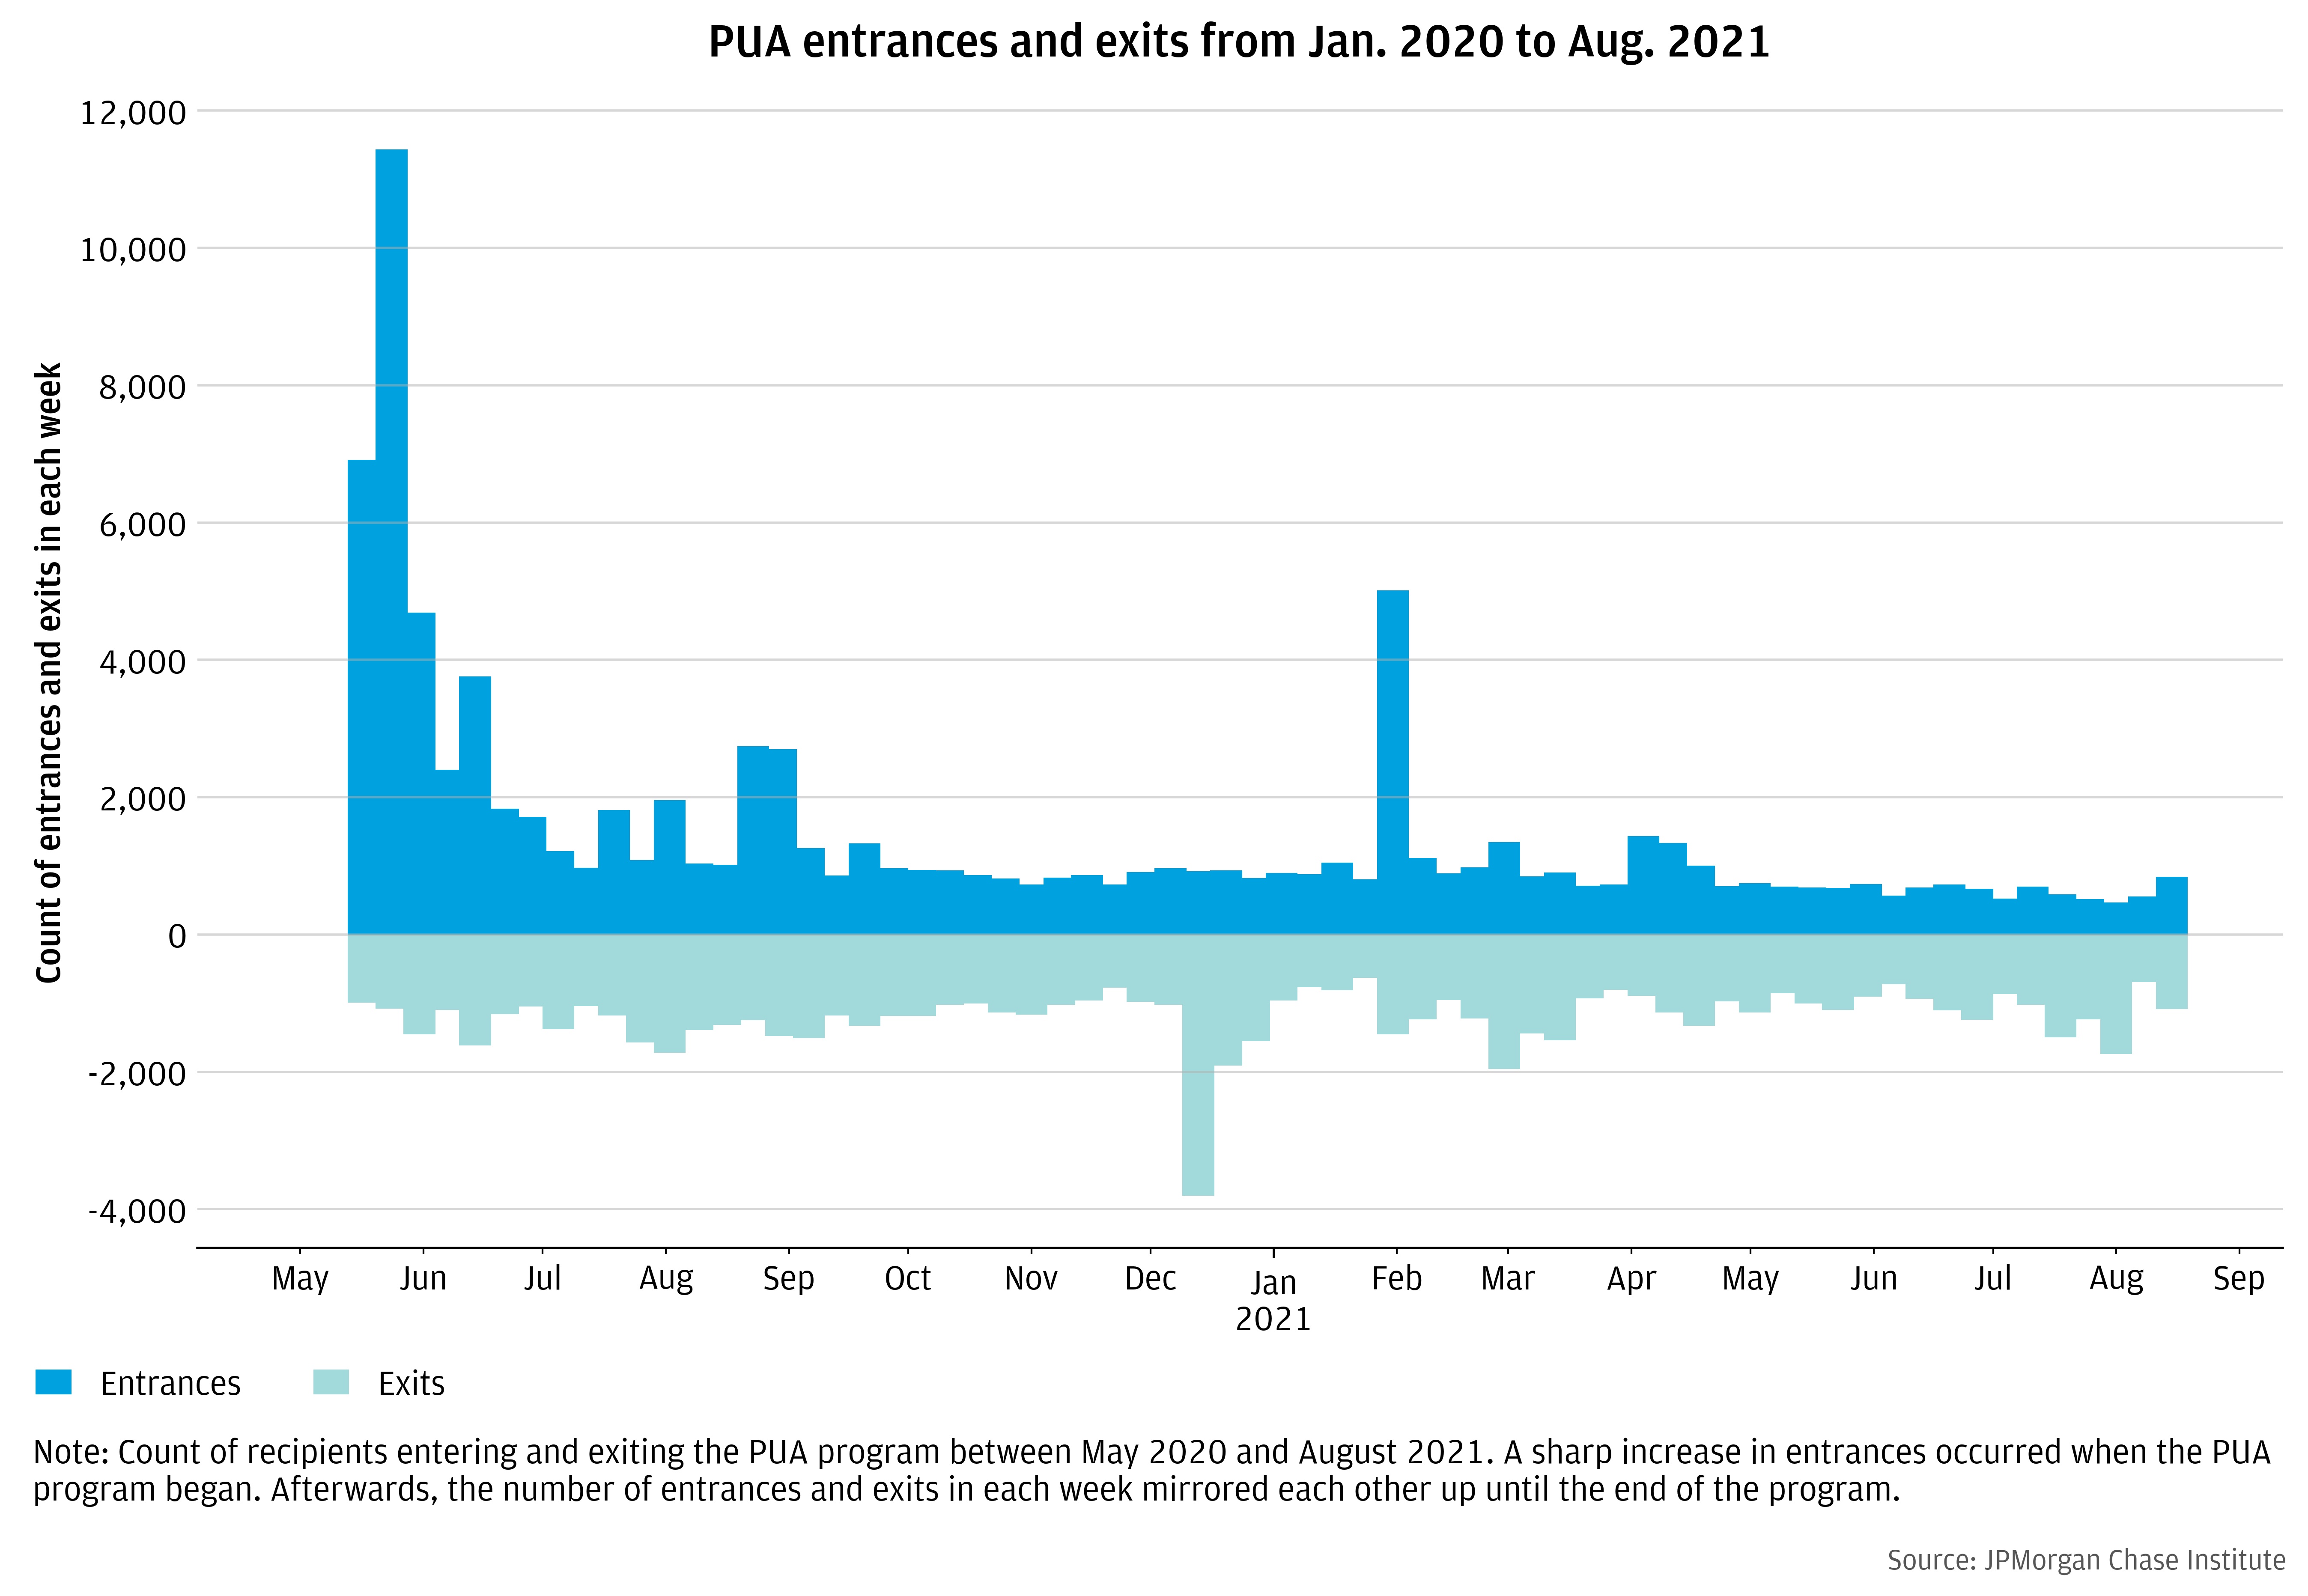
Figure 9: The PUA program saw a similar amount of churn in participants as the traditional UI program
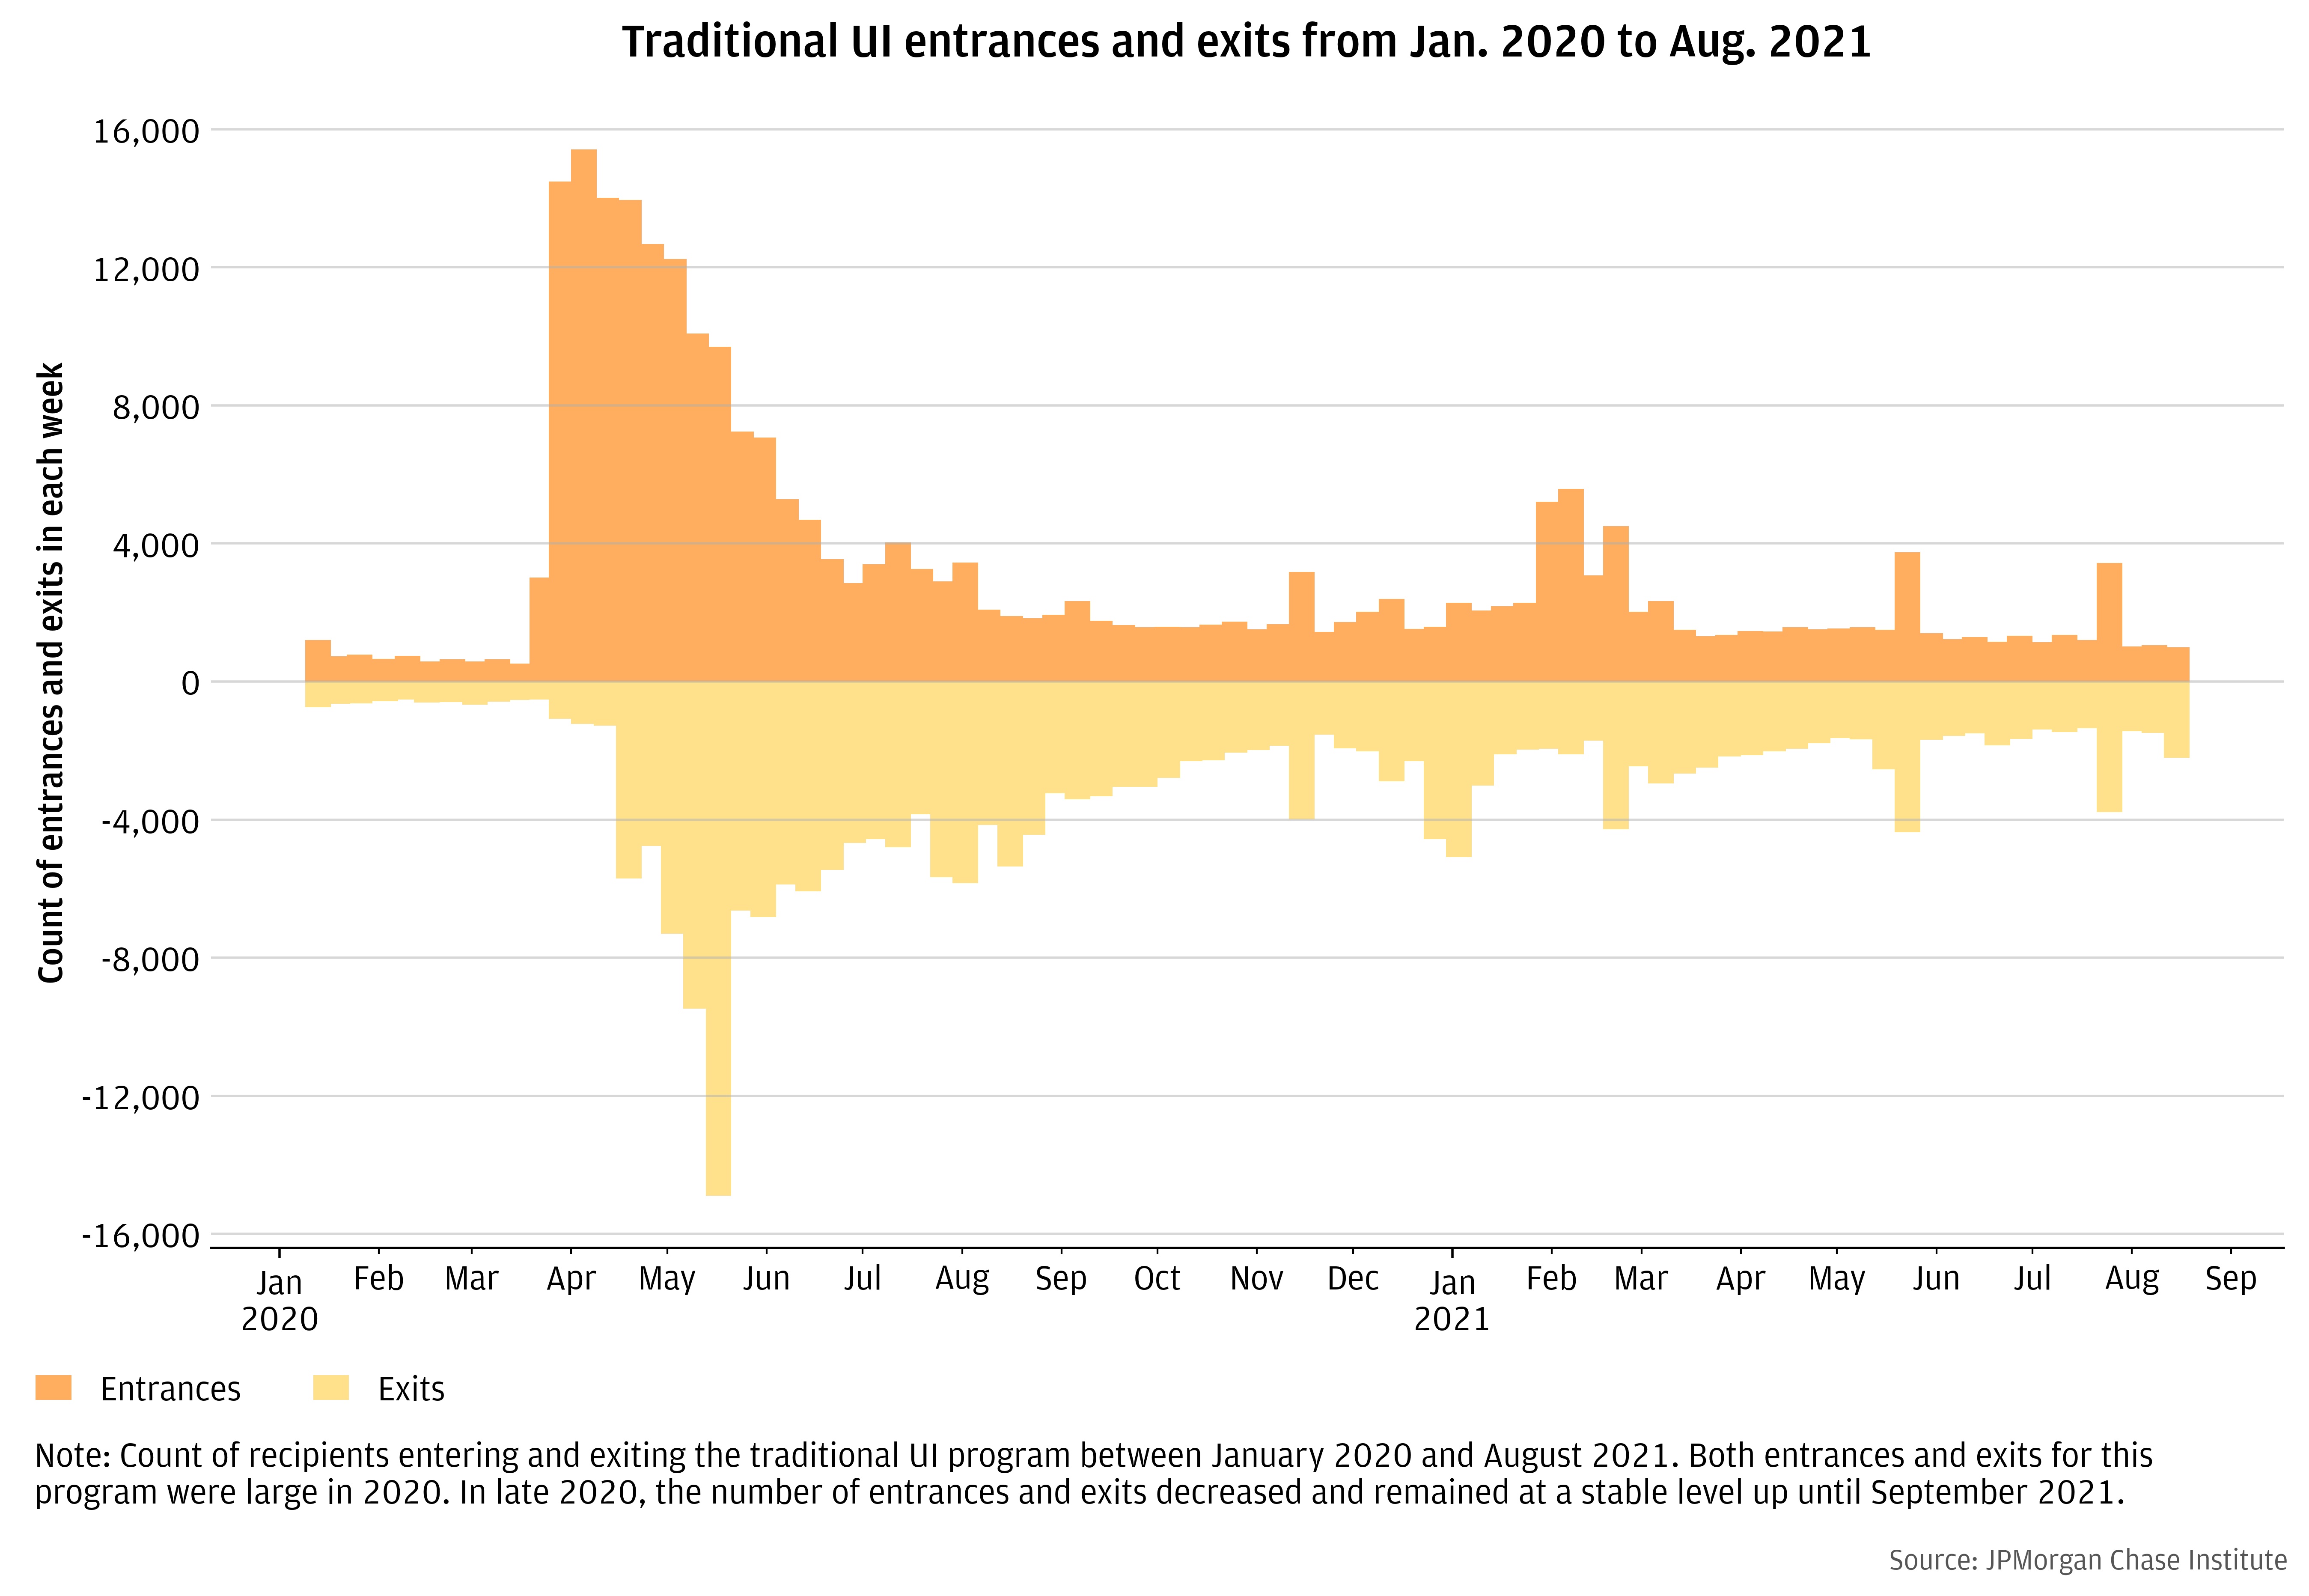
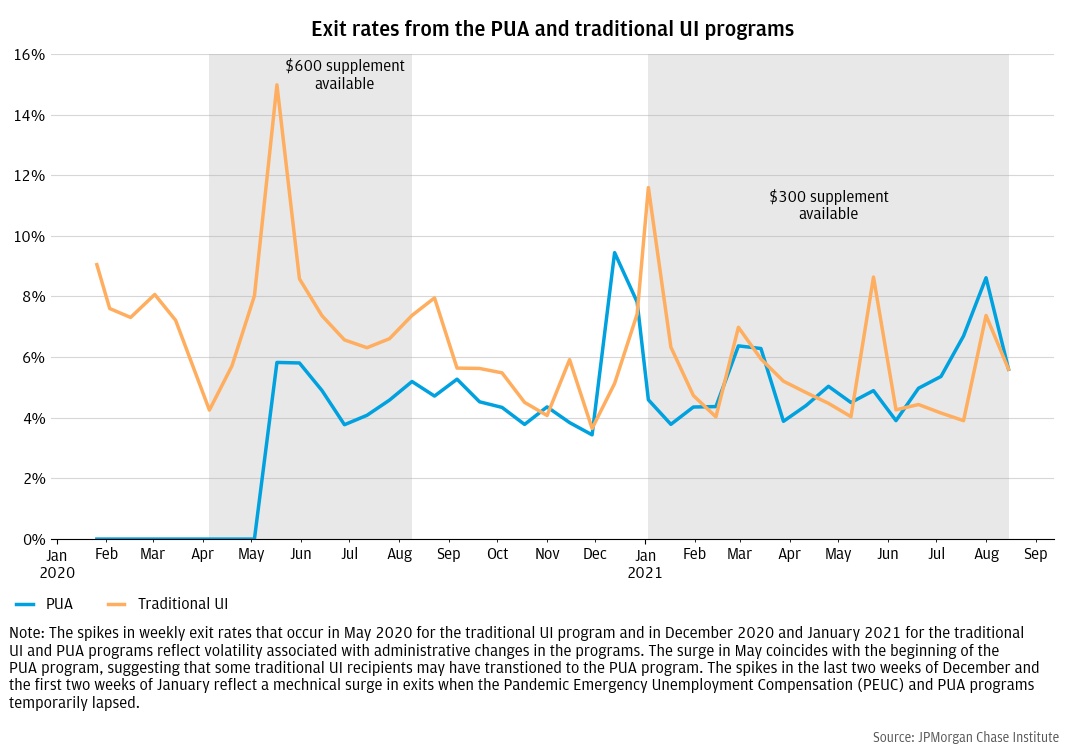
Figure 10 compares the exit rate out of traditional UI versus PUA throughout the pandemic and hones in on potential work disincentive effects. If UI benefits were especially discouraging work for PUA recipients, we would expect significantly lower exit rates for PUA recipients than for traditional UI recipients. However, although the PUA exit rate is slightly lower than the exit rate for traditional UI in 2020, it hovers around 5 percent throughout the time when the $600 supplement was available. Exit rates are comparable between traditional UI and PUA recipients in 2021, when the $300 supplement was available. Results do not change when we control for age or 2019 income differences between traditional UI and PUA recipients.
Figure 10: Traditional UI and PUA exit rates are fairly comparable, especially in 2021
Two possible explanations account for the slightly lower exit rate in 2020 among PUA recipients than traditional UI recipients. First, there were some views (e.g. Cajner et al., 2020) that initial claims overstated the true number of unemployed because of double counting within UI programs and between PUA and traditional UI program applicants. This resulted from both technical difficulties (e.g. websites crashing, application resubmissions) and PUA recipients having to apply for traditional UI benefits applicants first. These forces could have contributed excess exits particularly out of the traditional UI program in 2020, in the initial surge of claims and as duplicate claims were being resolved.
Second, as documented in Greig et al., (2021), recalls (or job restarts) accounted for a large share of exits in 2020. Recalls may disproportionately affect traditional UI recipients whose employers can rehire past employees and who, in theory, have an obligation to accept the recall or else risk losing UI benefits. PUA recipients, in contrast, include a range of different worker types and circumstances, including contingent workers, the self-employed, and caregivers. Their ability or choice to return to work may lie more clearly in their own hands, and their benefit receipt was not subject to third party verification. Put differently, the fact that so many PUA recipients exited the program even when supplements were available may signal a large degree of voluntary compliance with PUA eligibility guidelines on the part of claimants.
In summary, PUA dramatically expanded UI eligibility to workers at the margins of the labor force, offsetting meaningful income losses. UI exit rates were generally comparable between the two programs, even when the supplements were available. This leads to the tentative conclusion that work disincentive effects were not significantly larger for PUA recipients than traditional UI recipients. Given the dearth of data on PUA recipients, these conclusions remain uncertain.
PUA represented the largest expansion in UI eligibility in recent history. COVID-19 gave policymakers a reason to insure a wider array of worker types against income losses. The COVID-19 virus and its impacts on the availability of care also made other “good cause” circumstances, such as a health event and caring for dependents, more salient aspects of the UI eligibility framework. Here we summarize two key lessons learned from the PUA program during COVID.
The PUA program addressed labor income risk not insured by traditional UI, warranting consideration of more permanent eligibility expansions. PUA mitigated labor income risk for workers more marginally attached to labor force, with no clear evidence of increased work disincentive effects. This potentially warrants UI reform to broaden eligibility more permanently or to create a second tier level of income support for unattached workers. For example, others have advocated for expanding eligibility to workers with part-time, seasonal, or otherwise low or volatile incomes (Furman, 2015; Dube, 2021). The proliferation of more modern means of verifying income streams (e.g. for the purposes of providing early wage access) may make these eligibility expansions more technically feasible.
Conceptually, versions of these programs already exist. During COVID the share of UI beneficiaries receiving partial UI benefits increased to almost 20% in California (Bell et al., 2021).6 One way to expand eligibility is to relax pre-unemployment earnings requirements for UI or to increase the amount of income that is disregarded when calculating partial UI weekly benefit amounts, as advocated by Bell et al., (2020c). One caveat, however, is that simply relaxing earnings requirements may have the effect of increasing benefit levels without meaningfully increasing the number of people who receive any benefits. Thus a true expansion of eligibility in terms of the categories of workers who are eligible may still be needed to replicate the expanded coverage achieved through the PUA program.
The COVID-19 virus and its impacts on the availability of care also made other “good cause” circumstances, such as a health event and caring for dependents, more salient as part of a potentially more enduring UI eligibility framework. For example, the Omicron surge in January 2022 resulted in disruptions in care, widespread quarantines, and a return of virtual school or school cancellations. According to the Household Census Pulse, the number of families who reported not working due to having COVID-19 or caring for someone with COVID-19 increased from 3 million in the first half of December to over 8 million between Dec 29 and January 10. With PUA no longer in place in 2022, however, workers had no means of receiving income supports if they lost income as a result of these circumstances.
Administrative challenges in processing PUA claims were costly in terms of consumer welfare and government expense, underscoring the need for stronger systems in support of eligibility expansions. A key challenge states faced during the pandemic is that they were standing up an entirely new program within a month amidst peak claims volume. Whereas states are typically given two years to implement new policies, DOL IG (2021) documents that from passage of the CARES Act to the first payment of a claim took 38 days for the PUA program. Nonetheless these delays were consequential in terms of consumer welfare. As Farrell et al. (2020) show, delays in UI payments created economic hardship for the recipients: workers who had to wait a month longer for their benefits cut spending by 10 percentage points more than workers who waited less than a month. DOL IG (2021), summarizing press reports, described the impacts of UI delays on claimants as including inability to pay bills, increased credit card debt, high interest rate borrowing, depleted savings, food scarcity, and homelessness.
Given that UI plays both a key fiscal stimulus role to mitigate a recession as well as an insurance role to mitigate the individual costs of job loss, its ability to deliver relief quickly is critical. Thus, keeping a version of PUA permanent has the important benefit of allowing states time to establish protocols and enhance systems to accommodate other populations of uncovered workers in non-peak times.
A second issue is the increase in UI overpayments during the pandemic. Prior to the pandemic, according to Department of Labor, UI overpayments, which include both administrative errors as well as fraud, accounted for roughly 10 percent of claims. The most recent estimates suggest that the UI overpayment rate was 18 percent for fiscal year 2021. For the PUA program, DOL data similarly indicate an overpayment rate of 19 percent for 2021. A few states are on record reporting larger improper payment rates, accounting for as much as 27 percent of benefits paid in Arizona. Certainly, concerns of fraud appeared frequently in the press and were a salient touchpoint among policy makers. The full toll of fraud remains unknown and states will likely continue to find and recover improper payments for some time.
Although 18 percent represents a near doubling of the improper payment rate from pre-pandemic years, 82 percent of claims paid out were done so correctly. This represents an extraordinary level of voluntary compliance in light of the fact that, in service of speed, verification activities and requirements were relaxed during the pandemic. In addition, a significant share of overpayments is administrative in nature in that they represent a claimant or agency error rather than fraud. As documented by DOL IG (2021), during the pandemic many states did not perform activities to detect and recover improper payments, such as cross-matching claims with various state and interstate datasets, that would identify new hires, death records, incarcerated individuals, and individuals benefiting from UI in another state. At the same time organized crime associated with data breaches and identity theft increased the threat of fraud by foreign groups. In other words, improper payments likely increased due to both weaker agency control activities in the face of peak volume claims during a crisis and an increase in crime involving identity theft.
That said, stronger systems are clearly necessary to prevent improper payments and deliver timely and accurate UI benefits at scale. The federal government could provide a technology and data infrastructure that could enable more seamless eligibility verification and fraud prevention. Specifically, as proposed by Dube (2021), the federal government could use available earnings data from both UI applicants and employer records to automatically calculate the benefit levels. During the pandemic, the U.S. Department of Labor’s Office of Inspector General, in its recommendations to reduce overpayments and fraud, advised state agencies to join and cross-check a number of data exchanges, but many states did not. Arguably the federal government could play a stronger role in cross-checking and third party verification.
As Simon-Mishel et al (2020) document, less than half of states have modernized UI systems. The COVID-19 crisis laid bare the consequences of these antiquated systems. Fortunately, modernization efforts are underway. The American Rescue Plan Act of 2021 provided grant funding to states to partake in modernization efforts, DOL is actively working with states and law enforcement agencies to prevent and counter fraud.
Generally speaking, to qualify for UI, a person must (1) have lost their job through no fault of his or her own; be “able to work, available to work, and actively seeking work;” and have earned at least a certain amount of money during a “base period” prior to becoming unemployed.
Initially individuals were only required to self-certify that they could not work due to a COVID-19 related reason. The Coronavirus Response and Relief Supplemental Appropriations Act of 2021 increased documentation requirements, requiring applicants to provide proof of employment, self-employment, or a qualifying job offer associated with a job they commenced prior to filing their PUA claim (Pandemic Response Accountability Committee, 2021).
These states are Ohio (45.3 percent of sample), New Jersey (47.6), Massachusetts (3.6), West Virginia (3.2), Arkansas (0.3) and Vermont (0.2). According to DOL data, these states account for roughly 5 percent of total initial claims nationally in 2020.
We see similar results after re-weighting non-OPE workers to match the joint age-income distribution of the OPE sample: OPE workers were 50% more likely to receive UI in the second half of 2019 compared to 94% in the second half of 2020. In the absence of the PUA Program, it may seem surprising that OPE workers were more likely to receive UI than non-OPE workers, but Farrell et al. (2019) document that workers turn to the Online Platform Economy to generate income when they involuntarily lose a job, as identified by UI receipt.
We separate out FPUC supplements from both traditional UI and PUA payments where possible. Some states lumped in the supplement with payments making this impossible.
Workers earning less than three quarters of their prior weekly wages due to reduced hours qualify for partial UI.
Boone, Christopher, Arindrajit Dube, Lucas Goodman, and Ethan Kaplan. "Unemployment Insurance Generosity and Aggregate Employment." American Economic Journal: Economic Policy 13, no. 2 (2021): 58-99.
Cajner, Tomaz, Andrew Figura, Brendan M. Price, David Ratner, and Alison Weingarden (2020). “Reconciling Unemployment Claims with Job Losses in the First Months of the COVID-19 Crisis,” Finance and Economics Discussion Series 2020-055. Washington: Board of Governors of the Federal Reserve System, https://doi.org/10.17016/FEDS.2020.055.
Carey, Patrick, Jeffrey A. Groen, Bradley A. Jensen, Thomas J. Krolik, and Anne E. Polivka. "Applying for and receiving unemployment insurance benefits during the coronavirus pandemic." Monthly Labor Review (2021): 1-38.
Coombs, Kyle, Arindrajit Dube, Calvin Jahnke, Raymond Kluender, Suresh Naidu, and Michael Stepner. Early Withdrawal of Pandemic Unemployment Insurance: Effects on Earnings, Employment and Consumption. Working paper. Published online August 20, 2021. Accessed September 8, 2021. https://files.michaelstepner.com/pandemicUIexpiration-paper.pdf, 2021.
Department of Labor Office of Inspector General. 2021. COVID-19: States Struggled to Implement CARES Act Unemployment Insurance Programs. https://www.oig.dol.gov/public/reports/oa/2021/19-21-004-03-315.pdf
Dube, Arindrajit. 2020. Aggregate Employment Effects of Unemployment Benefits During Deep Downturns: Evidence from the Expiration of the Federal Pandemic Unemployment Compensation. No. w28470. National Bureau of Economic Research.
Dube, Arindrajit. 2021. A Plan to Reform the Unemployment Insurance System in the United States. The Hamilton Project. POLICY PROPOSAL 2021-03 | APRIL 2021.
Farrell, Diana, Fiona Greig, and Amar Hamoudi. 2019. “Bridging the Gap: How families Use the Online Platform Economy to Manage their Cash Flow.” JPMorgan Chase Institute. institute.jpmorganchase.com/institute/research/labor-markets/report-bridging-the-gap.
Farrell, Diana, Peter Ganong, Fiona Greig, Max Liebeskind, Pascal Noel, Daniel M. Sullivan, and Joseph Vavra. 2020. "The Unemployment Benefit Boost: Initial Trends in Spending and Saving When the $600 Supplement Ended." JPMorgan Chase Institute.
Farrell, Diana, Peter Ganong, Fiona Greig, Max Liebeskind, Pascal Noel, and Joseph Vavra. 2021. "Consumption effects of unemployment insurance during the covid-19 pandemic." JPMorgan Chase Institute.
Finamor, Lucas And Dana Scott. 2021. “Labor Market Trends and Unemployment Insurance Generosity during the Pandemic.” Economics Letters 199.
Furman, Jason. 2016. “The Economic Case for Strengthening Unemployment Insurance.” Speech at Center for American Progress Washington, DC.
Ganong, Peter, Fiona Greig, Max Liebeskind, Pascal Noel, Daniel Sullivan, and Joseph Vavra. 2021a. "Spending and job search impacts of expanded unemployment benefits: Evidence from administrative micro data." University of Chicago, Becker Friedman Institute for Economics Working Paper 2021-19.
Ganong, Peter, Fiona Greig, Pascal Noel, Daniel M. Sullivan, and Joseph Vavra. 2021b. "Micro and macro disincentive effects of expanded unemployment benefits." JPMorgan Chase Institute.
Greig, Fiona, and Daniel M. Sullivan. 2021. "The Online Platform Economy Through the Pandemic." JPMorgan Chase Institute.
Greig, Fiona, Daniel M. Sullivan, Peter Ganong, Pascal Noel, and Joseph Vavra. 2021. "When unemployment insurance benefits are rolled back: Impacts on job finding and the recipients of the Pandemic Unemployment Assistance Program." JPMorgan Chase Institute.
Holzer, Harry J., R. Glenn Hubbard, and Michael R. Strain (2021). “Did Pandemic Unemployment Benefits Reduce Employment? Evidence from Early State-Level Expirations in June 2021” NBER Working Paper No. 29575.
Pandemic Response Accountability Committee. 2021. Lessons Learned in Oversight of Pandemic Relief Funds.
Simon-Mishel, Julia, Maurice Emsellem, Michele Evermore, Ellen Leclere, Andrew Stettner, and Martha Coven. 2020. Centering Workers—How to Modernize Unemployment Insurance Technology. The Century Foundation, National Employment Law Project, and Philadelphia Legal Assistance.
We thank our research team, specifically Katie Zhang, Liam Purkey, and Bernard Ho, for their hard work and contribution to this research. Additionally, we thank Sarah Kuehl, Emily Rapp, and Kristine Pham for their support. We are indebted to our internal partners and colleagues, who support delivery of our agenda in a myriad of ways, and acknowledge their contributions to each and all releases.
We are also grateful for the invaluable constructive feedback we received from external experts and partners. We are deeply grateful for their generosity of time, insight, and support.
We would like to acknowledge Jamie Dimon, CEO of JPMorgan Chase & Co., for his vision and leadership in establishing the Institute and enabling the ongoing research agenda. We remain deeply grateful to Peter Scher, Vice Chairman, Demetrios Marantis, Head of Corporate Responsibility, Heather Higginbottom, Head of Research & Policy, and others across the firm for the resources and support to pioneer a new approach to contribute to global economic analysis and insight.
This material is a product of JPMorgan Chase Institute and is provided to you solely for general information purposes. Unless otherwise specifically stated, any views or opinions expressed herein are solely those of the authors listed and may differ from the views and opinions expressed by J.P. Morgan Securities LLC (JPMS) Research Department or other departments or divisions of JPMorgan Chase & Co. or its affiliates. This material is not a product of the Research Department of JPMS. Information has been obtained from sources believed to be reliable, but JPMorgan Chase & Co. or its affiliates and/or subsidiaries (collectively J.P. Morgan) do not warrant its completeness or accuracy. Opinions and estimates constitute our judgment as of the date of this material and are subject to change without notice. No representation or warranty should be made with regard to any computations, graphs, tables, diagrams or commentary in this material, which is provided for illustration/reference purposes only. The data relied on for this report are based on past transactions and may not be indicative of future results. J.P. Morgan assumes no duty to update any information in this material in the event that such information changes. The opinion herein should not be construed as an individual recommendation for any particular client and is not intended as advice or recommendations of particular securities, financial instruments, or strategies for a particular client. This material does not constitute a solicitation or offer in any jurisdiction where such a solicitation is unlawful.
Greig, Fiona, Daniel M Sullivan, Samantha Anderson, Peter Ganong, Pascal Noel, Joseph Vavra. 2022. “Lessons learned from the Pandemic Unemployment Assistance Program during COVID-19.” JPMorgan Chase Institute. https://www.jpmorganchase.com/insights/financial-health-wealth-creation/lessons-learned-pandemic-unemployment-assistance-program-covid
Authors
Fiona Greig
Former Co-President
Daniel M. Sullivan
Consumer Research Director, JPMorganChase Institute
Peter Ganong
Assistant Professor at the University of Chicago Harris School of Public Policy
Pascal Noel
Neubauer Family Assistant Professor of Finance at the University of Chicago Booth School of Business
Joseph Vavra
JPMorgan Chase Institute Academic Fellow
Samantha Anderson
Consumer Research Associate, JPMorganChase Institute