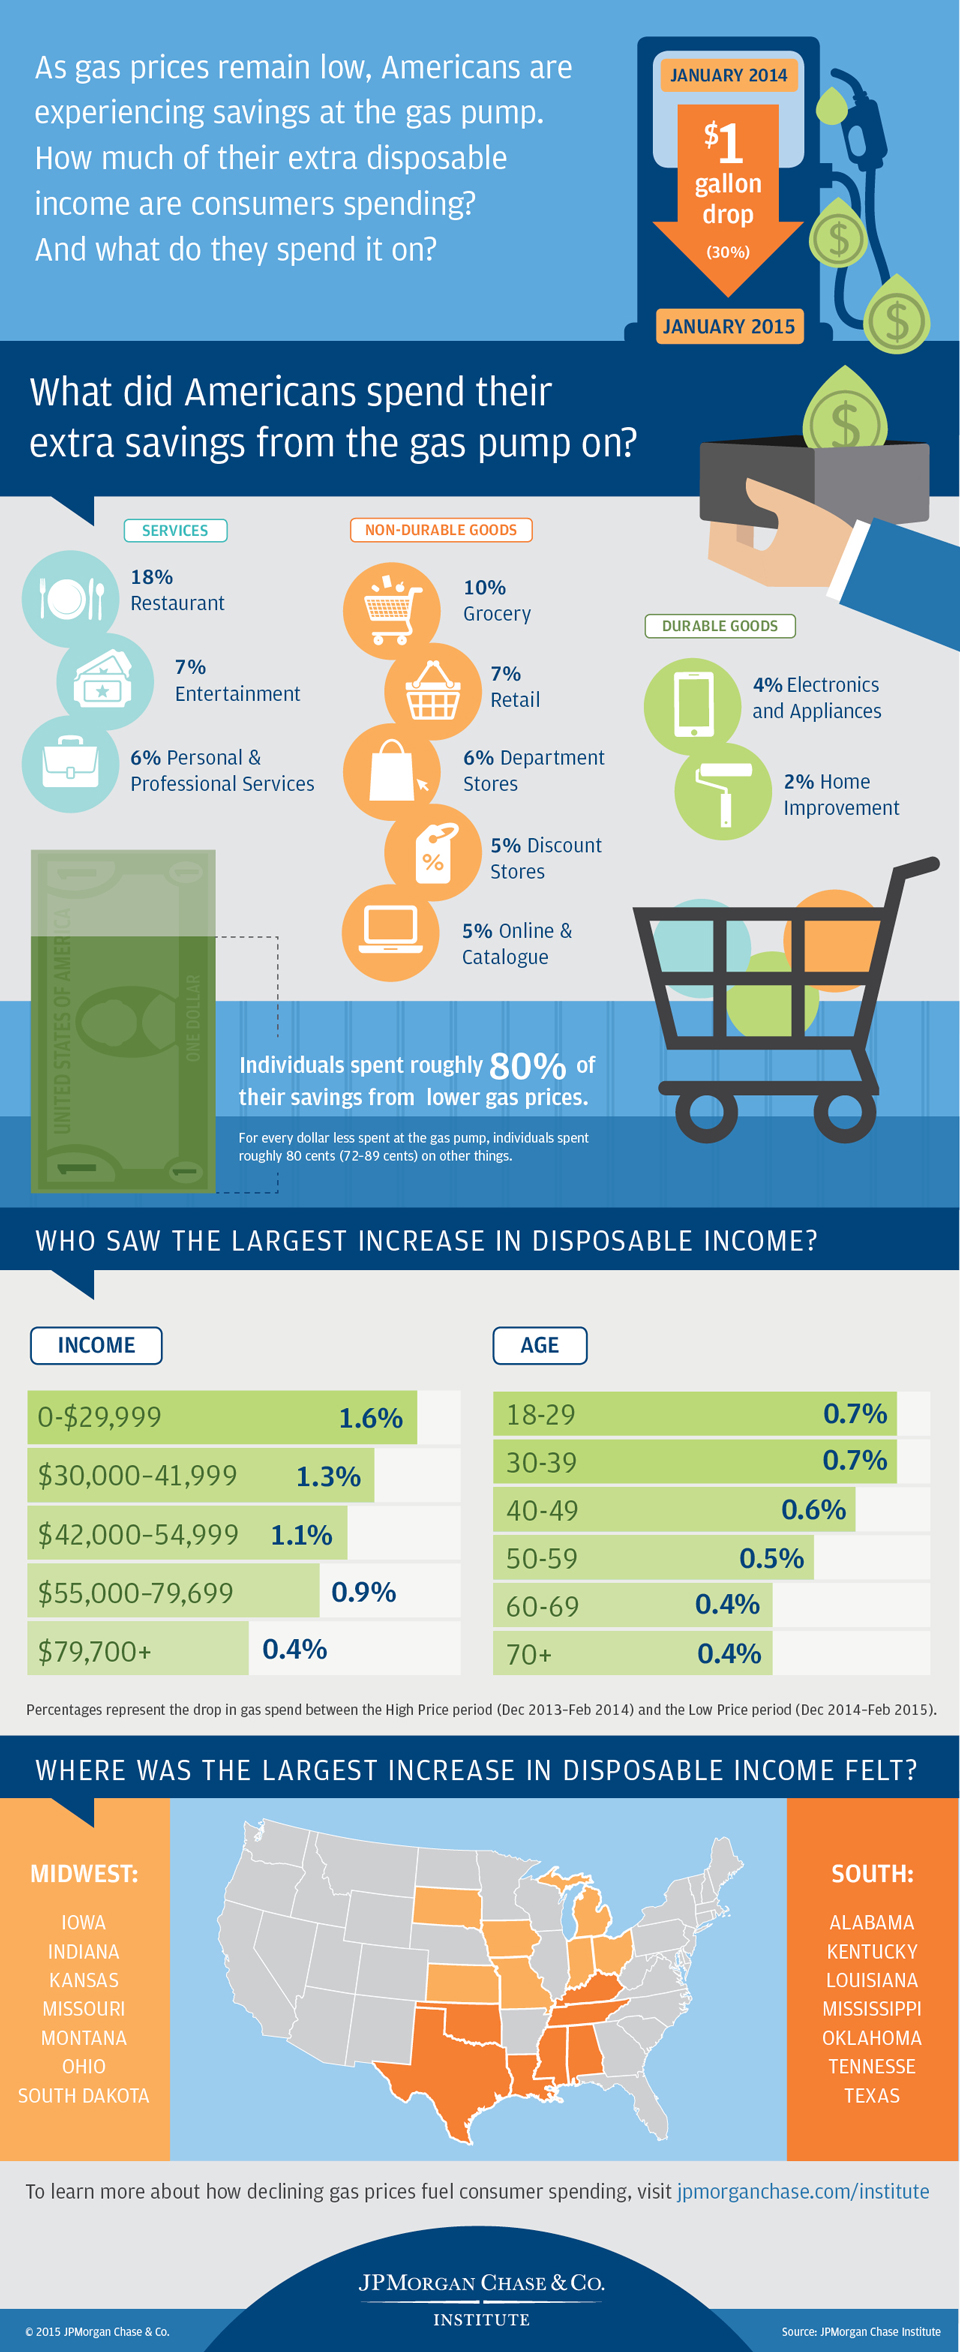
Infographic: How falling gas prices fuel the consumer

Source: JPMorgan Chase Institute
Latest news

An Ohio-based company is protecting first responders around the world
With support from JPMorganChase, Fire-Dex is providing protective equipment to firefighters in 100 countries and all 50 states.
Learn moreLatest news

Veteran’s Unconventional Path to Landing her Dream Job in Tech
U.S. Army Veteran Ashley Wigfall transitioned to a civilian role and charted her path to technologist through mentorship and skills training at the JPMorgan Chase tech hub in Plano, Texas.
Learn more
Research
The U.S. government projects that American households will save on average $700 this year on gasoline, as the price of a gallon of gas has fallen by nearly $1.50 from its peak of $3.70 in April 2014 and is projected to remain low through 2015. But who feels the biggest increase in spending power? How much of that extra money do consumers spend, and what do they spend it on?

Source: JPMorgan Chase Institute
JPMorganChase's website terms, privacy and security policies don't apply to the site or app you're about to visit. Please review its website terms, privacy and security policies to see how they apply to you. JPMorganChase isn't responsible for (and doesn't provide) any products, services or content at this third-party site or app, except for products and services that explicitly carry the JPMorganChase name.