

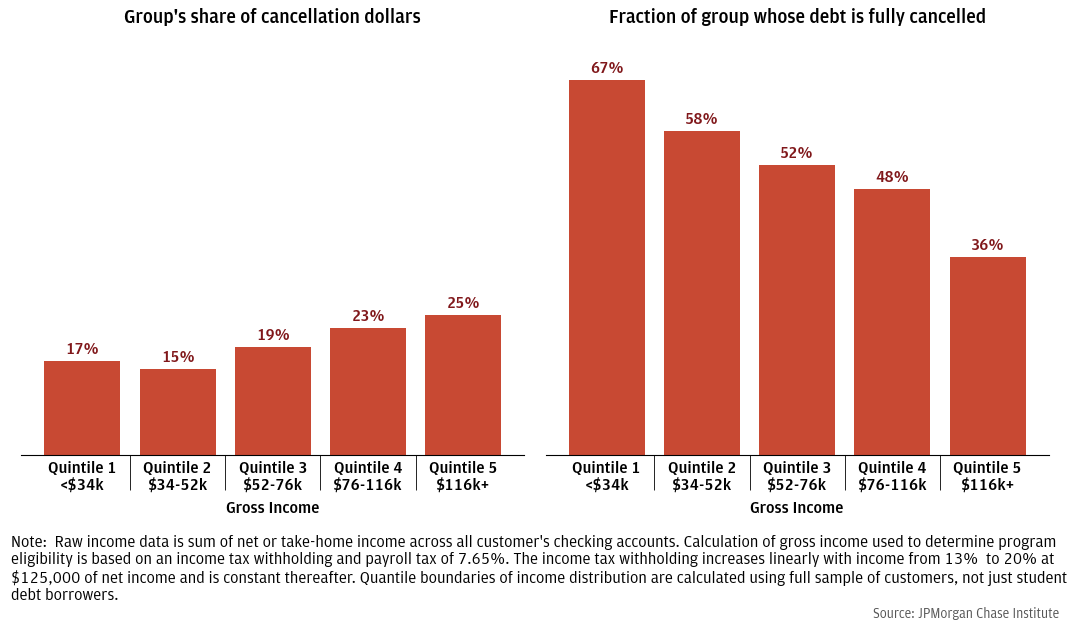
Figure 1: Higher income households receive slightly more cancellation dollars, but lower income households are more likely to have their debt fully cancelled.
Latest news

An Ohio-based company is protecting first responders around the world
With support from JPMorganChase, Fire-Dex is providing protective equipment to firefighters in 100 countries and all 50 states.
Learn moreLatest news

Veteran’s Unconventional Path to Landing her Dream Job in Tech
U.S. Army Veteran Ashley Wigfall transitioned to a civilian role and charted her path to technologist through mentorship and skills training at the JPMorgan Chase tech hub in Plano, Texas.
Learn more
On August 24, 2022, the Biden Administration announced it would cancel up to $20,000 of federal student debt for certain borrowers. Borrowers with incomes less than $125,000 for single tax filers or $250,000 for joint filers are eligible for cancellation. Borrowers who received Pell grants at some point are eligible to have their debts cancelled up to $20,000, and all other borrowers are eligible to have $10,000 cancelled.
We use administrative Chase banking and credit bureau data on 200,000 student debt holders to estimate how the benefits of this cancellation program might be distributed by household income and borrower race and ethnicity.1
We find that:
Figure 1: Higher income households receive slightly more cancellation dollars, but lower income households are more likely to have their debt fully cancelled.
Figure 2: Average debt cancelled among those receiving cancellation is between $9,000 and $10,000 across the income spectrum, but relatively higher for Black households.
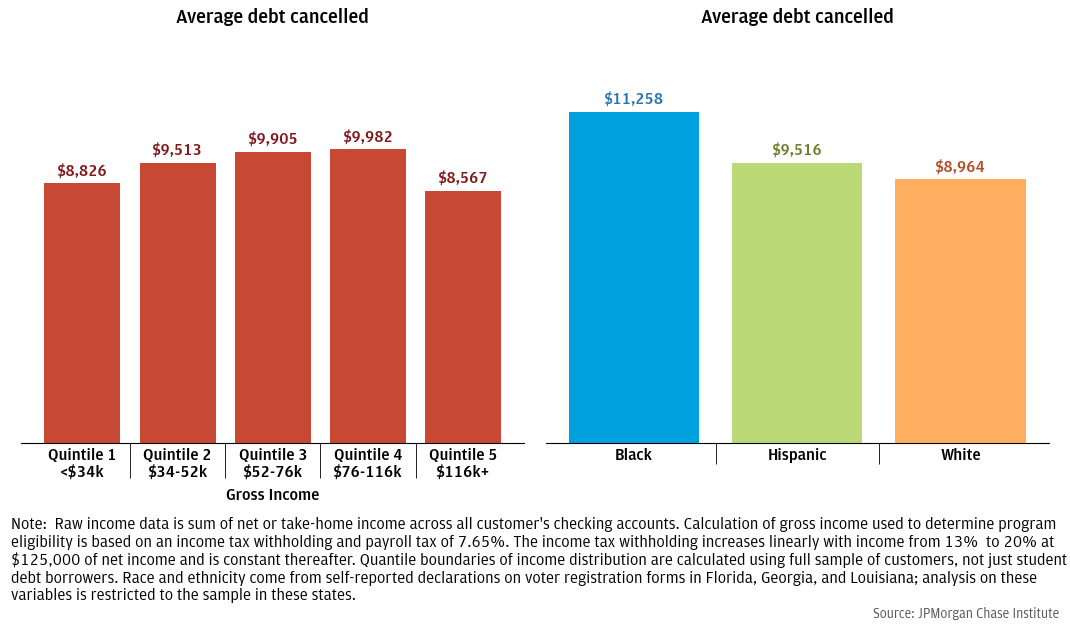
Figure 3: Black and Hispanic households receive more cancellation relative to their population share.
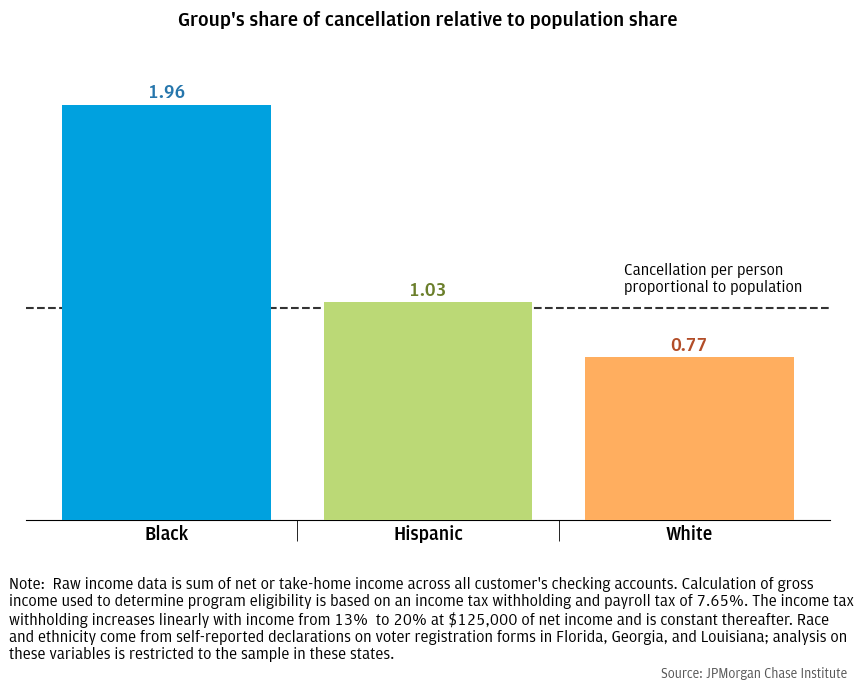
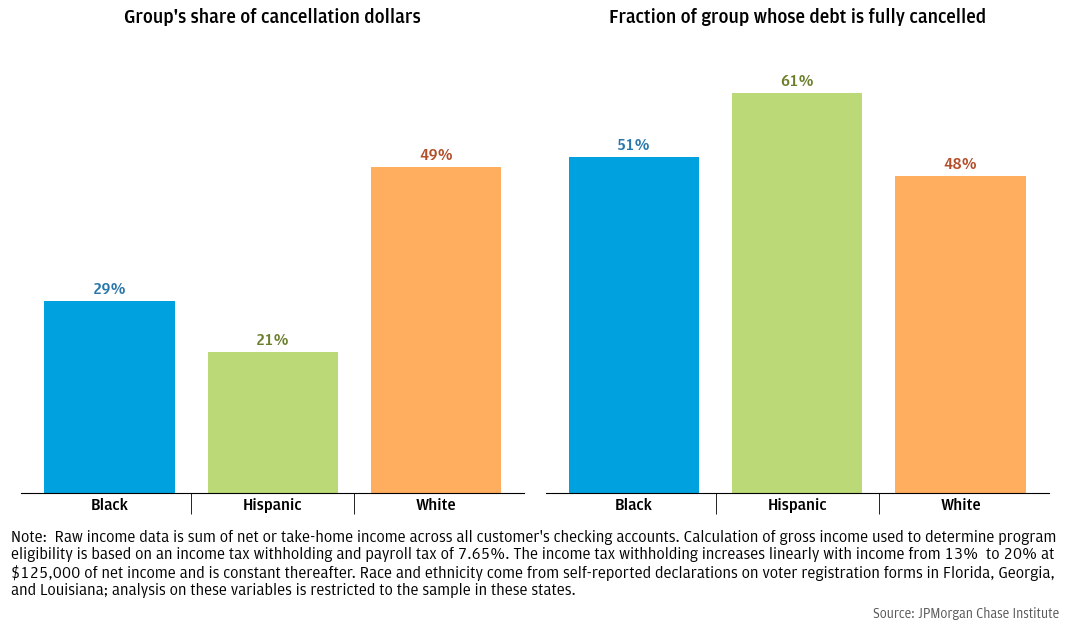
Figure 4: The distribution of cancellation dollars by race and ethnicity is proportional to the distribution of debt held by each group.
Our data cover the year 2016. We reweight our sample so the resulting income distribution matches the income distribution of households with non-deferred student debt in the 2016 Survey of Consumer Finances. We also restrict our sample in several ways to ensure the borrower’s Chase accounts are their primary accounts (see Greig and Sullivan 2021). Our measure of borrower income is the sum of all inflows into the borrower’s Chase accounts, excluding transfers from other accounts (e.g., transfers from savings or brokerage accounts into a checking account). This is a measure of net or take-home income, which we use to construct a measure of gross income by assuming an income tax withholding rate of between 13% and 20%, depending on income, and a payroll tax rate of 7.65%. Income withholding scales linearly from 13% up to 20% at $125,000 of net income and is then flat at 20% thereafter. Our data for race and ethnicity is taken from public voter rolls in Florida, Georgia, and Louisiana. All analyses of race effects are restricted to those states with a total sample if 10,800 borrowers. See Farrell, Greig, and Sullivan (2020) for further discussion of that sample. Our joint data set does not include information on whether a borrower received a Pell grant. To account for differences in Pell recipiency across income, race, and ethnicity, we use data from the Baccalaureate and Beyond 2008/2012 survey, which provides data on student debt balances, Pell recipiency, and income four years after graduation. We then randomly assign Pell recipiency within our income groups such that the Pell recipiency rates within each group match Baccalaureate and Beyond. All income numbers are deflated to 2021 dollars using CPI series CUUR0000SA0.
All other results, including how cancellation is distributed by race and ethnicity, are substantively the same whether we assume these borrowers are dual- or single-filers.
Cominole, M., Ritchie, N.S., & Cooney, J. (2020). 2008/18 Baccalaureate and Beyond Longitudinal Study (B&B:08/18) Data File Documentation (NCES 2021-141). U.S. Department of Education. Washington, DC: National Center for Education Statistics, Institute of Education Sciences. Retrieved 8/24/2022 from https://nces.ed.gov/pubsearch.
Farrell, Diana, Fiona Greig, and Daniel M. Sullivan. 2020. “Student Loan Debt: Who is Paying it Down?” JPMorgan Chase Institute. https://www.jpmorganchase.com/insights/all-topics/financial-health-wealth-creation/student-loan-debt
Greig, Fiona and Daniel M. Sullivan. 2021. “Who benefits from student debt cancellation?” JPMorgan Chase Institute. https://www.jpmorganchase.com/insights/all-topics/financial-health-wealth-creation/who-benefits-from-student-debt-cancellation.
We thank our research team, specifically Bernard Ho, for his hard work and contribution to this research. Additionally, we thank Elizabeth Ellis, Kristine Pham, Annabel Jouard, Stephen Harrington, Kate Finnerty and Clarke Wilson for their support. We are indebted to our internal partners and colleagues, who support delivery of our agenda in a myriad of ways, and acknowledge their contributions to each and all releases.
We are also grateful for the invaluable constructive feedback we received from external experts and partners. We are deeply grateful for their generosity of time, insight, and support. This research was possible because of the vital partnership, data, and knowledge from Experian.
We would like to acknowledge Jamie Dimon, CEO of JPMorgan Chase & Co., for his vision and leadership in establishing the Institute and enabling the ongoing research agenda. We remain deeply grateful to Peter Scher, Vice Chairman, Demetrios Marantis, Head of Corporate Responsibility, Heather Higginbottom, Head of Research & Policy, and others across the firm for the resources and support to pioneer a new approach to contribute to global economic analysis and insight.
This material is a product of JPMorgan Chase Institute and is provided to you solely for general information purposes. Unless otherwise specifically stated, any views or opinions expressed herein are solely those of the authors listed and may differ from the views and opinions expressed by J.P. Morgan Securities LLC (JPMS) Research Department or other departments or divisions of JPMorgan Chase & Co. or its affiliates. This material is not a product of the Research Department of JPMS. Information has been obtained from sources believed to be reliable, but JPMorgan Chase & Co. or its affiliates and/or subsidiaries (collectively J.P. Morgan) do not warrant its completeness or accuracy. Opinions and estimates constitute our judgment as of the date of this material and are subject to change without notice. The data relied on for this report are based on past transactions and may not be indicative of future results. The opinion herein should not be construed as an individual recommendation for any particular client and is not intended as recommendations of particular securities, financial instruments, or strategies for a particular client. This material does not constitute a solicitation or offer in any jurisdiction where such a solicitation is unlawful.
Authors

Daniel M. Sullivan
Consumer Research Director, JPMorganChase Institute

Chris Wheat
President, JPMorganChase Institute