Findings

Roughly two-thirds of families in the U.S. own a home. Rising home prices, and therefore housing wealth, can fuel household consumption. As such, the housing market can have a significant impact on the broader economy. From the late 1990s up to the Great Recession, estimates of the marginal propensity to consume (MPC) out of housing wealth range from approximately 4 cents to 9 cents, and studies covering the Great Recession period have found MPCs as high as 11 cents.1 However, evidence of slower-than-expected consumption and GDP growth in combination with relatively low levels of home equity extraction after the Great Recession suggest that the housing wealth effect may be much smaller after the financial crisis than for prior periods. Indeed, some recent studies suggest that the MPC may be as low as zero, but these studies do not provide precise causal estimates.

In this report, we answer the following research question: What was the household consumption response to the 50 percent increase in housing wealth in the post-Great Recession period? We link de-identified banking data, including transaction-level deposit account and credit card data, to loan-level mortgage data to estimate the MPC out of housing wealth for the period between 2012 and 2018. Our large sample and direct measure of consumption allow us to derive more precise MPC estimates than otherwise available.

The marginal propensity to consume is the proportion of an increase in income or wealth that a consumer chooses to spend on goods and services rather than save.

Overview of data sample.

This report draws on a sample of 1.7 million Chase customers who had both a Chase mortgage and Chase deposit account between 2012 and 2018 for all twelve months of each year. Our loan-level mortgage data allow us to observe details of each home-owner’s loan (e.g., current levels of equity). In a robustness check, we also examine a sample of over 5 million Chase credit card customers who are likely to be homeowners according to information on their credit card application. Our monthly sample of homeowners with a mortgage included 865,000 customers and includes each month where the Chase mortgage customer is also: a Chase deposit core customer (meaning they had at least five transactions in their Chase deposit account), a resident of a metropolitan statistical area (MSA) for which the Saiz housing supply elasticity measure is available, and a resident of a zip code where Zillow Home Value Index (ZHVI) data is available.

Source: JPMorgan Chase Institute.

From a universe of over 16 million Chase mortgage customers between 2012 and 2018, we created a sample of 1.7 million customers who had both a Chase mortgage and Chase deposit account during that period and who fulfilled other criteria described above. Our loan-level mortgage data allow us to observe details of each homeowner’s loan (e.g., current levels of equity). In a robustness check, we also examined a sample of over 5 million Chase credit card customers who are likely to be homeowners according to information on their credit card application. Following similar studies that estimate housing wealth effect MPCs for prior periods, we use an instrumental variables strategy with housing supply elasticity as the instrument to derive causal estimates.


01

The marginal propensity to consume (MPC) out of increasing housing wealth from 2012 to 2018 ranges from 0 to 1.6 cents—much lower than most estimates for prior periods.

We find that the MPC out of increasing housing wealth from 2012 to 2018 is 0 cents for our monthly sample and 1.6 cents for our annual sample, both of which are significantly lower than most estimates in the literature for prior periods. Studies find MPCs as high as 11 cents for the period from the late 1990s through the Great Recession.


Line chart with estimates of the marginal propensity to consume out of a $1 increase in housing wealth.

Line chart with estimates of the marginal propensity to consume out of a $1 increase in housing wealth for seven different research papers, covering the period starting before 1990 and up to early 2020. Estimates range from as high as 11 cents for the period from the late 1990s through the Great Recession. Estimates from 2012 to 2018 are much lower than most of estimates for prior periods, including JPMCI estimates which range from 0 to 0.16 cents.

Source: JPMorgan Chase Institute.

01

We estimate a housing wealth effect MPC of near zero for each year between 2013 and 2018.

For each year between 2013 and 2018, our estimated housing wealth effect MPC is both very small and statistically insignificant, implying the same MPC of zero for each year. This is consistent with data on equity extraction, which show that for the latter years in the range, equity extraction activity increased slightly but remained far below the historically high levels seen prior to the Great Recession.

Chart with marginal propensity to consume out of a $1 increase in housing wealth by year.

Bar chart examining the marginal propensity to consume out of a $1 increase in housing wealth by year, from 2013 to 2018. For each year, the estimated housing wealth effect MPC is both very small and statistically insignificant, implying the same MPC of zero for each year. The bar chart is overlaid with a line chart showing equity extraction by year, from 2013 and 2018, as the total combined volume of cash-out refinances and 2nd mortgages/HELOC consolidation in billions of dollars. Equity extraction activity increased slightly from 2014 to 2018, to a high of around $100 billion, but remained far below the historically high levels seen prior to the Great Recession.

Source: Federal Reserve Flow of Funds (accessed via FRED), JPMorgan Chase Institute

01

The marginal propensity to consume out of housing wealth is close to zero even for segments of the population with greater access to liquidity, through which they could finance increased consumption.

Even among homeowners with greater capacity to borrow against their homes (i.e. those with more equity in their homes), more available credit on credit cards, and higher liquid assets, the marginal propensity to consume out of housing wealth was near zero.

Marginal propensity to consume out of a $1 increase in housing wealth–subgroup analysis.

Bar chart examining the marginal propensity to consume out of a $1 increase in housing wealth by subgroups. Three subgroups include: home equity borrowing capacity (LTV groups of >= 80 with low leverage, 70-80 LTV with medium leverage, and <70 with high leverage), credit card borrowing capacity (below-median available credit, above-median available credit), and liquid assets (below-median savings, above median savings). The marginal propensity to consume is near zero for each subgroup.

Source: Source: JPMorgan Chase Institute

01

Implications

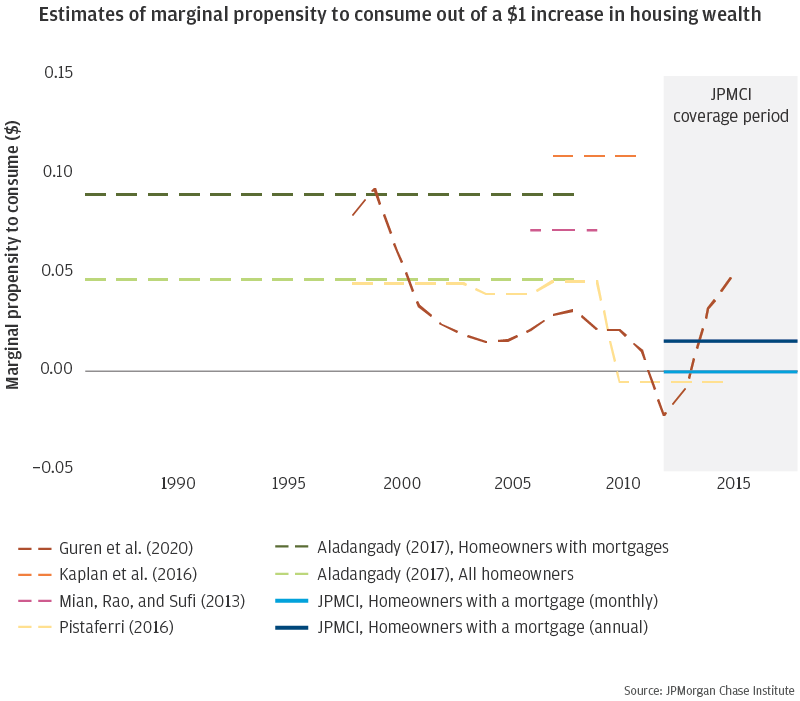
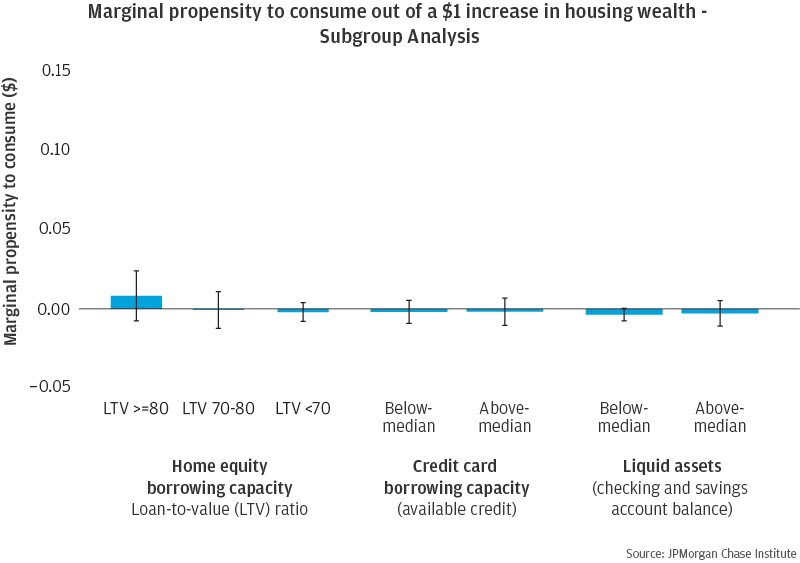
How do we reconcile the much smaller MPC out of housing wealth in the post-Great Recession period with a larger MPC during the preceding periods? We find that the volume of equity withdrawal in the post-Great Recession period was much lower than during the housing boom. Research suggests there are both demand and supply factors at play. After the financial crisis, a larger share of equity became concentrated in the hands of older and less credit-constrained borrowers who tend to have a lower demand for equity extraction. At the same time, tightened lending standards have reduced the supply of credit to more credit-constrained mortgage holders who may have greater demand for equity extraction. We contribute new evidence that a lack of demand to borrow against home equity contributed to a low marginal propensity to consume out of housing wealth: even homeowners with more equity (for whom it should be easy to borrow) did not consume more when housing wealth rose.

This research has several implications for policymakers and is particularly relevant as the economy comes to face a severe recession induced by the COVID-19 pandemic. First, homeowners entered the COVID-19 crisis with a substantial amount of illiquid wealth in the form of home equity. Given the importance of cash flow dynamics and liquidity as determinants of consumption and the ability to stay current on housing payments, measures that allow homeowners to preserve or increase liquidity in the face of financial distress, such as through forbearance or maintaining access to this home equity, could provide an important financial cushion. These types of measures carry risks, however, as home prices could depreciate in a recession, eroding the equity position of homeowners—and increased income volatility could make it more difficult for borrowers to meet debt obligations.

Second, a much smaller housing wealth effect diminishes the ability of conventional monetary policy—changes to short-term interest rates—to affect the real economy through the housing market, resulting in lower consumption and GDP growth than policymakers might have expected or hoped to stimulate. Had the housing wealth effect MPC remained at estimated pre-recession levels, we find that consumption and GDP would have been 0.1 to 1.5 percent and 0.1 to 1 percent higher, respectively, in each of the years from 2012 to 2018.2 As such, policymakers may need to lean more heavily on other channels of monetary policy and unconventional measures, as well as fiscal policies that provide households with liquidity during an economic downturn.

References

1.

The marginal propensity to consume is the proportion of an increase in income or wealth that a consumer chooses to spend on goods and services rather than save.

2.

Our estimates are very much a back-of-the-envelope calculation meant to convey the importance of this channel of monetary policy. We acknowledge that we have not taken into account general equilibrium effects, some of which may offset part of the impact on consumption and GDP.

Authors

Diana Farrell

Diana Farrell

Founding and Former President & CEO

Fiona Greig

Fiona Greig

Former Co-President

Chen Zhao

Chen Zhao

Housing Finance Research Lead