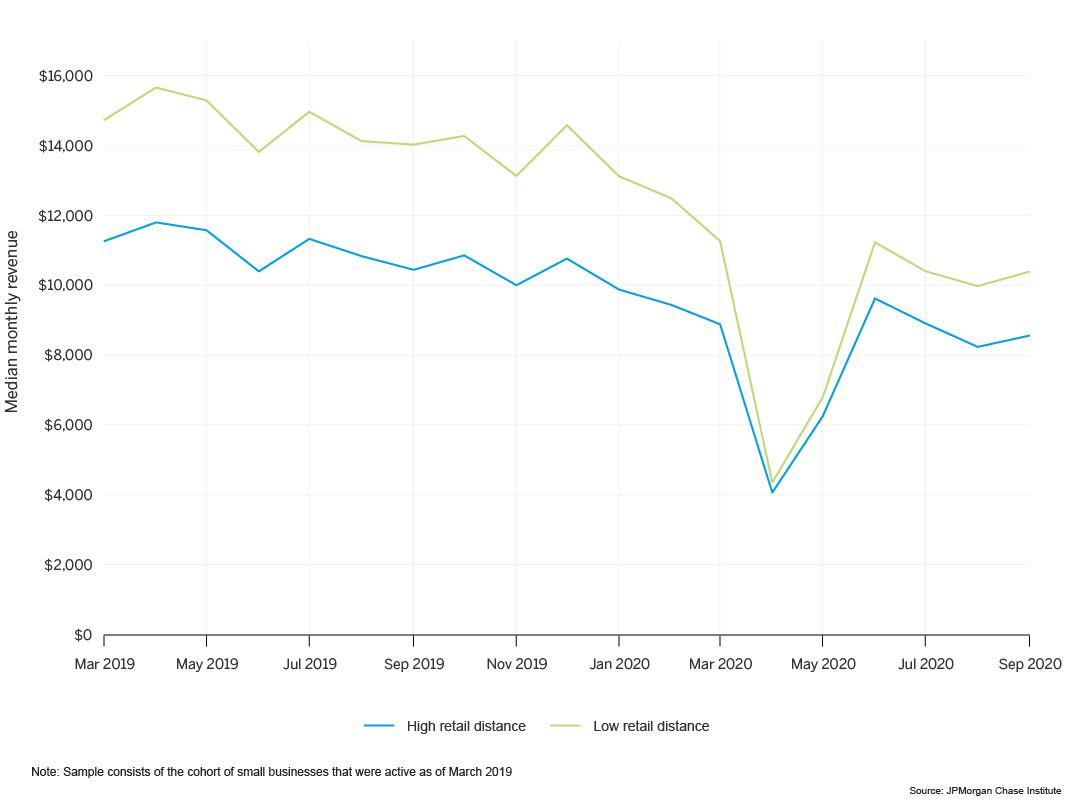
Figure 1: Revenues were 27 percent higher for firms located in low retail distance neighborhoods

Local decision makers have increasingly focused on policies and investments that aim to improve residents’ access to retail amenities in recent years (Farrell, Relihan, and Ward 2017). Oftentimes, these decisions are made focusing on the positive effects such policies/investments have on residents, viewing businesses as a factor in reducing these distances.
This brief expands the conversation by considering how small businesses may also benefit from policies that improve retail access. Neighborhoods where residents do not have to travel far for retail amenities often achieve this status via careful cultivation of infrastructure (e.g. walkability, transportation, placemaking). Although not the primary focus of policies that aim to improve resident retail access, local decision makers and advocacy groups have hypothesized that improving resident access to retail amenities can also benefit businesses along two dimensions–their ability to make a profit, and their ability to survive.
We explore to the extent to which consumer-facing small businesses located in neighborhoods where residents have low retail distances perform better and survive longer than firms located in neighborhoods where residents traveled further for retail goods.1,2,3 To facilitate this research, we analyzed a cohort of firms between March 2019 and September 2020 across several measures to provide a first look at how retail distances traveled by residents can also have an effect on small business outcomes.4 We found that, on the whole, neighborhoods with lower retail distances might perform slightly better, but may not survive at substantively higher rates.
Cash flows are one key indicator of the overall financial health of a small businesses. Firms that are able to sustain healthy demand for their product or services and have a solid customer base can expect to generate large and growing revenues. To the extent that a firm is able to keep their costs contained, they are able to generate higher profits. These profits then can be utilized to maintain a cash buffer to weather uncertainty, increase owner wealth, or reinvest in the business. We find that neighborhoods with low retail distances for residents also benefit small businesses, specifically when it comes to their revenues and profit margins.
Figure 1: Revenues were 27 percent higher for firms located in low retail distance neighborhoods

The typical business in a low retail distance neighborhood had higher revenues compared to businesses located in neighborhoods with high retail distances. Figure 1 shows monthly revenues for the typical firm located in a low and high retail distance neighborhood. Over the course of the series (March 2019 through September 2020), median revenues were about 27 percent higher for the typical firm located in a low retail distance neighborhood. This gap persisted across the income spectrum at different magnitudes; for example, in the lowest-income neighborhoods median revenues were on about 41 percent higher, while in the highest-income neighborhoods they were about 19 percent higher.
In between the months of March and May 2020 (the onset and initial shock of the COVID pandemic) revenues fell for the typical firm regardless of the retail distances traveled by residents in the neighborhoods. Moreover, the gap in median revenues shrunk during this period – from 27 percent to 14 percent. Median revenues then rose in the summer months through the fall, but settled at values below their pre-pandemic levels. Accordingly, the gap in revenues between the typical firm located in a low retail distance neighborhood versus one in a high retail distance revenue rose from 14 percent to 19 percent.
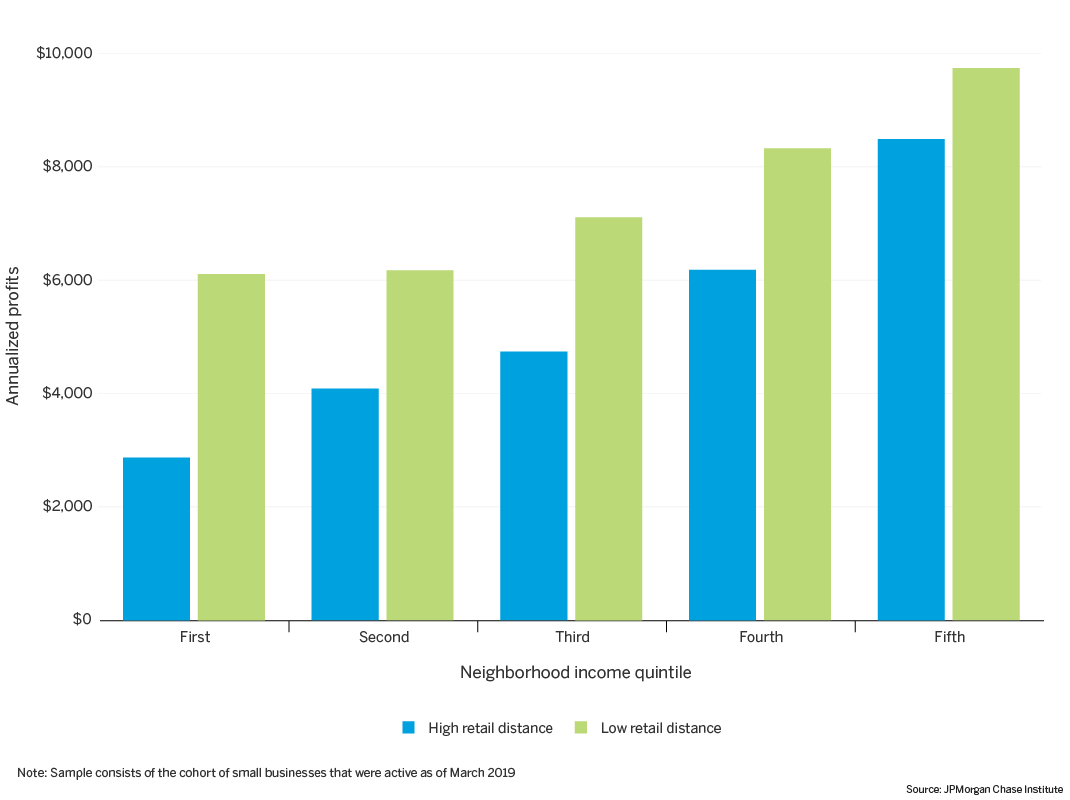
This difference in revenues may play a part in our observation that firms located in neighborhoods with low retail distances generally sustained slightly higher profit margins compared to those firms located in neighborhoods where residents have to travel further for retail. Between March 2019 and September 2020, the typical firm located in a low retail distance neighborhood had a median profit margin that was 0.3 percentage points higher than a firm located in a high retail distance neighborhood. On an annual basis, we estimated this gap to amount to an additional $2,150 in profit for the typical small business located in a low retail distance neighborhood compared to a firm located in a high retail distance neighborhood.
Figure 2: Annual profit gaps were largest in low-income neighborhoods, and smallest in high-income neighborhoods

Figure 2 displays the estimated annual profits of firms located in low and high retail distance neighborhoods across neighborhood income quintiles. We found that the difference in profit margins persisted across neighborhoods of all income levels; however, the difference was smaller in higher income neighborhoods. Notably, the estimated annual profits of the typical firm located in a low retail distance, low-income neighborhood were greater than the estimated annual profits of the typical firm located in a high retail distance, middle-income neighborhood.
Despite finding that firms in low retail distance neighborhoods were generally more profitable, firms in low retail distance neighborhoods did not exit at substantively lower rates in comparison to firms in high retail distance neighborhoods, both before and during the COVID pandemic. Moreover, we observed minimal difference in the level of cash buffer held by firms depending on the retail distances traveled by residents of the neighborhoods they are located in.
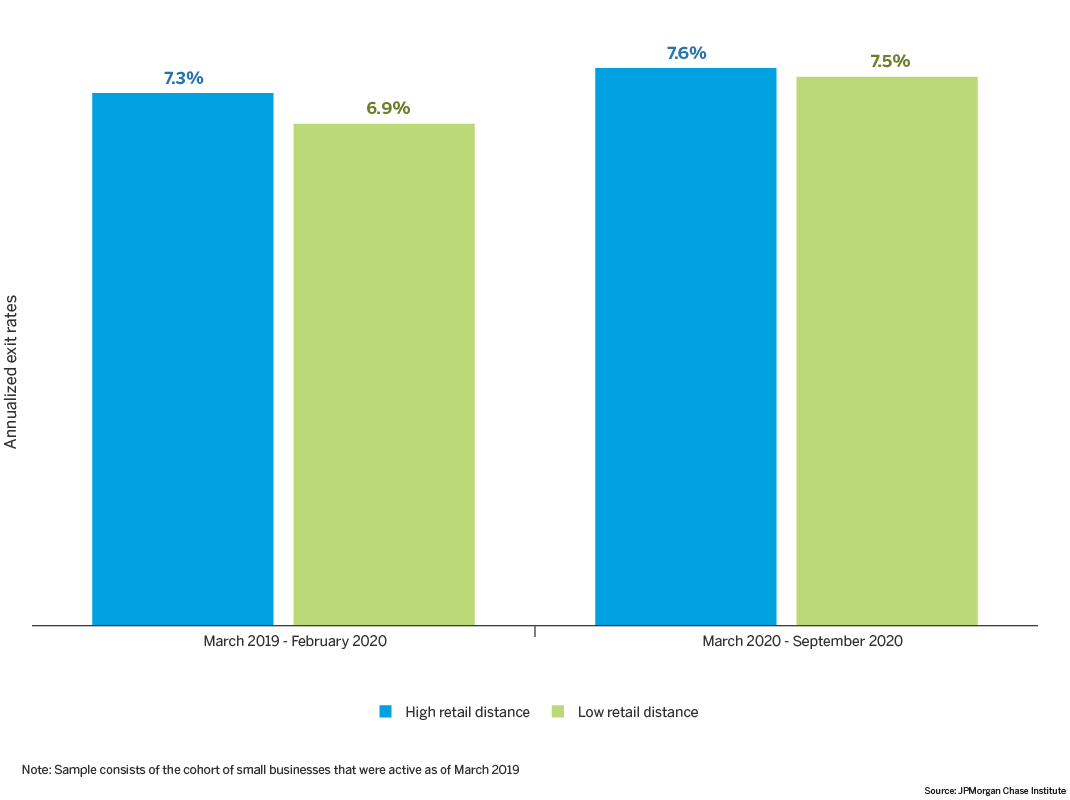
Figure 3: There was no substantive difference in annualized exit rates between neighborhoods with low / high retail distances

There were minimal differences in firm exit rates depending on resident retail distances. Figure 3 shows the proportion of firms that exited depending upon the retail distances traveled by the residents of the neighborhood the firms are located in across two time periods roughly corresponding to before and during the COVID pandemic. Firms were less likely to exit in low retail distance neighborhoods than they were in high retail distance neighborhoods–but the difference was negligible. Prior to the onset of the pandemic (March 2019 – February 2020), firms in low retail distance neighborhoods exited at an annual rate of 6.9 percent compared to an annual rate of 7.3 percent for firms located in high retail distance neighborhoods. During the pandemic (March 2020 – September 2020), we found that the annualized exit rates were largely similar, with firms in low retail distance neighborhoods having an annualized exit rate of 7.5 percent compared to 7.6 percent for firms located in high retail distance neighborhoods.
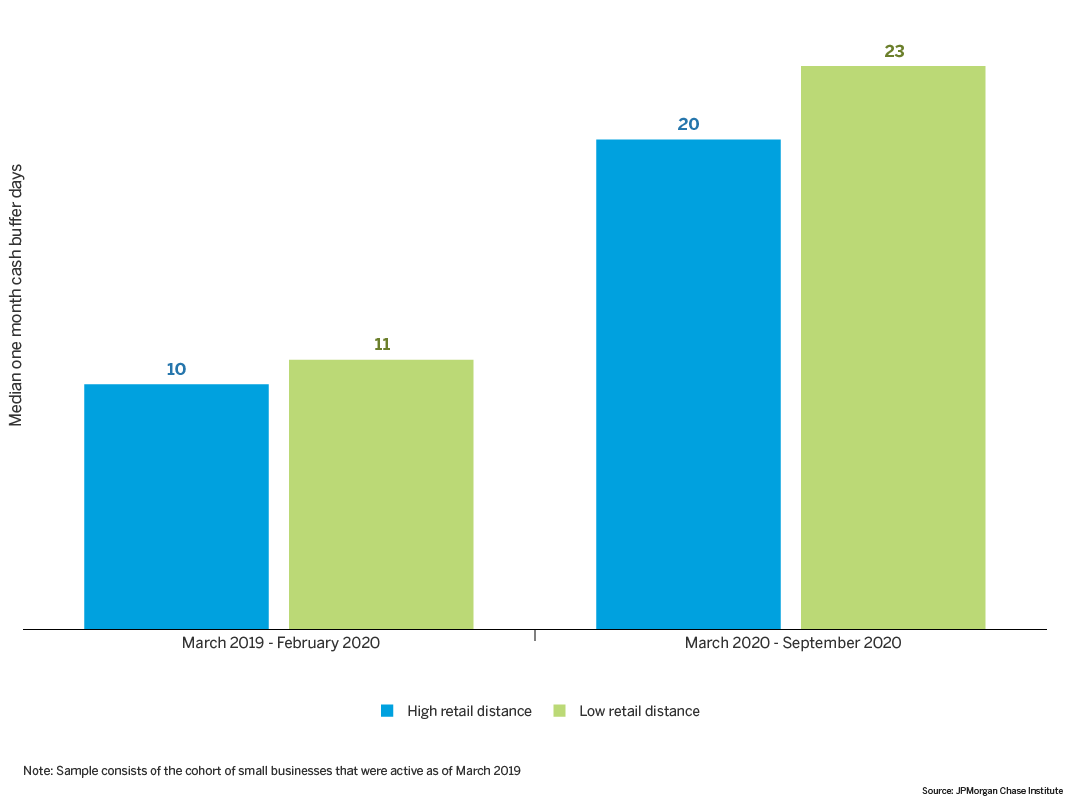
Figure 4: There was no substantive difference in cash buffer days held by firms in low / high retail distance neighborhoods

Cash buffer days are the number of days of cash outflows a business could pay out of its cash balance were its inflows to stop (Farrell and Wheat 2016). It can be thought of as a measure of the resiliency of a firm’s financial position, providing insight into how long a firm could stay afloat were it not able to conduct business as usual.
The similarity in firm exit rates may be partially driven by the relatively small differences in cash buffer days across the retail distance profile of the neighborhood the firm is located in. With the exception of the period between March and September 2020, we find that the typical firm located in a low retail distance neighborhood has, on average, one more cash buffer day in comparison to a firm located in a high retail distance neighborhood. Notably, prior research has shown that a single extra cash buffer day reduces the probability of exit by a small, but statistically significant, amount (Farrell, Wheat, and Mac 2020).
Between March and September 2020 (during the COVID pandemic), we saw that cash buffer days rose, regardless of the retail distances traveled by the residents in the neighborhood the firm is located in. We believe this rise in cash buffer was spurred by the increase in balances that were driven by the simultaneous influx of government assistance (such as, but not limited to, the Paycheck Protection Program) and cut back in outflows during the COVID pandemic. Interestingly, however, we observed that the gap in cash buffer days widened during this period to three days.
Our findings suggest that improving the resident retail distances of a neighborhood can also benefit the small businesses located in those neighborhoods, but may not be sufficient to improve survival rates.
In particular, some policy recommendations from these findings are:
We thank Anuradha Raghuram for her hard work and vital contributions to this research. Additionally, we thank Lindsay Relihan and Marvin Ward Jr. for their foundational research on retail distances.
This effort would not have been possible without the critical support of our partners from the JPMorgan Chase Consumer & Community Bank and Corporate Technology Solutions teams of data experts, including Michael Aguilar, Kyung Cho-Miller, Anoop Deshpande, Andrew Goldberg, Melissa Goldman, Senthilkumar Gurusamy, Derek Jean-Baptiste, Brian Maddox, Albert Raymond, Anthony Ruiz, Subhankar Sarkar, Breann Zickafoose, and from our internal partners and JPMorgan Chase Institute team members including Haley Dorgan, James Duguid, Elizabeth Ellis, Alyssa Flaschner, Fiona Greig, Courtney Hacker, Chris Knouss, Sarah Kuehl, Sruthi Rao, Parita Shah, Tremayne Smith, Gena Stern, Nicholas Tremper, and Preeti Vaidya.
We would like to acknowledge Jamie Dimon, CEO of JPMorgan Chase & Co., for his vision and leadership in establishing the Institute and enabling the ongoing research agenda. Along with support from across the Firm—notably from Peter Scher, Max Neukirchen, Joyce Chang, Marianne Lake, Jennifer Piepszak, Lori Beer, Derek Waldron, and Judy Miller—the Institute has had the resources and support to pioneer a new approach to contribute to global economic analysis and insight.
Farrell, Diana, and Christopher Wheat. 2016. “Cash is king: Flows, balances, and buffer days.” JPMorgan Chase Institute.
Farrell, Diana, Lindsay Relihan, and Marvin Ward. 2017. “Going the Distance: Big Data on Resident Access to Everyday Goods” JPMorgan Chase Institute.
Farrell, Diana, Chris Wheat, and Chi Mac. 2020. “Small Business Owner Race, Liquidity, and Survival.” JPMorgan Chase Institute.
We analyzed firms located in 16 major metro areas: Atlanta, GA; Seattle, WA; San Francisco, CA; San Diego, CA; Portland, OR; New York, NY; New Orleans, LA; Miami, FL; Phoenix, AZ; Houston, TX; Detroit, MI; Denver, CO; Dallas, TX; Columbus, OH; Chicago, IL; and Los Angeles, CA.
We limit the set of firms that are being analyzed to the following industries: personal services, restaurants, and retail establishments.
We define a neighborhood (ZIP code) as having “low” or ”high” retail distances depending on whether the median distance traveled by the residents of that neighborhood is below or above the median distance traveled by residents within the CBSA. Moreover, we fix the retail distance profile of a neighborhood to their March 2019 values.
We construct this cohort by taking the sample of firms that are sufficiently active and firmographically small as of March 2019.
Authors

Chi Mac
Business Research Director

Chris Wheat
President, JPMorganChase Institute

Diana Farrell
Founding and Former President & CEO

Bryan Kim
Research Engineer, JPMorgan Chase Institute