Findings

The JPMorgan Chase Institute’s analysis of Local Consumer Commerce showed a decline in spending growth throughout 2016 which was most prominent amongst older consumers. When we compared consumers 55 and older to consumers under 35, this decline was most stark in spending growth for restaurants and other services.

The economic decisions made by older consumers are increasingly important given the aging of the consumer base throughout the US. The US Census Bureau projects that more than 20 percent of the US population will be 65 or older by 2030, up from 13 percent in 2010.1 To better understand the economic and policy consequences of this demographic shift, the Institute explored the components of the decline in spending growth from older Americans.

Key Facts

  • Spending growth among consumers 55 and older declined 4.9 percentage points between December 2013 and December 2016.3
  • Restaurant spending growth by consumers 55 and older declined by 8.8 percentage points over the same period.
  • Growth in spending on other services by consumers 55 and older also declined by 7.2 percentage points.

The analysis employs the Local Consumer Commerce (LCC) data asset, which encompasses over 19 billion de-identified credit and debit card transactions from over 59 million consumers in 15 major metropolitan areas. The LCC Index, built on the LCC asset, captures year-over-year growth in everyday spending across a range of consumer and merchant groups. The transaction-level data in the LCC data asset are augmented by the zip codes of both the consumer and merchant, providing a local, place-based view of spending growth. Consequently, we can evaluate trends at both the city level and across the 15 cities we track.2

01

Older consumers were the largest driver of decline in the LCCI

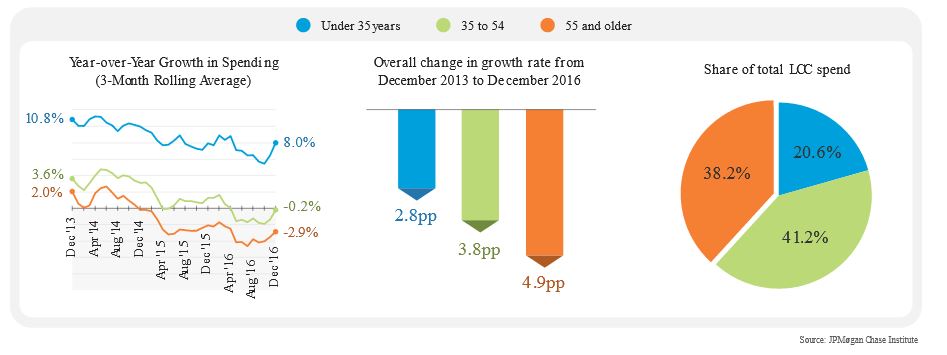
The share of total spending by older consumers is large enough that growth declines within this group can affect the overall growth rate (see Figure 13). In December 2016, consumers between the ages of 35 and 54 and consumers 55 and older made up 41.2 percent and 38.2 percent of total LCC spend, respectively. In contrast, consumers under 35 only made up 20.6 percent of total LCC spend in the same time period.

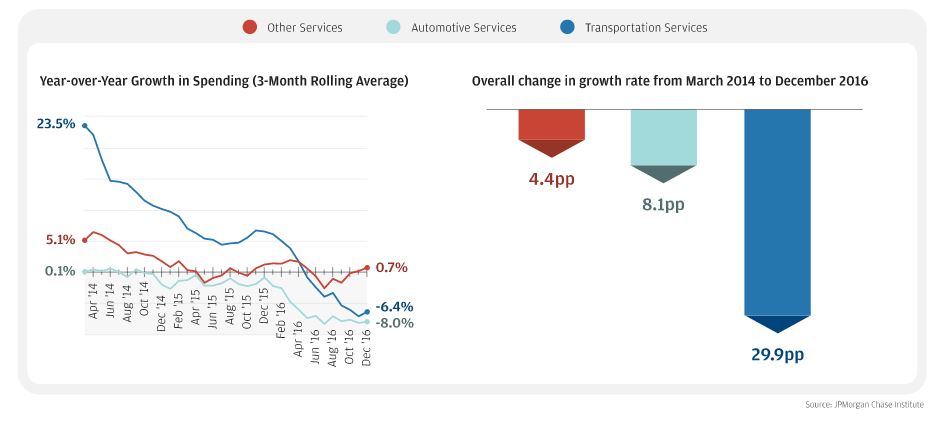
Older consumers generally have lower spending growth relative to their younger counterparts across all product types. However, to better understand which age groups have driven the overall decline in spending growth, we focus on the gap between growth rates. While this gap has been fairly stable across most product types over time, spending growth on restaurants (17 percent of total LCC spending) and other services (15.7 percent of total LCC spending) have seen a widening gap.

Line chart describes about Year-over-Year Growth in Spending (3-Month Rolling Average), Overall change in growth rate from December 2013 to December 2016 and Share of total LCC spend

Line chart showing Year-over-Year Growth in Spending (3-Month Rolling Average). Year-over-Year Growth in Spending from those under 35 years old went from 10.8% in December 2013 to 8.0% in December 2016 (a 2.8 percentage point decrease). For those 35 to 54 years old, Year-over-Year Growth in Spending went from  3.6% to -0.2% (a 3.8 percentage point decrease). For those 55 years and over, Year-over-Year Growth in Spending went from 2.0% to -2.9% (a 4.0 percentage point decrease).

Spending by those under the age of 35 years accounted for 20.6 percent of total LCC spend. Those 35 to 54 years accounted for 41.2 percent of spend, and those 55 and older accounted for 38.2 percent of spend.

Source: JPMorgan Chase Institute

01

Restaurant spending growth declined fastest for older consumers

In March 2014, spending growth at restaurants for consumers under 35 was 8.6 percentage points higher than restaurant spending growth for consumers 55 and older. By December 2016, that difference increased to 13.8 percentage points. Surprisingly, this slowdown in dining out was not accompanied by an increase in spending at grocery stores. Spending growth at restaurants dropped from a positive 5.0 percent in March 2014 to a 3.3 percent decline in December 2016, while spending growth at grocers dropped from a positive 0.7 percent to a 2.6 percent decline over the same time period.

Line chart describes about Year-over-Year Growth in Spending (3-Month Rolling Average) 13.6% to 10.5% and Overall change in growth rate from March 2014 to December 2016 3.1pp to 8.3pp

Line chart showing Year-over-Year Growth in Restaurant Spending (3-Month Rolling Average). Year-over-Year Growth in Spending from those under 35 years old went from 13.6% in March 2014 to 10.5% in December 2016 (a 3.1 percentage point decrease). For those 35 to 54 years old, Year-over-Year Growth in Spending went from  7.6% to 0.9% (a 6.7 percentage point decrease). For those 55 years and over, Year-over-Year Growth in Spending went from 5.0% to -3.3% (an 8.3 percentage point decrease).

Source: JPMorgan Chase Institute

01

Other services spending growth also declined fastest for older consumers

Over the March 2014 to December 2016 period, the gap in growth on other services spending between consumers under 35 and consumers 55 and older increased from 10.6 percentage points to 13.8 percentage points. The other services product type captures a broad array of products; like restaurant spending, older consumers account for a larger proportion of spending on other services than their younger counterparts. In December 2016, consumers under 35 accounted for just 20.6 percent of spending on other services. Consumers between 35 and 54, and consumers 55 and older, accounted for 40.4 and 39.0 percent, respectively. We find that the largest decline in spending growth from older consumers within other services came from transportation (e.g. subways and buses) and automotive (e.g. car repairs and oil changes) services.4

Line chart describes about Year-over-Year Growth in Spending (3-Month Rolling Average) 16.6% to 12.6% and Overall change in growth rate from March 2014 to December 2016 4.00pp to 7.2pp

Line chart showing Year-over-Year Growth in Other Services Spending (3-Month Rolling Average). Year-over-Year Growth in Spending from those under 35 years old went from 16.6% in March 2014 to 12.6% in December 2016 (a 4.0 percentage point decrease). For those 35 to 54 years old, Year-over-Year Growth in Spending went from  7.8% to 2.4% (a 5.4 percentage point decrease). For those 55 years and over, Year-over-Year Growth in Spending went from 6.0% to -1.2% (a 7.2 percentage point decrease).

Source: JPMorgan Chase Institute

01

Spending on transportation and automotive services had the greatest declines on other services spending among older consumers

Line chart describes about Year-over-Year Growth in Spending (3-Month Rolling Average) 23.5% to -6.4% and Overall change in growth rate from March 2014 to December 2016 4.4pp to 29.9pp

Line chart showing Year-over-Year Growth in Spending (3-Month Rolling Average). Year-over-Year Growth in Spending for Transportation Services went from 23.5% in March 2014 to -6.4% in December 2016 (a 29.9 percentage point decrease). For Automobile Services, Year-over-Year Growth in Spending went from  0.1% to -8.0% (an 8.1 percentage point decrease). For Other Services, Year-over-Year Growth in Spending went from 5.1% to 0.7% (a 4.4 percentage point decrease).

Source: JPMorgan Chase Institute

The shifts in behavior among older consumers have significance at both the local and national levels. In particular, these changes have implications for decision makers that monitor and analyze changes in the economic climate and tax bases of major urban centers. JPMC data offers an unprecedented and nuanced view of activity that can inform economic analysis and forecasting for policymakers as the demographic characteristics of the population evolve over time.

Suggested Citation

Farrell, Diana and Bryan Kim. “Seniors Lead the Slowdown in Local Consumer Commerce.” JPMorgan Chase Institute, 2017.

References

2.

As of June 2017, there are 15 LCC cities: Atlanta, Chicago, Columbus, Dallas-Ft. Worth, Denver, Detroit, Houston, Miami, Los Angeles, New York, Phoenix, Portland (OR), San Diego, San Francisco, and Seattle.

3.

Note that all growth rates in this post reflect 3-month rolling averages. We smoothed these series to highlight longer term trends.

4.

Demand for transportation services is partially driven by the need for consumers to travel between their residence and the location of the merchants at which they shop. The Institute has studied how these distances change over time in our brief titled Going The Distance: Big Data on Retail Access.