Research

Income growth and housing affordability in Austin

May 14, 2025

Austin’s labor market has experienced strong growth—with employment more than doubling since 2000 versus a nationwide increase of 20 percent. Despite its strong job gains, the housing market may be constraining further expansion: Housing stock growth in Austin has been among the highest in the country, but the area has consistently seen home ownership costs somewhat higher relative to median incomes than the national average.1 2 Given significant population changes, it can be challenging for publicly available data to capture the experience of Austin residents in terms of changing housing affordability. For example, differences in the relative incomes of people moving into the area can distort the price-to-income relationship relevant for existing residents. Unique de-identified banking data from Chase allows Institute research to measure income growth of individuals over time, linked at the ZIP code-level with home prices, to help fill this data gap.

Figure 1 captures Austin’s 2019−2024 change in home prices relative to median growth in take-home pay for individuals of typical first-time homebuying age: those 25−44 years-old in 2019. The chart shows the extent to which income growth kept pace (or not) with home prices within different geographic areas. Following studies on pandemic-era changes in housing, we break out dynamics across categories representing the densely populated city center, other urban areas, suburbs, and rural areas.3 Growing prominence of work-from-home arrangements may help explain changes in housing demand and proximity to employment opportunities.4

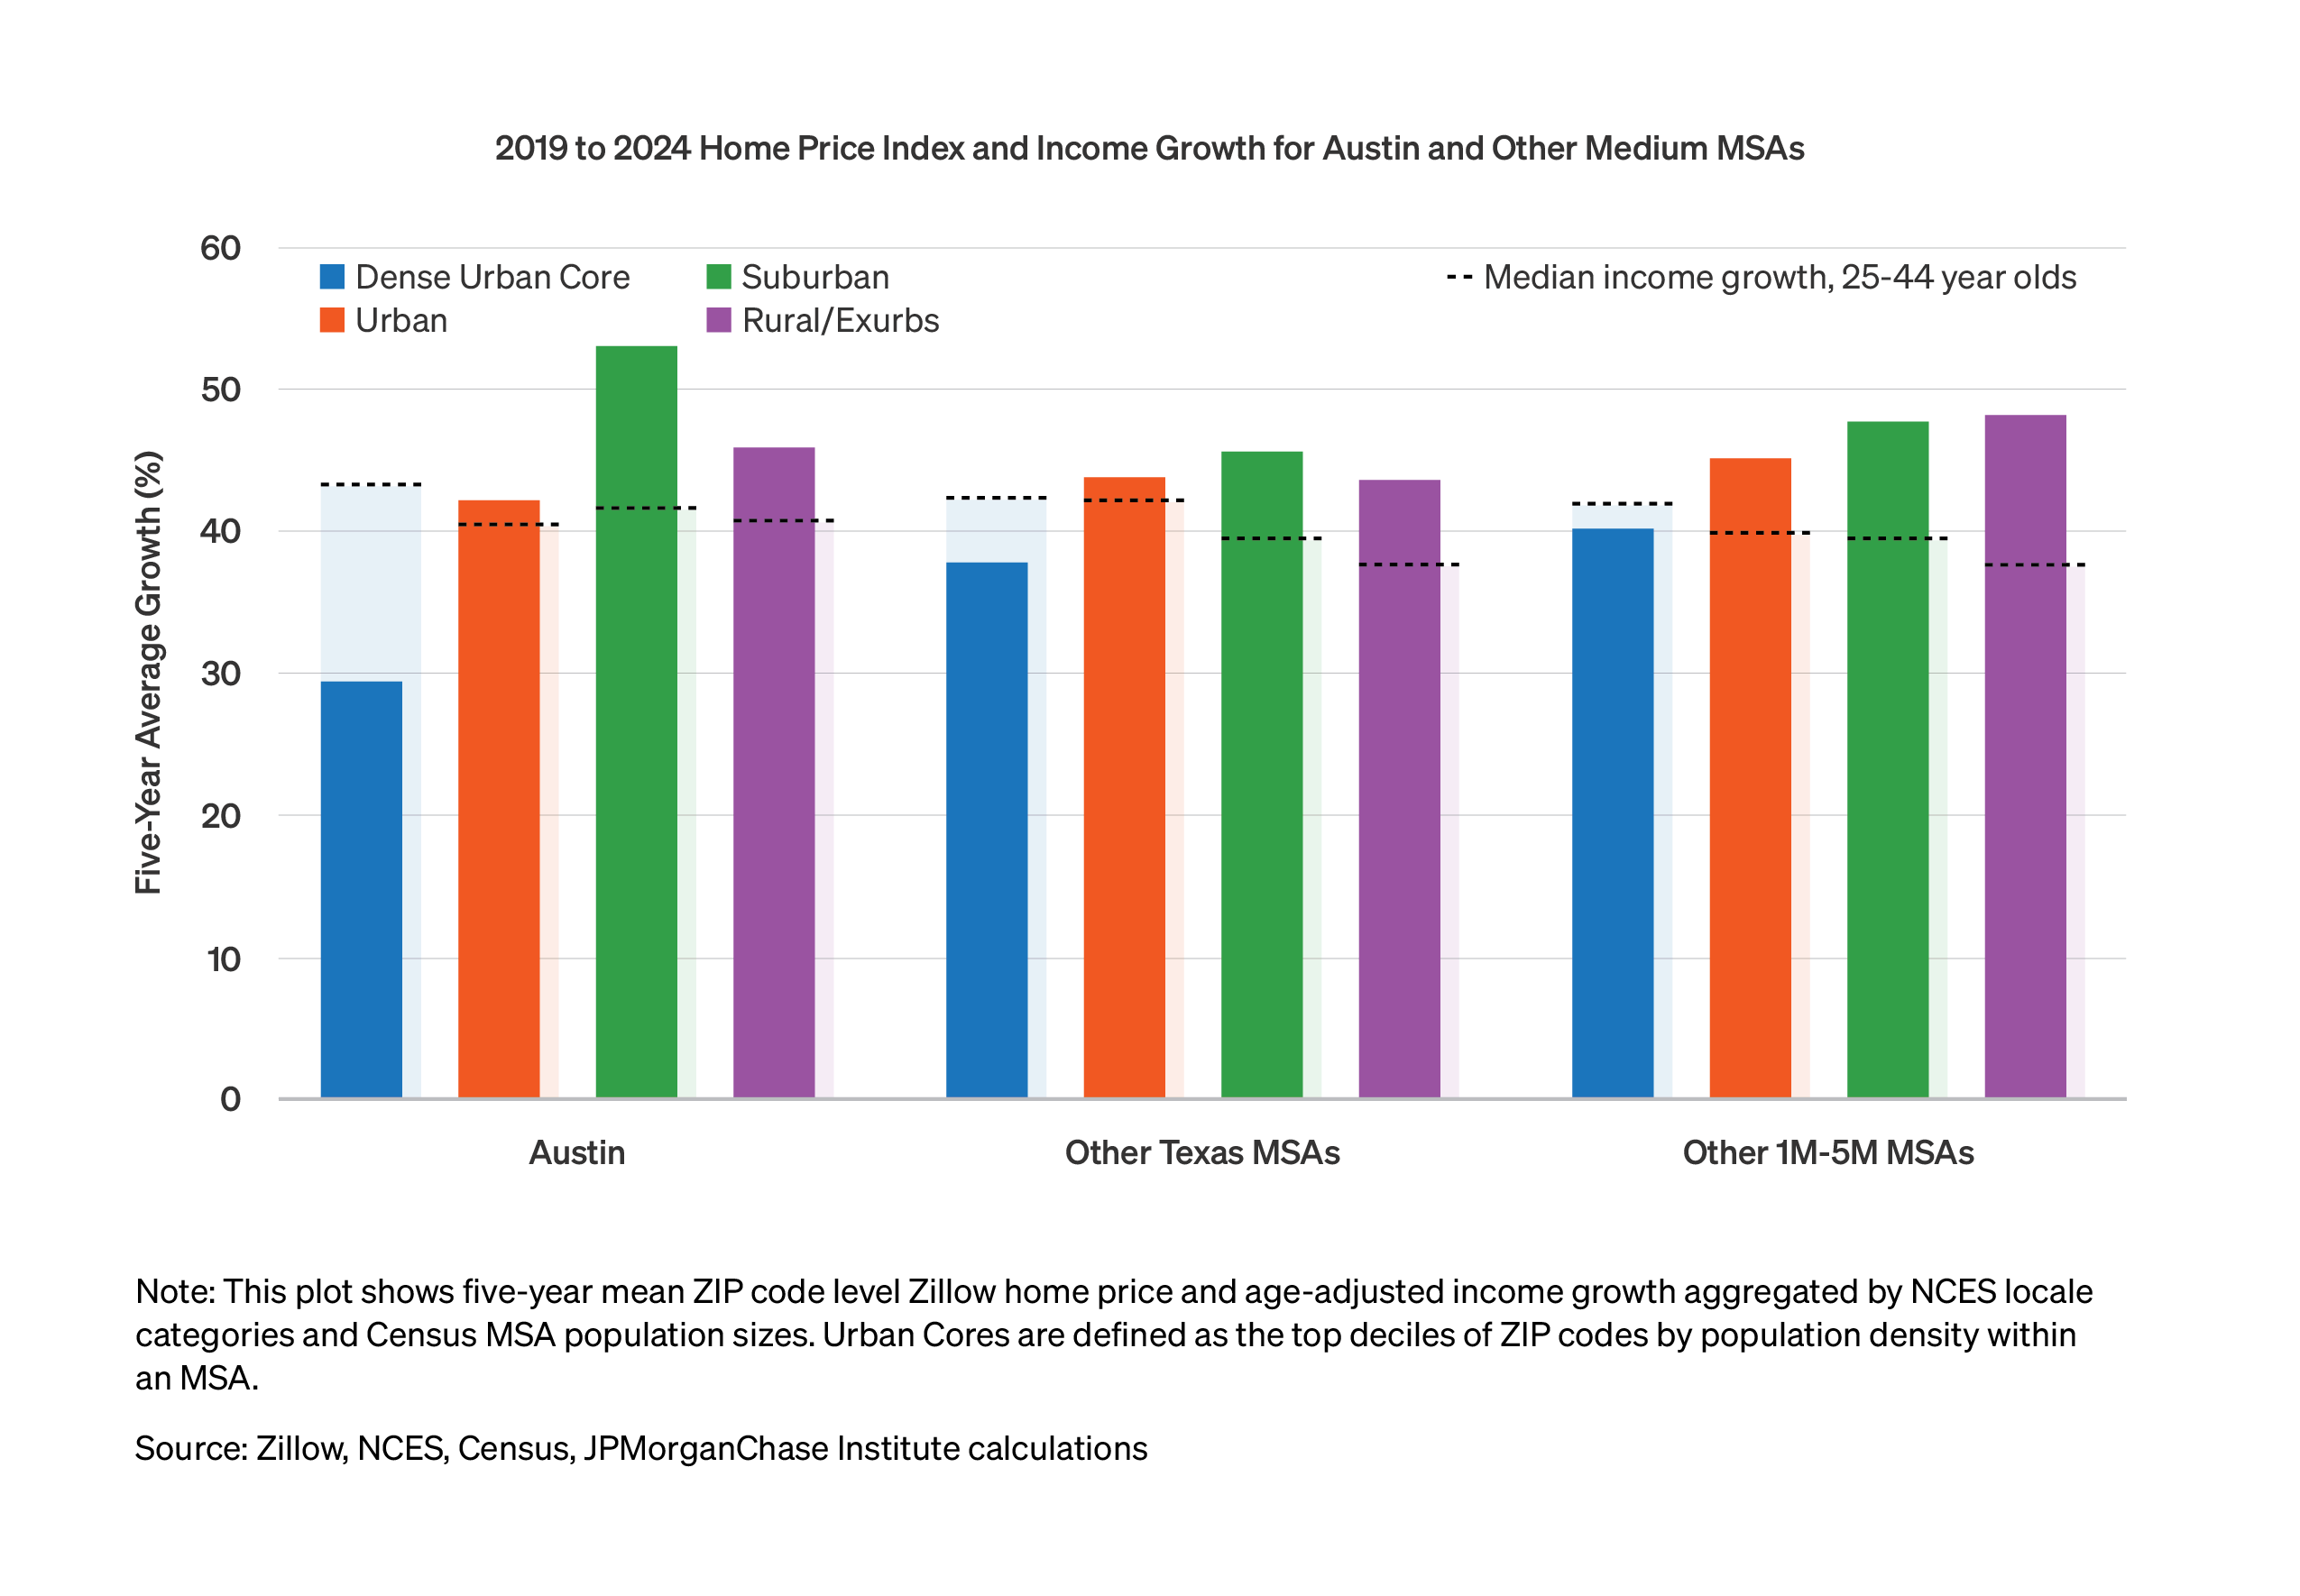
A bar chart showing both five-year average Zillow home price growth and age-adjusted median income growth for 25 to 44 year-olds from 2019 through 2024, by urbanicity classification, for the MSA of Austin, the average of Other Texas MSA’s, and the average Other US MSA’s with Populations Between One to Five Million.

For Austin, Other Texas MSA’s and Other MSA’s with Populations One to Five Million, the figure shows a bar for four urbanicity classifications from left to right: Dense Urban Core, Urban, Suburban and Rural/Exurbs, both the Zillow five-year price growth (Solid Bar) and the five-year average growth in age-adjusted median incomes for 25 to 44 year-olds (Faint Bar), with the Faint Bar behind the Solid Bar, slightly wider, and with a black dotted line at the top of the bar.

The Solid Bars for Austin, read approximately: 29 percent, 42 percent, 53 percent, and 46 percent for Dense Urban Core, Urban, Suburban and Rural/Exurbs, respectively. The Faint Bars for Austin, read approximately: 43 percent, 40 percent, 42 percent, and 41 percent for Dense Urban Core, Urban, Suburban and Rural/Exurbs, respectively.

The Solid Bars for the Other Texas MSA’s, read approximately: 38 percent, 44 percent, 46 percent, and 44 percent for Dense Urban Core, Urban, Suburban and Rural/Exurbs, respectively. The Faint Bars for Other Texas MSA’s, read approximately: 42 percent, 42 percent, 40 percent, and 38 percent for Dense Urban Core, Urban, Suburban and Rural/Exurbs, respectively.

The Solid Bars for the Other MSA’s with Populations One to Five Million, read approximately: 40 percent, 45 percent, 48 percent, and 48 percent for Dense Urban Core, Urban, Suburban and Rural/Exurbs, respectively. The Faint Bars for Other MSA’s with Populations One to Five Million, read approximately: 42 percent, 40 percent, 39 percent, and 38 percent for Dense Urban Core, Urban, Suburban and Rural/Exurbs, respectively.

Austin’s suburbs and rural areas became less affordable relative to the city center. Median income growth was somewhat higher in the urban center, despite lower home price growth. The magnitudes of the differences across the greater Austin area have been more pronounced than other major Texas cities and similarly sized MSAs (1−5 million residents, relative to the Austin MSA of 2.5 million) across the country. From this perspective, the 2019−2024 period in Austin was somewhat closer to the dynamic seen in larger cities—those with populations over 5 million—like Chicago

Changes in housing demand due to the pandemic and the rise in the availability of working-from-home jobs largely explain the differences in home price trends—termed the “donut” effect in Ramani and Bloom (2022), recognizing depressed activity at the center of many cities. Still, the rise in interest rates over this period has led increases in mortgage costs for potential homebuyers that outstrip income growth, even for the urban areas of Austin. Those seeking more space in the suburbs have seen affordability conditions worsen by more.

This material is a product of JPMorgan Chase Institute and is provided to you solely for general information purposes. Unless otherwise specifically stated, any views or opinions expressed herein are solely those of the authors listed and may differ from the views and opinions expressed by J.P. Morgan Securities LLC (JPMS) Research Department or other departments or divisions of JPMorgan Chase & Co. or its affiliates. This material is not a product of the Research Department of JPMS. Information has been obtained from sources believed to be reliable, but JPMorgan Chase & Co. or its affiliates and/or subsidiaries (collectively J.P. Morgan) do not warrant its completeness or accuracy. Opinions and estimates constitute our judgment as of the date of this material and are subject to change without notice. No representation or warranty should be made with regard to any computations, graphs, tables, diagrams or commentary in this material, which is provided for illustration/reference purposes only. The data relied on for this report are based on past transactions and may not be indicative of future results. J.P. Morgan assumes no duty to update any information in this material in the event that such information changes. The opinion herein should not be construed as an individual recommendation for any particular client and is not intended as advice or recommendations of particular securities, financial instruments, or strategies for a particular client. This material does not constitute a solicitation or offer in any jurisdiction where such a solicitation is unlawful.

Footnotes

1.

See FRED; Glaeser (Figure 3).

2.

See the Atlanta Fed’s Home Ownership Affordability Monitor. The methodology scales the cost of homeownership—largely driven by home prices and mortgage interest rates—to median incomes.

3.

See Ramani and Bloom (2022). 

4.

See Mondragon and Wieland (2022).

Authors

Chris Wheat

Chris Wheat

President, JPMorganChase Institute

George Eckerd

George Eckerd

Wealth and Markets Research Director