
Figure 1: Key Small Business Segments

Creating thriving communities together
See how our clients and partners—from small business owners to workforce training leaders—work with JPMorganChase to drive meaningful impact and economic growth where they live and work.
Learn moreLatest news

Veteran’s Unconventional Path to Landing her Dream Job in Tech
U.S. Army Veteran Ashley Wigfall transitioned to a civilian role and charted her path to technologist through mentorship and skills training at the JPMorgan Chase tech hub in Plano, Texas.
Learn more
A segmentation of the small business sector can provide a map that links empirical research to likely areas of small business policy impact. To this end, the JPMorgan Chase Institute has engaged with other small business stakeholders to identify three key policy-relevant distinctions about the sector, along with three key takeaways about these different kinds of small businesses:
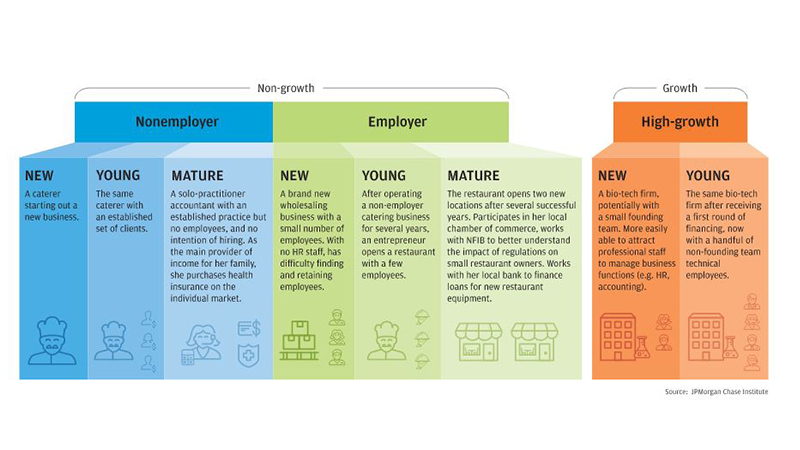
Figure 1: Key Small Business Segments
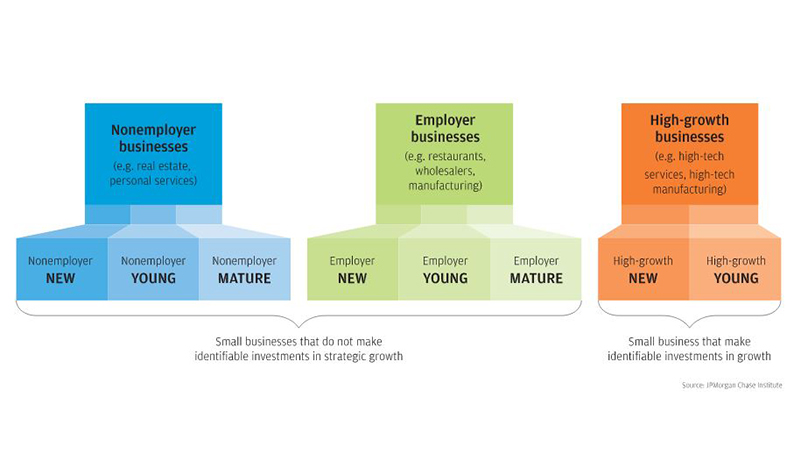
Figure 1 shows how these three core dimensions divide the small business sector into eight meaningful and distinct segments. The six segments depicted on the left of the figure capture small businesses that do not make identifiable investments in strategic growth. We further differentiate these non-high growth businesses into nonemployer and employer small businesses, and then differentiate the nonemployer and employer categories into three age categories. The two segments depicted on the right capture small business that make identifiable investments in growth. We do not differentiate nonemployers and employers among these growth-oriented firms—by construction many will hire employees early in their tenure. We also do not reserve a category for mature high-growth small businesses. This choice reflects our view that identifiable investments in strategic growth that actually will achieve substantial growth most likely occur within the first few years of a business.
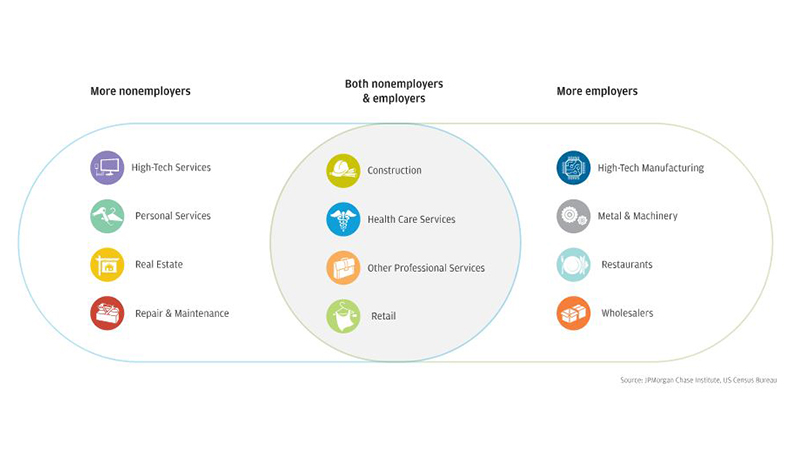
The core dimensions of employment, age and growth inclination provide a conceptual framework that identifies a manageable number of key segments of the small business sector. Other characteristics of small businesses and their owners illustrate the heterogeneity of the sector even further. For example, while both employer and nonemployer businesses exist across all industries, small businesses in some industries are relatively more likely to be employer businesses, while in other industries small businesses are more likely to be nonemployers. Figure 2 illustrates how twelve of the industries that best characterize the small business sector bring life to the distinction between employer and nonemployer businesses.
Figure 2: Industries Vary in their Share of Employer and Nonemployer Small Businesses
With this heterogeneity in mind, this brief describes the three core dimensions of employment, age, and growth orientation in detail along with existing research that sheds light on the importance of these distinctions to the economy and its growth. We then identify policy impact areas most closely related with each of the eight segments.
Policymakers frequently point to the significant role that the small business sector plays in job creation. The sector provides jobs for 80 million people in the U.S. Thirty percent of these jobs are the jobs of the owners of nonemployer businesses, while 70 percent are the jobs of the employees of employer small business. Given the prominence of job creation in the policy conversation, we first draw attention to the distinction between those small businesses who have employees and those that do not.1
Both nonemployer businesses and employer businesses can contribute to net job creation and economic growth. A person can transition out of unemployment either through finding a job at a small growing restaurant, or by going into business on her own as an independent caterer. However, in many cases, nonemployers and employers make qualitatively distinct contributions to the economy. Figure 3 provides one lens on these different contributions by depicting the relative share of firms and employees for each of the eight segments proposed here, and drawing particular attention to the distinct contributions of nonemployers and employers.
Figure 3: In 2014, Most Small Businesses were Nonemployers, but a Smaller Number of Employer Firms Drove Most Small Business Employment
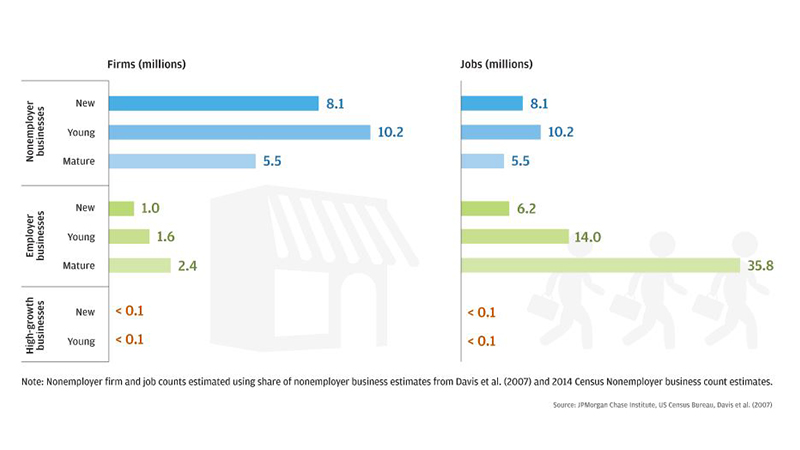
As Figure 3 shows, the overwhelming majority of small businesses in the small business sector are nonemployer businesses. Of the 28.4 million small businesses in the U.S. in 2016, 23 million had no employees. Moreover, nonemployer businesses provided some degree of economic livelihood to 23 million of the 160 million people in the U.S. labor force.2 In this sense, nonemployer firms of all ages can impact the U.S. economy by creating wealth and income for the households of their owners, with young nonemployer businesses playing the largest role.
Moreover, nonemployer businesses also show a greater extent of dynamism than employer businesses, exhibiting higher entry rates, though higher exit rates as well. Given the size and vitality of this segment, policies directed at these business owners could affect the economic lives of significant numbers of households, especially to the extent that the policies address the unique challenges small nonemployers face.
In contrast, Figure 3 shows that most people who work for a small business work for an employer business—nearly half at mature employer small businesses. The significant role of these employer small businesses in generating and sustaining employment frequently draws the attention of policymakers significant role. While nonemployer businesses overshadow employer businesses in absolute counts of businesses and in their share of new firm formation, employer businesses account for larger shares of overall revenues, employment and job creation, and innovative activity. In 2014, 57.5m people worked for small employer businesses with fewer than 500 employees.
Notably, a very small share of businesses show signs of significant growth—as a result, these firms make up a tiny fraction of the overall universe of small businesses, both in terms of firms and employees.3
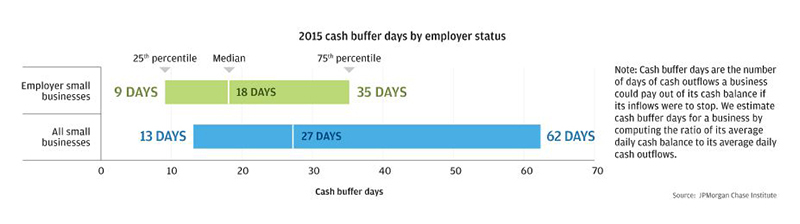
While the typical employer small business makes a greater aggregate contribution to the economy than the typical nonemployer business, the demands of employment can make them more fragile as well. In The Ups and Downs of Small Business Employment, we found that employer small business operate with substantially less cash liquidity than nonemployer businesses, when their cash liquidity was scaled against their typical cash outflows, as depicted in Figure 4.
Figure 4: Employers Operated with Fewer Cash Buffer Days than Non employers in 2015
A second key distinction among small businesses is their age. Thirty-two percent of all small businesses in the U.S. are new (0-2 years), 40 percent are young (3-10 years), and 28 percent are mature (11 or more years). A major theme of recent research about small businesses has been to differentiate young small businesses from their more mature counterparts, and identify the differential contribution of younger small businesses to the economy. Indeed, the policy interventions that might support a technology startup or service shop in its first few years might differ substantially from those needed to support the same business several years later after it has stabilized its business model.
While business age is an important differentiator for both employer and nonemployer businesses, it is likely useful to think of the age of a business differently across these two segments. For employer small businesses, the hiring of a first employee is a significant commitment to participation in the economy through job growth and employment. In contrast, the age of a nonemployer cannot be marked to the hiring of a first employee. Still, the time since earlier initial commitments to sustained business economic activity is important. Such activities could include claiming self-employment tax treatment or filing business taxes, acquiring a business-specific financial service, or registering the business as a corporation or an LLC. These differences notwithstanding, we identify three distinct age categories that likely shape the experiences of both employer and nonemployer small businesses. We define new business as those two or fewer years old, young firms as those that are three to ten years old, and mature businesses as those that are at least eleven years old.
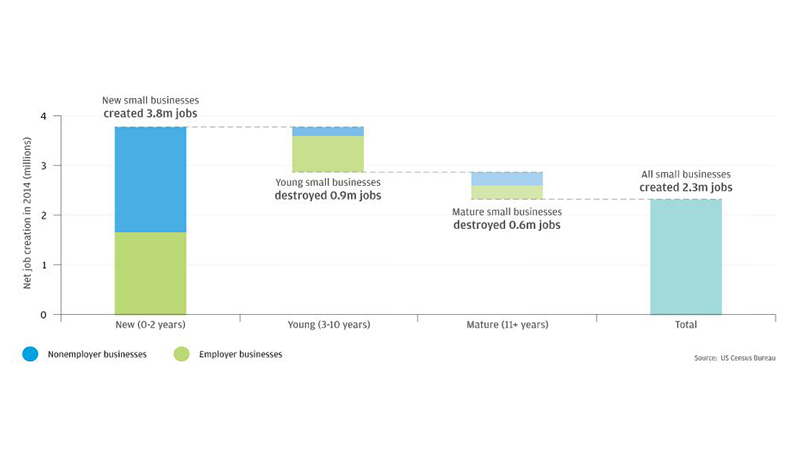
Among both employer and nonemployer businesses, business age is a significant determinant of the extent to which small businesses contribute to the economy through job creation. Research by John Haltiwanger, Ron Jarmin and Javier Miranda has shown that new businesses create nearly all net new jobs, in part driven by the fact that new employer firms by definition create new jobs, and most new employer firms are small firms. Moreover, Figure 5 shows that the only age group that makes positive net contributions to job growth is new small businesses. In aggregate, new employer and nonemployer created 3.8 million net jobs in 2014, while both young and mature nonemployer and employer small businesses were net job destroyers.
Figure 5: All Net Job Creation Came from New Employer and Nonemployer Businesses
While new firms are responsible for a disproportionate share of net job creation among small businesses, they are also very unstable. Fully 31 percent of employer businesses exit within their first two years and fail to survive long enough to become young businesses. Moreover, while new businesses play an outsized role in job creation, they lose significant numbers of jobs as well. In 2014, 20.8 percent of jobs at new small businesses were lost—twelve percent from business exit, as compared to only 16.2 percent for young businesses and 10.5 percent for mature small businesses.
Viewed through this lens, young businesses represent the businesses that have survived the most difficult first two years, many of which have the prospect of making longer-term and more sustainable contributions to the economy. Notably, many of the young employer businesses that eventually create jobs began their lives as young nonemployer businesses.
While mature businesses may create fewer net jobs than their younger counterparts, these businesses comprise the majority of the small business sector. Of the 5 million small employer businesses with less than 500 employees, 2.5 million are 11 or more years old, and 37.2 million of the 57.5 million employees who are employed at small employer businesses are employed at these older businesses, and their share of both small firms and employment at small firms has grown steadily over the last 20 years.
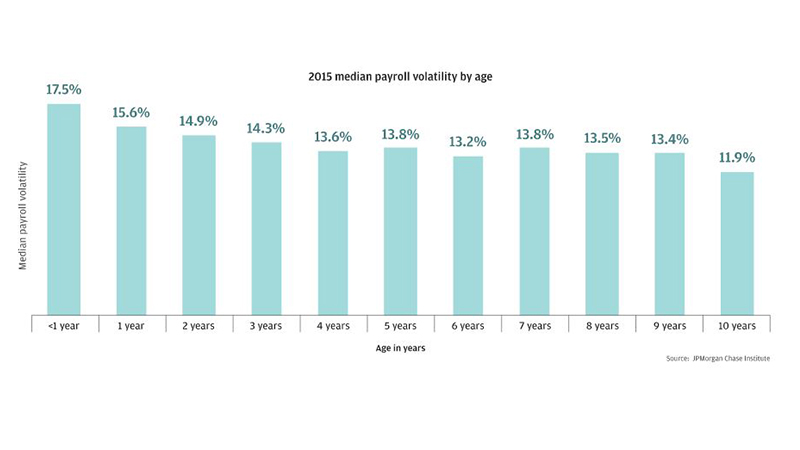
Moreover, these businesses also exhibit increased stability—stability that can play a significant role in sustaining small businesses, their owners, and their employees. In The Ups and Downs of Small Business Employment, we found that younger employer businesses experienced a greater degree of payroll volatility than older small employer businesses. Policymakers interested in the small business sector as a provider of sustainable employment for families might find significant traction with interventions targeted at supporting this large segment of small businesses.
Figure 6: Payroll Volatility Declined with Age in 2015
Notably, owners of businesses that survive the first few years may gain the expertise to understand and evaluate the policy choices and regulations targeted at smaller employers, though their small size may mean they do not have the scale to effectively engage the policy framework and/or institutions.
Finally, many policymakers have looked to the small business sector as a source of innovative rapid economic growth. While a two-year old employer construction business might need support getting access to short-term equipment finance facility, a two-year old employer biotech firm might benefit from programs that increase access to long-term capital investment to finance payroll until a biologic makes its way through FDA approval and becomes commercially viable.
Figure 7: Most Significant Growth Events come from Firms That Show Early Growth Behaviors
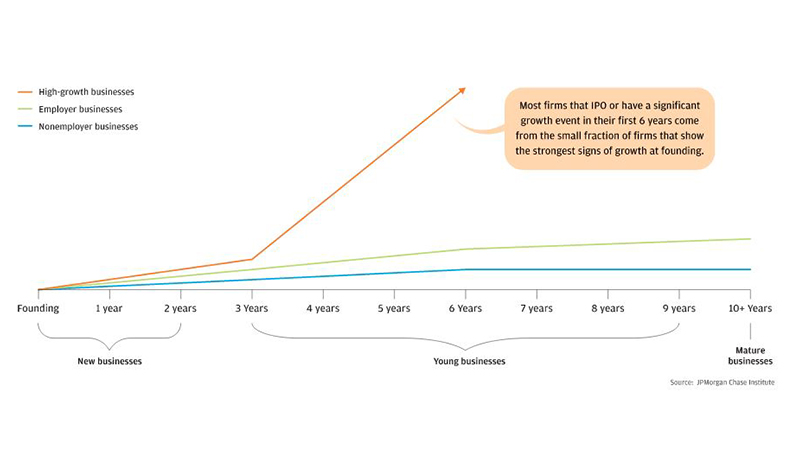
While rapid growth itself is a small business outcome rather than a characteristic of small businesses that could be targeted ex ante, recent research has begun to identify observable predictors of significant economic growth. As Figure 7 depicts, a very small number of small businesses make early strategic investments to support the potential for large-scale growth—growth in the economic value of the firm, in their numbers of employees, and in their impact on the U.S. economy. Their numbers are small, and may be decreasing over time. The number of initial public offerings has decreased notably in the past four decades (Gao et al. 2013), with several years of over 400 IPOs in the 1990s, down to 117 in 2015 (Ritter 2016). Even at a potentially diminished scale, these small numbers of firms stand to make an outsized impact on the U.S. economy. By some estimates, firms that manage to acquire venture financing account for 40% of U.S. publicly listed companies (Kerr et al. 2014).
Policymakers have shown great interest in finding ways to increase the number of the small businesses in strategic growth segments, due to the large economic each small firm that successfully grows can have. Still, there is likely room to improve the targeting of these policies by understanding some of the key distinctions among businesses that have the potential to significantly grow.
The significant potential impact of these high-growth firms notwithstanding, the overwhelming majority of small businesses will not grow to significant or strategic scale. While these small businesses will not grow to the point where they go public through an IPO, or get acquired by a larger firm, they nevertheless provide jobs for substantial numbers of people, provide goods and services that sustain local community, and create wealth and independence for many of their owners. Notably, we argue that effectively all mature small businesses are non-growth businesses, as growth-oriented small businesses either grow into larger businesses within 10 years or effectively identify themselves post-hoc as non-growth businesses. This implies that the small businesses that form the basis of local economies through their sustained presence are by definition non-growth businesses.
While statistics can paint a broad picture of the aggregate experiences of small businesses, the heterogeneous opportunities the sector offers may best be illustrated through the lens of individual firms. With that in mind, we conclude by grounding our broad findings in vignettes that characterize typical experiences of small businesses in each of our identified segments.
While this is not the first effort to identify small business segments that matter, we believe that the eight segments identified here showcase distinctions that are meaningful to people who own small businesses, the people they employ, and the policymakers who seek to understand and support these businesses.
Moreover, while we have chosen to focus on a small number of important dimensions of variation among small businesses, there are other important distinctions this segmentation does not draw attention to. Notably, characteristics of industries such as the position of a firm in a supply chain have important implications for their economic success. Along similar lines, many characteristics of small business owners (e.g. race, ethnicity, gender) have important implications for the equitable distribution of economic gains created through the small business sector. Other features of small businesses, (e.g. engagement in importing and activity, franchisee status, numbers of employees, size of revenues) are not covered by our proposed segmentation but are critically relevant to specific policy questions for some if not all small businesses. In addition, we offer a view that segments small businesses by their observable characteristics at a given point in time. A view that characterizes the dynamics of small businesses over time (e.g. firms currently without employees with intentions to hire in the near term) may provide additional insights relevant to some policy and decision-makers.
These potential limitations notwithstanding, we believe that a simple segmentation that focuses on a small number of dimensions is a useful contribution to the community of small business stakeholders engaged in making research-based policy and decisions, and can serve as a tool to better co-ordinate the data-collection and analysis by researchers with the questions raised by those who want to make policy and decisions based on research.
Farrell, Diana and Wheat, Christopher. 2017. “Small Business Segments for Research-Based Policymaking” JPMorgan Chase Institute.
Abowd, John M., Haltiwanger, John, and Lane, Julia. 2004. “Integrated Longitudinal Employer-Employee Data for the United States.” American Economic Review 94(2): 224-229. http://www.jstor.org/stable/3592887
Davis, Steven J., Haltiwanger, John, Jarmin, Ron S., Krizan, C. J. Miranda, Javier, Nucci, Alfred, and Sandusky, Kristin. 2007. “Measuring the Dynamics of Young and Small Businesses: Integrating the Employer and Nonemployer Universes.” NBER Working Paper No. 13226. http://www.nber.org/papers/w13226
Gao, Xiaohui, Ritter, Jay R., and Zhu, Zhongyan. 2013. “Where have all the IPOs gone?” Journal of Financial and Quantitative Analysis 48: 1663-1692. doi: 10.1017/S0022109014000015
Headd, Brian, and Saade, Radwan. 2008. “Do Business Definition Decisions Distort Small Business Research Results?” Available at SSRN: https://ssrn.com/abstract=1228536 . doi: 10.2139/ssrn.1228536
Kerr, William R., Nanda, Ramana, and Rhodes-Kropf, Matthew. 2014. “Entrepreneurship as Experimentation.” Journal of Economic Perspectives 28(3): 25-48. doi: 10.1257/jep.28.3.25
The ideas in this brief benefited strongly from our conversations with small business experts about the key dimensions of the small business sector. In particular, we would like to thank Zoltan Acs, Nipa Basu, Brian Bieron, Ron Borzekowski, Matt Camp, Kathleen Christensen, Aneesh Chopra, Bill Dunkelberg, Cathy Fazio, Tim Ferguson, Diana Furchtgott-Roth, Ben Gitis, Ingrid Gorman, Brian Headd, Grady Hedgespeth, Ron Jarmin, Karen Kerrigan, Joyce Klein, Andrew Kresse, Brayden McCarthy, Brad McConnell, Chad Moutray, Jonathan Ortmans, Harold Pettigrew, Bill Phelan, Tee Rowe, John Suh, Tom Sullivan, John Swanciger, Maxine Turner, Holly Wade, Eric Weaver, Ken Yancey, Ahu Yildirmaz, and Kim Zeuli for their thoughtful commentary.
Notably, this distinction is not fixed over time—in some cases nonemployers become employers. This transition is not particularly common. Hiring a first employee can be a substantial organizational lift for a nonemployer firm (Headd and Saade, 2008: 3), and only 3 percent of young nonemployers successfully make this transition (Davis et al. 2007: 3).
The 23 million nonemployer businesses reported by the Census Nonemployer Survey align closely but not precisely to people who report as self-employed with no employees in the Current Population Study.
These large robust data sets have done much to facilitate empirical research that can inform policy making about employer businesses.
Authors

Diana Farrell
Founding and Former President & CEO

Chris Wheat
President, JPMorganChase Institute