Findings

Small businesses, defined as businesses with fewer than 500 employees, play a critical role in the US economy. They provide work for nearly half of all employees in the US and are credited with creating 52 percent of net job growth. Small businesses also account for a significant share of personal income, given their average annual payroll of $45,000 per employee. Despite its importance, relatively little is known about the underlying dynamics of employment growth and volatility at the individual small business level. In particular, publicly available aggregate data provide an incomplete view of the ways in which employment in the sector shapes the financial well-being of small business owners and their employees.

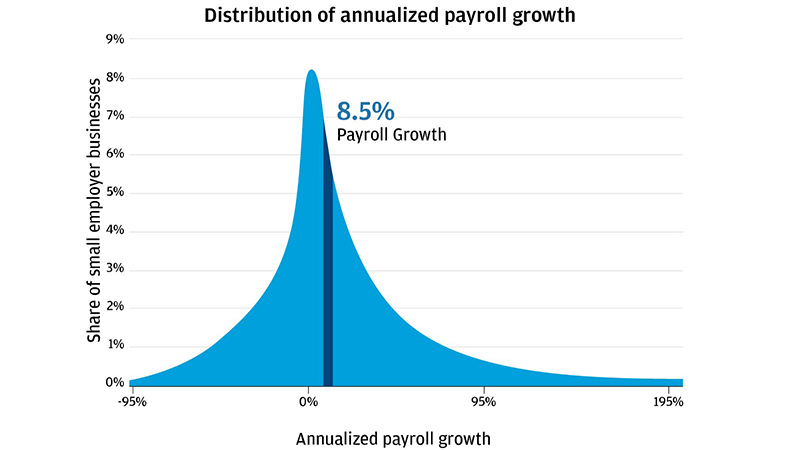
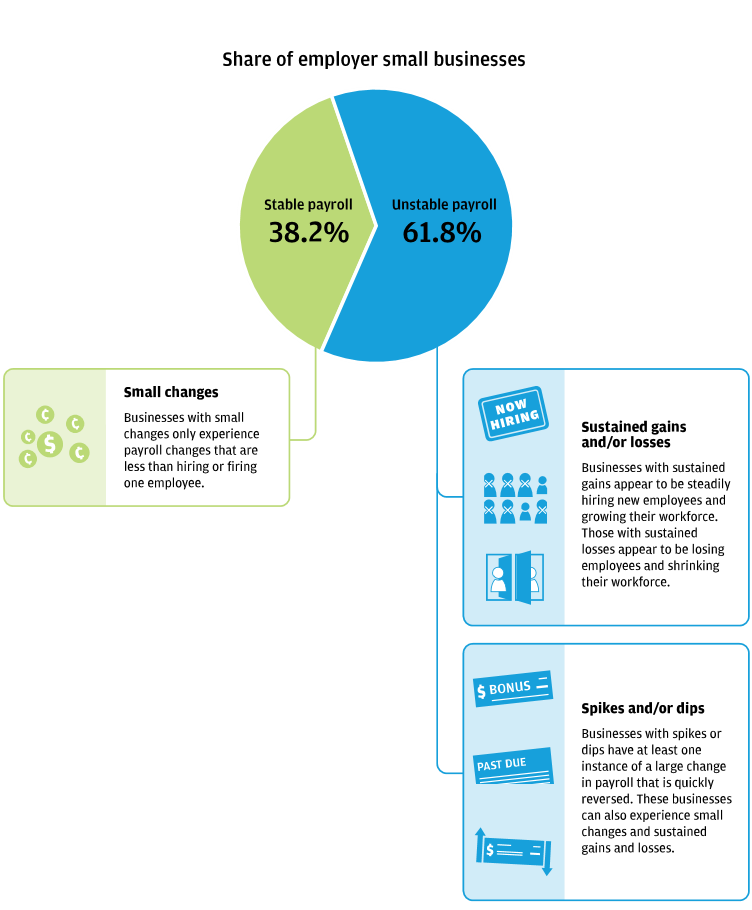
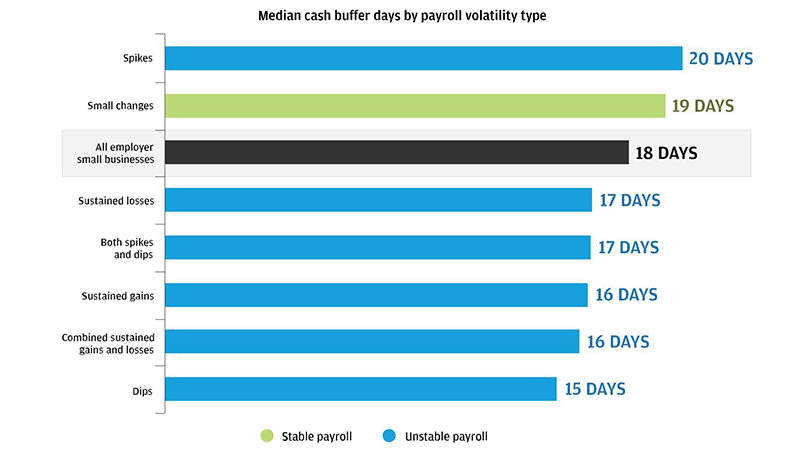
As part of its broader research agenda on the small business sector, the JPMorgan Chase Institute analyzed the size, growth, and volatility of payroll outflows for small businesses. Using a sample of over 45,000 small business customers, we found that payroll is a high expense for most employer small businesses. Furthermore, even though most small businesses experience low payroll growth each year, the month-to-month volatility of payroll expenses around that growth can be quite high, making it more difficult for small business owners to manage their cash flows.

01

Payroll for most small employer businesses grew by less than the equivalent of one full-time employee in a calendar year, with median annualized payroll growth of 8.5 percent.

Monthly payroll payments from the median small employer business in our sample grew at an annualized rate of 8.5 percent per year. This growth rate corresponded to the addition of less than one full-time equivalent (FTE). Moreover, 36.5 percent of these firms experienced declining payroll outflows, consistent with the loss of at least a partial FTE. In contrast, 31.8 percent of small businesses experienced growth in payroll outflows consistent with the addition of one or more FTEs.

Infographic describes about distribution annualized payroll growth

Monthly payroll payments from the median small employer business in our sample grew at an annualized rate of 8.5 percent per year. This growth rate corresponded to the addition of less than one full-time equivalent (FTE). Moreover, 36.5 percent of these firms experienced declining payroll outflows, consistent with the loss of at least a partial FTE. In contrast, 31.8 percent of small businesses experienced growth in payroll outflows consistent with the addition of one or more FTEs.

Bar garph describes about Monthly payroll payments from the median small employer business in our sample grew at an annualized rate of 8.5 percent per year

Source: JPMorgan Chase Institute

Finding One

Monthly payroll payments from the median small employer business in our sample grew at an annualized rate of 8.5 percent per year.

Gains and Losses in FTEs

Changes in FTEs Percent of small businesses
Lost more than 1 FTE 15.5%
Lost less than 1 FTE 21.0%
Gained less than 1 FTE 31.7%
Gained 1 to 2 FTEs 11.4%
Gained more than 2 FTEs 20.4%

Note: We calculated annual full-time equivalent (FTE) wages for a firm by dividing the total annual payroll for its 6-digit NAICS industry by the total number of employees in that industry. We identify FTE changes by comparing annualized payroll growth to this annual FTE wage measure. Annual payroll and employee data are from the U.S. Census Statistics of U.S. Businesses.

01

Payroll expenses were a material outflow for employer small businesses, which held fewer cash buffer days than nonemployer small businesses.

The typical employer small business had payroll outflows of $18,700, or 18 percent of all outflows.

Infographic describes about Employer small business payroll share of outflows

Employer small business payroll share of outflows 18% ($18,700)

Large payroll outflows can pose significant challenges to small businesses with limited liquidity. We found that across employers and nonemployers, the typical small business only carried 27 cash buffer days. Moreover, the typical employer small business had only 18 cash buffer days, significantly fewer than 27. The size and volatility of payroll expenses may put substantial stress on the relatively limited cash reserves of these employer small businesses.

Cash buffer days are the number of days of cash outflows a business could pay out of its cash balance if its inflows were to stop. We estimate cash buffer days for a business by computing the ratio of its average daily cash balances to its average daily cash outflows.

Bar garph describes about Distribution of Cash Buffer Days by Type of Small Business

Source: JPMorgan Chase Institute

Finding Two

Distribution of Cash Buffer Days by Type of Small Business

Percentile Cash buffer days for employer small businesses Cash buffer days for all small businesses
25th percentile 9 days 13 days
Median 18 days 27 days
75th percentile 35 days 62 days
01

Most small employer businesses experienced unstable payroll and employment volatility including job gains and losses and other spikes and dips in payroll.

61.8% of small employer businesses experienced unstable sustained gains and/or losses, spikes, dips, or spikes and dips.

Infographic describes about Share of employer small businesses

Finding Three

Share of employer small businesses

Stable payroll

38.2%

Unstable payroll

61.8%

Employer small businesses with stable payroll experience:

  • Small changes: Businesses with small changes only experience payroll changes that are less than hiring or firing one employee.

Employer small businesses with unstable payroll experience:

  • Sustained gains and/or losses: Businesses with sustained gains appear to be steadily hiring new employees and growing their workforce. Those with sustained losses appear to be losing employees and shrinking their workforce.
  • Spikes and/or dips: Businesses with spikes or dips have at least one instance of a large change in payroll that is quickly reversed. These businesses can also experience small changes and sustained gains and losses.
01

The typical small employer business experienced substantial volatility in payroll outflows, and volatility was highest for younger small employer businesses.

low volatility
Infographic describes about Low Volatility: 25 percent of small businesses experience payroll changes no more volatile than the small changes pattern

Low Volatility: 25 percent of small businesses experience payroll changes no more volatile than the small changes pattern.

Illustrative small changes pattern
Month Number of FTEs
Feb 4
Mar 3.85
Apr 4.2
May 4.6
Jun 4.3
Jul 4.6
Aug 4.8
Sept 5.1
Oct 4.7
Typical volatility
Infographic describes about Typical Volatility: Most small businesses experienced payroll changes similar to the gains and losses pattern

Typical Volatility: Most small businesses experienced payroll changes similar to the gains and losses pattern.

Illustrative gains and losses pattern
Month Number of FTEs
Feb 4
Mar 4.4
Apr 4.8
May 3.75
Jun 3.9
Jul 4
Aug 5.05
Sept 4.9
Oct 4.7
High volatility
Infographic describes about High Volatility: 25 percent of small businesses experienced payroll changes at least as volatile as the spikes and dips pattern

High Volatility: 25 percent of small businesses experienced payroll changes at least as volatile as the spikes and dips pattern.

Illustrative spikes and dips pattern
Month Number of FTEs
Feb 4
Mar 3.6
Apr 4.05
May 5.8
Jun 4.3
Jul 4.25
Aug 3.2
Sept 5
Oct 4.7
01

Small employer businesses with more volatile payroll patterns tended to have fewer cash buffer days.

The median small employer business with dips, combined sustained gains and losses, and sustained gains had the fewest cash buffer days

  • Small employer businesses with spikes were one exception to this rule, which may reflect businesses that pay bonuses or commissions with growing revenues
     
Bar garph describes about Median cash buffer days by payroll volatility type

Source: JPMorgan Chase Institute

Finding Five

Median cash buffer days by payroll volatility type

Payroll pattern Median Cash Buffer Days
Spikes (unstable payroll) 20
Small changes (stable payroll) 19
All employer small businesses 18
Sustained losses (unstable payroll) 17
Both spikes and dips (unstable payroll) 17
Sustained gains (unstable payroll) 16
Combined sustained gains and losses (unstable payroll) 16
Dips (unstable payroll) 15


Data

We created a sample of 45,260 small businesses who hold Chase Business Banking deposit accounts and meet our criteria for small, core metropolitan employer businesses. We then used their combined 65 million transactions to produce a view of daily cash inflows, payroll and other cash outflows, and end-of-day balances over the nine non-holiday months from February 2015 to October 2015.

Infographic describes about select a sample of small businesses with the following characteristics

Data

Small Businesses

We select a sample of small businesses with the following characteristics:

  • Hold Chase Business Banking accounts
  • End-of-day combined balances do not exceed $20 million each day
  • Do not identify with more than a single address and/or a single industry
Infographic describes about Core Metropolitan Employer Businesses

Core Metropolitan Employer Businesses

We define core businesses as those businesses that have financial activity that indicates they are not seasonal businesses, hobby businesses, small office/home office businesses (SOHOs), micro businesses, etc.

  • For at least five of nine months, at least $500 in outflows and 10 transactions
  • At least one inflow and outflow in each month
  • At least one and fewer than 500 employees in each payroll period
  • Are located in Metropolitan areas where Chase has a representative footprint
Infographic describes about The businesses we study are part of 12 selected key industries that comprise key elements of the small business sector

Source: JPMorgan Chase Institute

Selected Key Industries

The businesses we study are part of 12 selected key industries that comprise key elements of the small business sector:

  • Construction
  • Health Care Services
  • High-Tech Manufacturing
  • High-Tech Services
  • Metal & Machinery
  • Other Professional Services
  • Personal Services
  • Real Estate
  • Repair & Maintenance
  • Restaurants
  • Retail
  • Wholesalers

Together, these 12 industries capture 73 percent of for-profit employer small firms and 65 percent of for-profit small business employment.

Conclusion

The findings in this report are relevant for policy makers, advocates, and private-sector partners alike. These findings suggest that those who seek to help small businesses should focus not only on new business creation but specifically on minimizing payroll volatility, which can benefit both small business owners and employees. Moreover, they shed light on trade-offs inherent in policies that improve wages of small business employees but impose costs on small business owners.

Authors

Diana Farrell

Diana Farrell

Founding and Former President & CEO

Chris Wheat

Chris Wheat

President, JPMorganChase Institute