14% Return on Tangible Common Equity
Supported Consumers, Businesses and Communities
- The Firm had strong underlying performance, notwithstanding industry-wide headwinds in Markets and Mortgage
- Consumer & Community Banking: average Consumer & Business Banking deposits up 9%; credit card sales volume up 12%; record client investment assets up 19%; record Business Banking loan originations up 46%
- Corporate & Investment Bank: maintained #1 ranking for Global Investment Banking fees with 8.2% wallet share YTD; assets under custody up 14%
- Commercial Banking: period-end loan balances up 9%, driven by 14% growth in Commercial Real Estate; gross investment banking revenue with Commercial Banking clients up 25%
- Asset Management: twenty-first consecutive quarter of positive net long-term client flows; record client assets up 15%; record loan balances up 17%
- Second-quarter results included as a significant item $500 million after-tax Firmwide legal expense ($0.13 per share after-tax decrease in earnings; $669 million pretax expense)
- Approximately $3 billion returned to shareholders in 2Q14
- Repurchased $1.5 billion of common equity
- Increased common stock dividend to $0.40 per share
- Fortress balance sheet maintained
- Common Equity Tier , of $161 billion, or ratio of 9.8%
- Strong liquidity - compliant with LCR - HQLA of $576 billion
- Firm Supplementary Leverage Ratio ("SLR"), of 5.4%
- Core loans up 8% compared with the prior year
- JPMorgan Chase supported consumers, businesses and our communities
- $1.0 trillion of credit and capital raised for the first six months of 2014
- $93 billion of credit for consumers
- $10 billion of credit for U.S. small businesses
- $296 billion of credit for corporations
- $611 billion of capital raised for clients
- $33 billion of credit and capital raised for nonprofit and government entities, including states, municipalities, hospitals and universities
- Hired over 7,200 U.S. veterans and service members since 2011
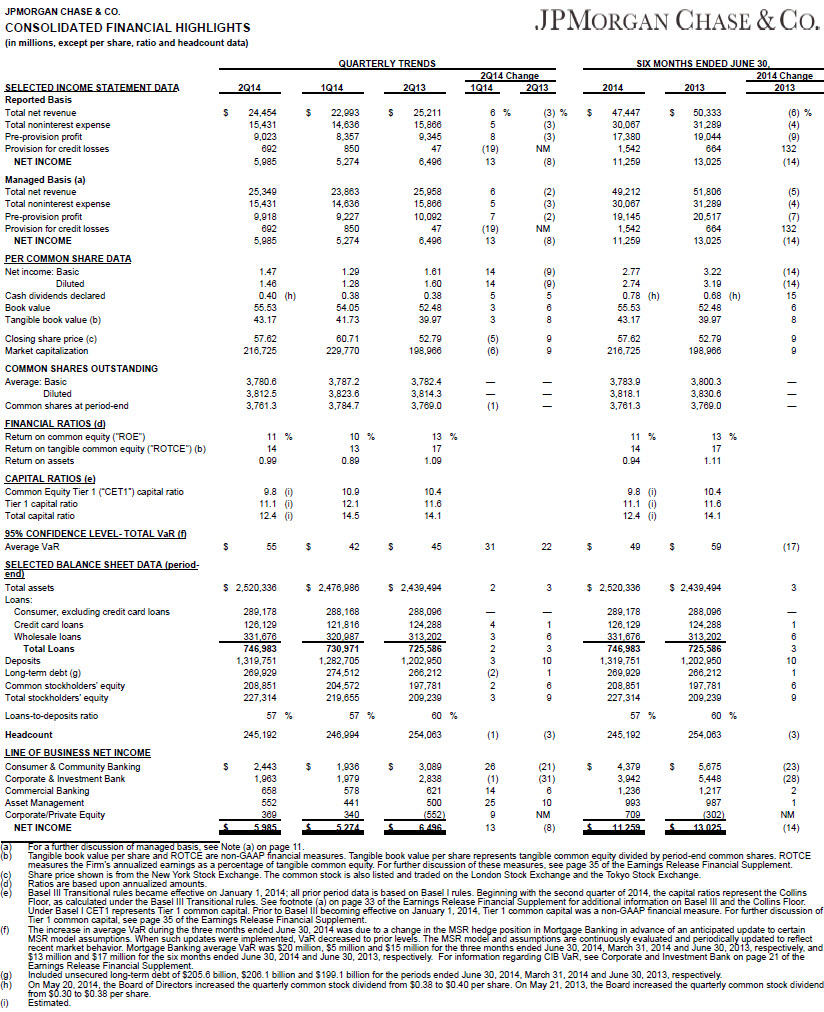
JPMorgan Chase & Co. (NYSE: JPM) today reported net income for the second quarter of 2014 of $6.0 billion, compared with net income of $6.5 billion in the second quarter of 2013. Earnings per share were $1.46, compared with $1.60 in the second quarter of 2013. Revenue for the quarter was $25.3 billion, down 2% compared with the prior year. The Firm's return on tangible common equity for the second quarter of 2014 was 14%, compared with 17% in the prior year. Core loans increased by 8% compared with the prior year. The Firm repurchased $1.5 billion of common equity in the second quarter.
Jamie Dimon, Chairman and Chief Executive Officer, commented on the financial results: "Despite continued industry-wide headwinds in Markets and Mortgage, the firm has continued to deliver strong underlying performance. Consumer & Community Banking deposit growth and card sales volume both outpaced the industry, and we had record loan originations in Business Banking. The Corporate & Investment Bank saw strong performance in fees with #1 position in Global IB fees YTD, global debt and equity, global syndicated loans and global long-term debt. Commercial Banking clients generated record investment banking revenues in the first half of the year. Asset Management had excellent performance across all measures."
Dimon continued: "Toward the end of the second quarter, we saw encouraging signs across our businesses including an uptick in wholesale utilization, strengthening pipelines in our commercial and business banking segments, and some improvements in markets activity. While it is too early to assume that this momentum will continue, we have confidence in the long-term growth of the economy.
"Consumers, middle market companies and corporations are in increasingly good financial shape and the labor market is showing steady improvement. JPMorgan Chase provided credit and raised capital of over $1.0 trillion for our clients during the first half of 2014, which included $10 billion for U.S. small businesses."
Dimon concluded: "This quarter marked the 10-year anniversary of JPMorgan Chase and Bank One coming together - the company overcame significant challenges and achieved extraordinary things during this time. Each of our businesses is among the best in the world, with increased market share, strong earnings performance and power, and an unwavering focus on serving our clients, communities and shareholders with distinction and dedication. We continue our progress on adapting to the new global financial architecture and on our control agenda. My pride in the company is greater than ever."
In the discussion below of the business segments and of JPMorgan Chase as a Firm, information is presented on a managed basis. For more information about managed basis, as well as other non-GAAP financial measures used by management to evaluate the performance of each line of business, see page 12. The following discussion compares the second quarters of 2014 and 2013 unless otherwise noted. Footnotes in the sections that follow are described on page 13.
CONSUMER & COMMUNITY BANKING (CCB)
| Results for CCB ($ millions) | 2Q14 | 1Q14 | 2Q13 | 1Q14 | 2Q13 |
|---|
| $ O/(U) | O/(U) % | $ O/(U) | O/(U) % |
|---|
| Net Revenue | $ 11,431 | $ 10,460 | $ 12,015 | $ 971 | 9% | $ (584) | (5)% |
| Provision for Credit Losses | 852 | 816 | (19) | 36 | 4 | 871 | NM |
| Noninterest Expenses | 6,456 | 6,437 | 6,864 | 19 | - | (408) | (6) |
| Net Income | $ 2,443 | $ 1,936 | $ 3,089 | $ 507 | 26% | $ (646) | (21)% |
Discussion of Results:
Net income was $2.4 billion, a decrease of $646 million, or 21%, compared with the prior year, due to higher provision for credit losses and lower net revenue, partially offset by lower noninterest expense.
Net revenue was $11.4 billion, a decrease of $584 million, or 5%, compared with the prior year. Net interest income was $7.0 billion, down $131 million, or 2%, driven by spread compression and lower mortgage warehouse balances, largely offset by higher deposit balances. Noninterest revenue was $4.5 billion, a decrease of $453 million, or 9%, driven by lower mortgage fees and related income.
The provision for credit losses was $852 million, compared with a benefit of $19 million in the prior year and a provision for credit losses of $816 million in the prior quarter. The current-quarter provision reflected a $357 million reduction in the allowance for loan losses and total net charge-offs of $1.2 billion. The prior-quarter provision reflected a $450 million reduction in the allowance for loan losses and total net charge-offs of $1.3 billion. The prior-year provision reflected a $1.5 billion reduction in the allowance for loan losses and total net charge-offs of $1.5 billion.
Noninterest expense was $6.5 billion, a decrease of $408 million, or 6%, from the prior year, driven by lower Mortgage Banking expense, partially offset by higher Credit Card expense.
Key Metrics and Business Updates:
(All comparisons refer to the prior-year quarter except as noted; banking portal ranking is per compete.com, as of May 2014)
- Return on equity was 19% on $51.0 billion of average allocated capital.
- Average total deposits were $486.1 billion, up 7% from the prior year and 3% from the prior quarter.
- Record client investment assets were $205.2 billion, up 19% from the prior year and 5% from the prior quarter.
- Record Business Banking originations were $1.9 billion, up 46% from the prior year and 27% from the prior quarter. Average Business Banking loans were $19.2 billion, up 3% from the prior year and 1% from the prior quarter.
- Over $600 billion, or approximately 16% of total U.S. credit and debit purchase volume.
- Credit card sales volume was $118.0 billion, up 12% from the prior year. General purpose credit card sales volume growth has outperformed the industry for 25 consecutive quarters.
- Merchant processing volume was $209.0 billion, up 13% from the prior year. Total transactions processed were 9.3 billion, up 6% from the prior year.
- Auto originations were $7.1 billion, up 4% from the prior year and 6% from the prior quarter.
- Mortgage originations were $16.8 billion, down 66% from the prior year and 1% from the prior quarter.
- Active mobile customers were up 23% over the prior year to 17.2 million, and Chase.com remains the #1 most visited banking portal in the U.S.
- Only 5-star rated iPhone mobile application among the largest U.S. banks.
Consumer & Business Banking net income was $894 million, an increase of $196 million, or 28%, compared with the prior year, predominantly due to higher net revenue.
Net revenue was $4.6 billion, up 7% compared with the prior year. Net interest income was $2.8 billion, up 6% compared with the prior year, driven by higher deposit balances, partially offset by deposit spread compression. Noninterest revenue was $1.8 billion, an increase of 9%, driven by higher investment revenue, reflecting record client investment assets, higher deposit-related fees and debit card revenue.
The provision for credit losses was $66 million, compared with $74 million in the prior year.
Noninterest expense was $3.0 billion, approximately flat from the prior year, driven by investments in controls, partially offset by efficiency gains in the branches.
Key Metrics and Business Updates:
(All comparisons refer to the prior-year quarter except as noted)
- Return on equity was 33% on $11.0 billion of average allocated capital.
- Ranked #1 in customer satisfaction among the largest U.S. banks for the second year in a row, according to J.D. Power and American Customer Satisfaction Index ("ACSI").
- Winner of a record five TNS Choice Awards in 2014.
- Ranked #1 in small business banking customer satisfaction in three of the four regions (West, Midwest and South) by J.D. Power.
- Average total deposits were $471.6 billion, up 9% from the prior year and 3% from the prior quarter. Deposit growth is among the highest in the industry.
- Deposit margin was 2.23%, compared with 2.31% in the prior year and 2.27% in the prior quarter.
- Households totaled 25.5 million, up 3% from the prior year and 1% from the prior quarter, reflecting strong customer retention.
Mortgage Banking net income was $709 million, a decrease of $433 million from the prior year, driven by lower net revenue and a lower benefit from the provision for credit losses, partially offset by lower noninterest expense.
Net revenue was $2.3 billion, a decrease of $772 million compared with the prior year. Net interest income was $1.0 billion, a decrease of $125 million, or 11%, driven by lower warehouse balances as well as lower loan balances due to portfolio runoff. Noninterest revenue was $1.3 billion, a decrease of $647 million, driven by lower mortgage fees and related income.
The provision for credit losses was a benefit of $188 million, compared with a benefit of $657 million in the prior year. The current quarter reflected a $300 million reduction in the purchased credit-impaired allowance for loan losses, reflecting continued improvement in home prices and delinquencies. The prior year included a $950 million reduction in the non credit-impaired allowance for loan losses. Net charge-offs were $112 million, compared with $293 million in the prior year.
Noninterest expense was $1.3 billion, a decrease of $528 million, or 29%, from the prior year, due to lower expense in production and servicing.
Mortgage Production pretax income was $63 million, a decrease of $519 million from the prior year, reflecting lower revenue, partially offset by lower expense and lower repurchase losses. Mortgage production-related revenue, excluding repurchase losses, was $339 million, a decrease of $947 million from the prior year, primarily on lower volumes. Production expense was $413 million, a decrease of $307 million from the prior year, predominantly due to lower headcount-related expense. Repurchase losses for the current quarter reflected a benefit of $137 million, compared with a benefit of $16 million in the prior year.
Mortgage Servicing pretax income was $479 million, compared with $133 million in the prior year, reflecting higher MSR risk management income and lower expenses, partially offset by lower revenue. Mortgage net servicing-related revenue was $693 million, a decrease of $77 million from the prior year. MSR risk management income was $338 million, driven by approximately $220 million of positive model assumption updates also on slower prepayments, compared with $78 million in the prior year; and a loss of $401 million in the prior quarter, which included a negative $460 million fair value adjustment primarily related to higher capital allocated to the business. Servicing expense was $552 million, a decrease of $163 million from the prior year, reflecting lower headcount-related expense.
Key Metrics and Business Updates:
(All comparisons refer to the prior-year quarter except as noted)
- Mortgage application volumes were $30.1 billion, down 54% from the prior year and up 15% from the prior quarter.
- Period-end total third-party mortgage loans serviced were $786.2 billion, down 6% from the prior year and 2% from the prior quarter.
Real Estate Portfolios pretax income was $626 million, down $540 million from the prior year, due to a lower benefit from the provision for credit losses and lower net revenue, partially offset by lower expense.
Net revenue was $779 million, a decrease of $129 million, or 14%, from the prior year. This decrease was largely due to lower net interest income resulting from lower loan balances due to portfolio runoff.
The provision for credit losses was a benefit of $189 million, compared with a benefit of $662 million in the prior year. The current-quarter provision reflected a $300 million reduction in the purchased credit-impaired allowance for loan losses, reflecting continued improvement in home prices and delinquencies. The prior-year provision included a $950 million reduction in the non credit-impaired allowance for loan losses. Net charge-offs were $111 million, compared with $288 million in the prior year. Home equity net charge-offs were $125 million (0.91% net charge-off rate), compared with $236 million (1.49% net charge-off rate) in the prior year. Subprime mortgage net recoveries were $5 million (0.30% net recovery rate), compared with net charge-offs of $33 million (1.69% net charge-off rate). Net recoveries of prime mortgage, including option ARMs, were $12 million (0.09% net recovery rate), compared with net charge-offs of $16 million (0.15% net charge-off rate).
Noninterest expense was $342 million, a decrease of $62 million, or 15%, compared with the prior year, driven by lower foreclosed asset expense.
Key Metrics and Business Updates:
(All comparisons refer to the prior-year quarter except as noted. Average loans include PCI loans)
- Mortgage Banking return on equity was 16% on $18.0 billion of average allocated capital.
- Average home equity loans were $73.6 billion, down $10.2 billion.
- Average mortgage loans were $92.4 billion, up $4.3 billion.
- Allowance for loan losses was $6.1 billion, compared with $9.0 billion.
- Allowance for loan losses to ending loans retained, excluding PCI loans, was 2.04%, compared with 2.85%.
Card, Merchant Services & Auto net income was $840 million, a decrease of $409 million, or 33%, compared with the prior year, driven by higher provision for credit losses, higher noninterest expense and lower net revenue.
Net revenue was $4.6 billion, down $117 million, or 3%, compared with the prior year. Net interest income was $3.2 billion, down $162 million compared with the prior year, driven by spread compression. Noninterest revenue was $1.4 billion, up $45 million compared with the prior year, driven by higher net interchange income, largely offset by higher amortization of new account origination costs.
The provision for credit losses was $974 million, compared with $564 million in the prior year and $763 million in the prior quarter. The current-quarter provision reflected lower net charge-offs and a $53 million reduction in the allowance for loan losses, primarily in Student. The prior-year provision included a $550 million reduction in the allowance for loan losses. The Credit Card net charge-off rate was 2.88%, down from 3.31% in the prior year and 2.93% in the prior quarter; the 30+ day delinquency rate was 1.41%, down from 1.69% in the prior year and 1.61% in the prior quarter. The Auto net charge-off rate was 0.22%, up from 0.18% in the prior year and down from 0.32% in the prior quarter.
Noninterest expense was $2.1 billion, up $136 million, or 7%, from the prior year, largely driven by investments in controls, timing of marketing investment in Credit Card and higher legal expense.
Key Metrics and Business Updates:
(All comparisons refer to the prior-year quarter except as noted)
- Return on equity was 18% on $19.0 billion of average allocated capital.
- #1 credit card issuer in the U.S. based on loans outstandings; #1 global Visa issuer based on consumer and business credit card sales volume.
- Period-end Credit Card loan balances were $126.1 billion, up 1% from the prior year and 4% from the prior quarter. Credit Card average loans were $123.7 billion, up 1% from the prior year and flat compared with the prior quarter.
- Card Services net revenue as a percentage of average loans was 12.15%, compared with 12.59% in the prior year and 12.22% in the prior quarter.
- Average auto loans were $52.8 billion, up 4% from the prior year and flat compared with the prior quarter.
- Approximately 50% share of eCommerce volume for the top 500 internet merchants .
CORPORATE & INVESTMENT BANK (CIB)
| Results for CIB ($ millions) | 2Q14 | 1Q14 | 2Q13 | 1Q14 | 2Q13 |
|---|
| $ O/(U) | O/(U) % | $ O/(U) | O/(U) % |
|---|
| Net Revenue | $ 8,991 | $ 8,606 | $ 9,876 | $ 385 | 4% | $ (885) | (9)% |
| Provision for Credit Losses | (84) | 49 | (6) | (133) | NM | (78) | NM |
| Noninterest Expenses | 6,058 | 5,604 | 5,742 | 454 | 8 | 316 | 6 |
| Net Income | $ 1,963 | $ 1,979 | $ 2,838 | $ (16) | 1% | $ (875) | (31)% |
Discussion of Results:
Net income was $2.0 billion, down 31% compared with $2.8 billion in the prior year. These results primarily reflected lower revenue, as well as higher noninterest expense. Net revenue was $9.0 billion compared with $9.9 billion in the prior year. Excluding the impact of a DVA gain of $355 million in the prior year, net revenue was down 6% from $9.5 billion, and net income was down 25% from $2.6 billion.
Banking revenue was $3.1 billion, down 2% from the prior year. Investment banking fees were $1.8 billion, up 3% from the prior year. The increase was driven by higher advisory fees of $397 million, up 31% from the prior year on strong wallet share of completed transactions, as well as higher equity underwriting fees of $477 million, up 4% from the prior year. These were partially offset by lower debt underwriting fees of $899 million, down 6% from a strong prior year. Treasury Services revenue was $1.0 billion, down 4% compared with the prior year driven by lower trade finance revenue as well as the impact of business simplification initiatives. Lending revenue was $297 million, down from $373 million in the prior year primarily due to lower net interest income.
Markets & Investor Services revenue was $5.9 billion, down 12% from the prior year. Fixed Income Markets revenue of $3.5 billion was down 15% from the prior year on historically low levels of volatility and lower client activity across products. Equity Markets revenue of $1.2 billion was down 10% compared with the prior year, primarily on lower derivatives revenue. Securities Services revenue was $1.1 billion, up 5% from the prior year primarily driven by higher net interest income on increased deposits. Credit Adjustments & Other revenue was a gain of $125 million driven by gains, net of hedges, related to funding valuation adjustments/DVA, compared with a gain of $274 million in the prior year which was primarily driven by DVA.
The provision for credit losses was a benefit of $84 million, compared with a benefit of $6 million in the prior year. The ratio of the allowance for loan losses to period-end loans retained was 1.11%, compared with 1.21% in the prior year. Excluding the impact of the consolidation of Firm-administered multi-seller conduits and trade finance loans, the ratio of the allowance for loan losses to period-end loans retained was 1.80%, compared with 2.35% in the prior year.
Noninterest expense was $6.1 billion, up 6% from the prior year, driven by higher non compensation expense, partially offset by lower performance-based compensation. The current quarter noninterest expense included approximately $300 million of legal expense and approximately $300 million of costs related to business simplification. The ratio of compensation expense to total net revenue was 31%.
Key Metrics and Business Updates:
(All comparisons refer to the prior-year quarter except as noted, and all rankings are according to Dealogic)
- Return on equity was 13% on $61.0 billion of average allocated capital.
- Overhead ratio was 67%.
- Ranked #1 in Global Investment Banking Fees with 8.2% wallet share for the six months ended June 30, 2014.
- Ranked #1 in Global Debt, Equity and Equity-related with 7.4% wallet share; #1 in Global Long-Term Debt with 8.0% wallet share; #1 in Global Syndicated Loans with 9.6% wallet share; #3 in Global Equity and Equity-related with 6.9% wallet share; and #2 in Global Announced M&A, with 8.8% wallet share, based on revenue, for the six months ended June 30, 2014.
- Average client deposits and other third-party liabilities were $403.3 billion, up 9% from the prior year and down 2% from prior quarter.
- Assets under custody were a record $21.7 trillion, up 14% from the prior year and 2% from the prior quarter.
- International revenue represented 53% of total revenue.
- Period-end total loans were $108.8 billion, down 2% from the prior year and up 4% from the prior quarter. Nonaccrual loans were $278 million, down 47% from the prior year and up 11% from the prior quarter.
COMMERCIAL BANKING (CB)
| Results for CB ($ millions) | 2Q14 | 1Q14 | 2Q13 | 1Q14 | 2Q13 |
|---|
| $ O/(U) | O/(U) % | $ O/(U) | O/(U) % |
|---|
| Net Revenue | $ 1,701 | $ 1,651 | $ 1,728 | $ 50 | 3% | $ (27) | (2)% |
| Provision for Credit Losses | (67) | 5 | 44 | (72) | NM | (111) | NM |
| Noninterest Expenses | 675 | 686 | 652 | (11) | (2) | 23 | 4 |
| Net Income | $ 658 | $ 578 | $ 621 | $ 80 | 14% | $ 37 | 6% |
Discussion of Results:
Net income was $658 million, an increase of $37 million, or 6%, compared with the prior year, reflecting a lower provision for credit losses, partially offset by higher noninterest expense and lower net revenue.
Net revenue was $1.7 billion, a decrease of $27 million, or 2%, compared with the prior year. Net interest income was $1.1 billion, a decrease of $53 million, or 5%, compared with the prior year, reflecting spread compression and lower purchase discounts recognized on loan repayments, partially offset by higher loan balances. Noninterest revenue was $577 million, an increase of $26 million, or 5%, compared with the prior year, driven by higher investment banking revenue.
Revenue from Middle Market Banking was $709 million, a decrease of $68 million, or 9%, compared with the prior year. Revenue from Corporate Client Banking was $477 million, an increase of $33 million, or 7%, compared with the prior year. Revenue from Commercial Term Lending was $307 million, a decrease of $8 million, or 3%, compared with the prior year. Revenue from Real Estate Banking was $129 million, an increase of $16 million, or 14%, compared with the prior year.
The provision for credit losses was a benefit of $67 million, compared with expense of $44 million in the prior year. Net recoveries were $26 million (0.07% net recovery rate), compared with net charge-offs of $9 million (0.03% net charge-off rate) in the prior year and net recoveries of $14 million (0.04% net recovery rate) in the prior quarter. The allowance for loan losses to period-end loans retained was 1.87%, down from 2.06% in the prior year and down from 1.95% in the prior quarter. Nonaccrual loans were $446 million, down $67 million, or 13%, from the prior year, and down by $39 million, or 8%, from the prior quarter.
Noninterest expense was $675 million, up 4% compared with the prior year, largely reflecting higher investment in controls.
Key Metrics and Business Updates:
(All comparisons refer to the prior-year quarter except as noted)
- Return on equity was 19% on $14.0 billion of average allocated capital.
- Overhead ratio was 40%, compared with 38% in the prior year.
- Gross investment banking revenue (which is shared with the Corporate & Investment Bank) was $481 million, up 25% compared with the prior year and up 8% compared with the prior quarter.
- Average loan balances were $140.8 billion, up 7% compared with the prior year and 2% compared with the prior quarter.
- Period-end loan balances were $142.3 billion, up 9% compared with the prior year and 2% compared with the prior quarter.
- Average client deposits and other third-party liabilities were $200.0 billion, up 2% compared with the prior year and down 1% compared with the prior quarter.
ASSET MANAGEMENT (AM)
| Results for AM ($ millions) | 2Q14 | 1Q14 | 2Q13 | 1Q14 | 2Q13 |
|---|
| $ O/(U) | O/(U) % | $ O/(U) | O/(U) % |
|---|
| Net Revenue | $ 2,956 | $ 2,778 | $ 2,725 | $ 178 | 6% | $ 231 | 8% |
| Provision for Credit Losses | 1 | (9) | 23 | 10 | NM | (22) | (96) |
| Noninterest Expenses | 2,062 | 2,075 | 1,892 | (13) | (1) | 170 | 9 |
| Net Income | $ 552 | $ 441 | $ 500 | $ 111 | 25% | $ 52 | 10% |
Discussion of Results:
Net income was $552 million, an increase of $52 million, or 10%, from the prior year, reflecting higher net revenue, largely offset by higher noninterest expense.
Net revenue was $3.0 billion, an increase of $231 million, or 8%, from the prior year. Noninterest revenue was $2.4 billion, up $224 million, or 10%, from the prior year, due to net client inflows and the effect of higher market levels. Net interest income was $576 million, up $7 million, or 1%, from the prior year, due to higher loan and deposit balances, largely offset by spread compression.
Revenue from Private Banking was $1.6 billion, up 5% compared with the prior year. Revenue from Institutional was $571 million, up 1%. Revenue from Retail was $829 million, up 22%.
Client assets were $2.5 trillion, an increase of $316 billion, or 15%, compared with the prior year. Assets under management were $1.7 trillion, an increase of $237 billion, or 16%, from the prior year, due to the effect of higher market levels and net inflows to long-term products. Custody, brokerage, administration and deposit balances were $766 billion, up $79 billion, or 11%, from the prior year, due to the effect of higher market levels and custody inflows, partially offset by brokerage outflows.
The provision for credit losses was $1 million, compared with $23 million in the prior year.
Noninterest expense was $2.1 billion, an increase of $170 million, or 9%, from the prior year, primarily due to continued investment in controls and growth.
Key Metrics and Business Updates:
(All comparisons refer to the prior-year quarter except as noted)
- Return on equity was 25% on $9.0 billion of average allocated capital.
- Pretax margin was 30%, flat to the prior year.
- For the 12 months ended June 30, 2014, assets under management reflected net inflows of $92 billion, driven by net inflows of $89 billion to long-term products and $3 billion to liquidity products. For the quarter, net inflows were $23 billion, driven by net inflows of $34 billion to long-term products and net outflows of $11 billion from liquidity products.
- Net long-term client flows were positive for the twenty-first consecutive quarter.
- Assets under management ranked in the top two quartiles for investment performance were 69% over 5 years, 67% over 3 years and 48% over 1 year.
- Customer assets in 4 and 5 Star-rated funds were 51% of all rated mutual fund assets.
- Client assets were $2.5 trillion, a record, up 15% from the prior year and 3% from the prior quarter.
- Average loans were $98.7 billion, a record, up 18% from the prior year and 3% from the prior quarter.
- Period-end loans were $100.9 billion, a record, up 17% from the prior year and 4% from the prior quarter.
- Average deposits were $147.7 billion, up 8% from the prior year and down 1% from the prior quarter.
- Period-end deposits were $145.7 billion, up 6% from the prior year and down 1% from the prior quarter.
CORPORATE/PRIVATE EQUITY
| Results for Corporate/Private Equity ($ millions) | 2Q14 | 1Q14 | 2Q13 | 1Q14 | 2Q13 |
|---|
| $ O/(U) | O/(U) % | $ O/(U) | O/(U) % |
|---|
| Net Revenue | $ 270 | $ 368 | $ (386) | $ (98) | (27)% | $ 656 | NM |
| Provision for Credit Losses | (10) | (11) | 5 | 1 | 9 | (15) | NM |
| Noninterest Expenses | 180 | (166) | 716 | 346 | NM | (536) | (75) |
| Net Income | $ 369 | $ 340 | $ (552) | $ 29 | 9% | $ 921 | NM |
Discussion of Results:
Net income was $369 million, compared with a net loss of $552 million in the prior year.
Private Equity reported net income of $7 million, compared with net income of $212 million in the prior year. Net revenue was $36 million, compared with $410 million in the prior year, primarily due to lower net valuation gains on privately held investments.
Treasury and CIO reported a net loss of $46 million, compared with a net loss of $429 million in the prior year. Net revenue was $87 million, compared with a loss of $648 million in the prior year. Current-quarter net interest income was a loss of $10 million, compared with a loss of $558 million in the prior year, reflecting the benefit of higher interest rates and reinvestment opportunities.
Other Corporate reported net income of $408 million, compared with a net loss of $335 million in the prior year. The current quarter included $227 million of legal expense compared with approximately $600 million of legal expense in the prior year. The current quarter included over $200 million of net income benefit from tax adjustments.
JPMORGAN CHASE (JPM)(*)
| Results for JPM ($ millions) | 2Q14 | 1Q14 | 2Q13 | 1Q14 | 2Q13 |
|---|
| $ O/(U) | O/(U) % | $ O/(U) | O/(U) % |
|---|
| Net Revenue | $ 25,349 | $ 23,863 | $ 25,958 | $ 1,486 | 6% | $ (609) | (2)% |
| Provision for Credit Losses | 692 | 850 | 47 | (158) | (19) | 645 | NM |
| Noninterest Expenses | 15,431 | 14,636 | 15,866 | 795 | 5 | (435) | (3) |
| Net Income | $ 5,985 | $ 5,274 | $ 6,496 | $ 711 | 13% | $ (511) | (8)% |
(*)Presented on a managed basis. See note on page 12 for further explanation of managed basis. Net revenue on a U.S. GAAP basis totaled $24.5 billion, $23.0 billion, and $25.2 billion for the second quarter of 2014, first quarter of 2014, and second quarter of 2013, respectively.
Discussion of Results:
Net income was $6.0 billion, down $511 million from the prior year. The decrease was driven by higher provision for credit losses and lower net revenue, partially offset by lower noninterest expense.
Net revenue was $25.3 billion, down $609 million, or 2%, compared with the prior year. Noninterest revenue was $14.3 billion, down $782 million, or 5%, compared with the prior year. Net interest income was $11.0 billion, up $173 million, or 2%, compared with the prior year, reflecting the impact of higher investment securities yields, lower long-term debt and deposit yields, and higher loan balances, largely offset by lower loan yields and lower trading balances.
The provision for credit losses was $692 million, compared with $47 million from the prior year. The total consumer provision for credit losses was $848 million, compared with a benefit of $29 million in the prior year. The current-quarter consumer provision reflected a $354 million reduction in the allowance for loan losses, compared to a $1.5 billion reduction in the prior year. The current-quarter consumer allowance release primarily reflects the continued improvement in home prices and delinquencies. Consumer net charge-offs were $1.2 billion, compared with $1.5 billion in the prior year, resulting in net charge-off rates of 1.34% and 1.66%, respectively. The wholesale provision for credit losses was a benefit of $156 million, compared with an expense of $76 million in the prior year. Wholesale net recoveries were $44 million, compared with net recoveries of $67 million in the prior year, resulting in net recovery rate of 0.06% and 0.09%, respectively. The Firm's allowance for loan losses to period-end loans retained1 was 1.69%, compared with 2.06% in the prior year. The Firm's nonperforming assets totaled $9.0 billion, down from the prior quarter and prior year levels of $9.5 billion and $11.0 billion, respectively.
Noninterest expense was $15.4 billion, down $435 million, or 3%, compared with the prior year, driven by lower expense in mortgage production and servicing and lower performance-related compensation in the Corporate & Investment Bank, predominantly offset by higher cost of controls. The current quarter noninterest expense included $669 million of legal expense, compared with $678 million of legal expense in the prior year.
Key Metrics and Business Updates:
(All comparisons refer to the prior-year quarter except as noted)
- Basel III Common Equity Tier 1 ratio was 9.8%.
- Headcount was 245,192, a decrease of 8,871, compared with the prior year.
1. Notes on non-GAAP financial measures:
- In addition to analyzing the Firm's results on a reported basis, management reviews the Firm's consolidated results and the results of the lines of business on a "managed" basis, which is a non-GAAP financial measure. The Firm's definition of managed basis starts with the reported U.S. GAAP results and includes certain reclassifications to present total consolidated net revenue for the Firm (and for each of the business segments) on a fully taxable-equivalent ("FTE") basis. Accordingly, revenue from investments that receive tax credits and tax-exempt securities is presented in the managed results on a basis comparable to taxable securities and investments. This non-GAAP financial measure allows management to assess the comparability of revenue arising from both taxable and tax-exempt sources. The corresponding income tax impact related to tax-exempt items is recorded within income tax expense. These adjustments have no impact on consolidated net income/(loss) as reported by the Firm or on net income/(loss) as reported by the lines of business.
- The ratio of the allowance for loan losses to end-of-period loans excludes the following: loans accounted for at fair value and loans held-for-sale; purchased credit-impaired ("PCI") loans; and the allowance for loan losses related to PCI loans. Additionally, Real Estate Portfolios net charge-offs and net charge-off rates exclude the impact of PCI loans.
- Tangible common equity ("TCE") and return on tangible common equity ("ROTCE") are each non-GAAP financial measures. TCE represents the Firm's common stockholders' equity (i.e., total stockholders' equity less preferred stock) less goodwill and identifiable intangible assets (other than MSRs), net of related deferred tax liabilities. ROTCE measures the Firm's earnings as a percentage of TCE. TCE and ROTCE are meaningful to the Firm, as well as analysts and investors, in assessing the Firm's use of equity, as well as facilitating comparisons of the Firm with competitors.
- Common Equity Tier 1 ("CET1") capital and the CET1 ratio under the Basel III Advanced Fully Phased-In rules, and the U.S. proposed supplementary leverage ratio ("SLR") are each non-GAAP financial measures. These measures are used by management, bank regulators, investors and analysts to assess and monitor the Firm's capital position. For additional information on these measures, see Regulatory capital on pages 161-165 of JPMorgan Chase & Co.'s Annual Report on Form 10-K for the year ended December 31, 2013, and on pages 63-68 of the Firm's Quarterly Report on Form 10-Q for the quarter ended March 31, 2014.
- The CIB provides non-GAAP financial measures, as such measures are used by management to assess the underlying performance of the business and for comparability with peers.
- The ratio of the allowance for loan losses to end-of-period loans excludes the impact of consolidated Firm-administered multi-seller conduits and trade finance loans, to provide a more meaningful assessment of CIB's allowance coverage ratio.
- Prior to January 1, 2014, the CIB provided non-GAAP financial measures excluding the impact of FVA (effective fourth quarter 2013) and DVA on net revenue and net income. Beginning in the first quarter 2014, the Firm does not exclude FVA and DVA from its assessment of business performance; however, the Firm continues to present these non-GAAP measures for the periods prior to January 1, 2014, as they reflected how management assessed the underlying business performance of the CIB in those prior periods.
2. Additional notes on financial measures:
- Core loans include loans considered central to the Firm's ongoing businesses; core loans exclude runoff portfolios, discontinued portfolios and portfolios the Firm has an intent to exit.
- Headcount-related expense includes salary and benefits (excluding performance-based incentives), and other noncompensation costs related to employees.
- Consumer & Community Banking allocated equity includes $3.0 billion of capital held at the Consumer & Community Banking level related to legacy mortgage servicing matters.
- The credit and debit volume metric is based on Nilson data as of 2013.
- Consumer & Business Banking deposit rankings are based on the Firm's and peer disclosures as of the first quarter of 2014.
- Mortgage Banking provision for credit losses is included in the functional results of Real Estate Portfolios, in production expense in Mortgage Production, and in core servicing expense in Mortgage Servicing.
- Credit card sales volume is presented excluding Commercial Card. Rankings and comparison of general purpose credit card sales volume are based on disclosures by peers and internal estimates. Rankings are as of the first quarter of 2014.
- Global Visa ranking based on consumer and business credit card sales volume is based on Visa data as of 1Q14.
- The eCommerce volume metric for the top 500 internet merchants is based on the 2013 Internet Retailer Top 500 Guide.
- Asset Management pretax margin represents income before income tax expense divided by total net revenue which is, in management's view, a comprehensive measure of pretax performance derived by measuring earnings after all costs are taken into consideration. It is, therefore, another basis that management uses to evaluate the performance of Asset Management against the performance of its peers.
- The amount of credit provided to clients represents new and renewed credit, including loans and commitments. The amount of credit provided to small businesses reflects loans and increased lines of credit provided by Consumer & Business Banking; Card, Merchant Services & Auto; and Commercial Banking. The amount of credit provided to nonprofit and government entities, including states, municipalities, hospitals and universities, represents that provided by the Corporate & Investment Bank and Commercial Banking.
JPMorgan Chase & Co. (NYSE: JPM) is a leading global financial services firm and one of the largest banking institutions in the United States of America (U.S.), with operations worldwide; the Firm has $2.5 trillion in assets and $219.7 billion in stockholders' equity. The Firm is a leader in investment banking, financial services for consumers and small businesses, commercial banking, financial transaction processing, asset management and private equity. A component of the Dow Jones Industrial Average, JPMorgan Chase & Co. serves millions of consumers in the U.S. and many of the world's most prominent corporate, institutional and government clients under its J.P. Morgan and Chase brands. Information about J.P. Morgan's capabilities can be found at jpmorgan.com and about Chase's capabilities at chase.com. Information about the Firm is available at www.jpmorganchase.com.
JPMorgan Chase & Co. will host a conference call today at 8:30 a.m. (Eastern Time) to present second quarter financial results. The general public can access the call by dialing (866) 541-2724 or (866) 786-8836 in the U.S. and Canada, or (706) 634-7246 for international participants. Please dial in 10 minutes prior to the start of the call. The live audio webcast and presentation slides will be available on the Firm's website, www.jpmorganchase.com, under Investor Relations, Investor Presentations.
A replay of the conference call will be available beginning at approximately noon on July 15, 2014, through midnight, August 2, 2014, by telephone at (855) 859-2056 or (800) 585-8367 (U.S. and Canada) or (404) 537-3406 (international); use Conference ID# 51815263. The replay will also be available via webcast on www.jpmorganchase.com under Investor Relations, Investor Presentations. Additional detailed financial, statistical and business-related information is included in a financial supplement. The earnings release and the financial supplement are available at www.jpmorganchase.com.
This earnings release contains forward-looking statements within the meaning of the Private Securities Litigation Reform Act of 1995. These statements are based on the current beliefs and expectations of JPMorgan Chase & Co.'s management and are subject to significant risks and uncertainties. Actual results may differ from those set forth in the forward-looking statements. Factors that could cause JPMorgan Chase & Co.'s actual results to differ materially from those described in the forward-looking statements can be found in JPMorgan Chase & Co.'s Annual Report on Form 10-K for the year ended December 31, 2013, and Quarterly Report on Form 10-Q for the quarter ended March 31, 2014, which have been filed with the Securities and Exchange Commission and are available on JPMorgan Chase & Co.'s website (https://jpmorganchaseco.gcs-web.com/financial-information/sec-filings) and on the Securities and Exchange Commission's website (www.sec.gov). JPMorgan Chase & Co. does not undertake to update the forward-looking statements to reflect the impact of circumstances or events that may arise after the date of the forward-looking statements.